Monopulse instantaneous 3D imaging for wideband radar system
LI Yuhan, QI Wei, DENG Zhenmiao, FU Maozhong, and ZHANG Yunjian
1. School of Information, Xiamen University, Xiamen 361005, China; 2. Beijing Institute of Tracking and Telecommunications Technology, Beijing 100094, China; 3. School of Electronics and Communication Engineering,Sun Yat-sen University, Guangzhou 510275, China
Abstract: To avoid the complicated motion compensation in interferometric inverse synthetic aperture (InISAR) and achieve realtime three-dimensional (3D) imaging, a novel approach for 3D imaging of the target only using a single echo is presented. This method is based on an isolated scatterer model assumption,thus the scatterers in the beam can be extracted individually.The radial range of each scatterer is estimated by the maximal likelihood estimation. Then, the horizontal and vertical wave path difference is derived by using the phase comparison technology for each scatterer, respectively. Finally, by utilizing the relationship among the 3D coordinates, the radial range, the horizontal and vertical wave path difference, the 3D image of the target can be reconstructed. The reconstructed image is free from the limitation in InISAR that the image plane depends on the target ’s own motions and on its relative position with respect to the radar. Furthermore, a phase ambiguity resolution method is adopted to ensure the success of the 3D imaging when phase ambiguity occurs. It can be noted that the proposed phase ambiguity resolution method only uses one antenna pair and does not require a priori knowledge, whereas the existing phase ambiguity methods may require two or more antenna pairs or a priori knowledge for phase unwarping. To evaluate the performance of the proposed method, the theoretical analyses on estimation accuracy are presented and the simulations in various scenarios are also carried out.
Keywords: cross-correlation operation, phase ambiguity resolution, wave path difference estimation, monopulse three-dimensional (3D) imaging.
1. Introduction
Inverse synthetic aperture radar (ISAR) [1-5] is extensively used in military and civilian applications since it can image non-cooperative targets in all weathers. Although the traditional ISAR can generate a two-dimensional (2D)high-resolution image of targets, it has some widely accepted defects. For example, the ISAR image cannot provide height information of the scattering centers.Moreover, the ISAR image cannot show the real shape of the target because it is the projection of the target on the range-Doppler plane. Thus, to overcome the aforementioned drawbacks, several three-dimensional (3D) imaging techniques have been proposed.
Soumekh [6] discussed the application of the interference technology in ISAR imaging and proposed a method of obtaining the high dimensional scatterer center from a dual-channel ISAR complex image for the first time.After that, the 3D interferometric ISAR (InISAR) imaging algorithm has been a popular issue in the field of radar signal imaging [7-11].
High-quality ISAR 2D imaging is the premise and foundation for InISAR 3D imaging. To obtain a highquality ISAR image, it is necessary to perform a motion compensation operation on the non-cooperative targets when multiple pulses are used [12-15]. The nature of interferometric processing requires highly coherent data. To keep the coherence property of the echoes, Liu et al.[16]proposed an approach to jointly implement the range alignment and compensate the phase difference caused by the motion of the target on multiple pulses. However, this method may not work well when the higher order motion occurs, such as accelation and jerk. Therefore, if 3D imaging can be accomplished in only one pulse, the aforementioned problems caused by the motion of the target during multiple pulses can be directly avoided.
The InISAR 3D imaging algorithm also has to deal with the phase ambiguity phenomena. The phase ambiguity phenomenon occurs when the possible variation range of the phase could exceed 2π. It is known that the interferometric phase is mainly related to the size of the target,the baseline length, and the distance of the target, therefore the phase ambiguity may be avoided by constraining these parameters [17]. However, the constrained parameters may decrease the precision of the imaging [18] and be not viable in the practical applications. To overcome the phase ambiguity problem, Zhang et al. [19] proposed an extra two-antenna pair with a smaller baseline to resolve the phase ambiguity in the interferometric systems.However, adding new antenna pairs may be not feasable for existing 3D InISAR radar systems. In [20], a phase unwrapping technique was presented to obtain the unambiguous phase. Unfortunately, this method required an unambiguous initial value as a priori knowledge, which may not be always satisfied. Therefore, the existing phase ambiguity resolution methods are limited in some applications.
A 3D image can be also obtained with the traditional amplitude comparison monopulse technology [2,21-25].Most of them use multiple pulses to combine with the ISAR technology. Some methods utilize the 1D range profile and the monopulse angle measurement to achieve monopulse radar 3D imaging. Since the monopulse angle measurement is completed in a single echo, the radar system can achieve a good real-time performance and benefit from the low complexity of the algorithm. The cost of the hardware of the radar system can be also greatly reduced [26]. However, these methods only have the superior performance for the short distance targets and may not be suitable for long-distance targets [10].
In this work, we present a monopulse 3D imaging method by using the centroid wave path difference estimation and scatterer phase ambiguity resolution techniques.First, the isolated scatterers are detected and the corresponding radial range estimates are obtained. The echo of each scatterer can be extracted and then the range profile coregistration and multi-scatterer separation can be achieved. Then, by applying the cross-correlation operation to the echoes of the horizontal and vertical antenna pairs,the corresponding wave path difference of the scatterers can be obtained from the phase of the cross-correlation result. Finally, the 3D coordinates of scatterers which are functions of the radial range, horizontal and vertical wave path difference can be calculated and the 3D image of the target can be constructed. It should be mentioned that the phase ambiguity is eliminated by using the unambiguous wave path difference estimated from the frequencies of the cross-correlation results. The proposed method does not require extra antenna pairs and a priori knowledge,thus it can be used in traditional wideband radar systems.
The rest of this paper is organized as follows. The radar model and signal model are introduced in Section 2.The proposed monopulse 3D imaging (MPI) method is presented in Section 3. In Section 4, the accuracy of the proposed method is analyzed in detail. Numerical experiments are carried out in Section 5 to show the effectiveness of the proposed method. Finally, conclusions are given in Section 6.
2. Radar model and signal format
In this section, we introduce the system geometry followed by a derivation of the signal model.
2.1 Radar model
Fig. 1(a) is the radar system configuration, which is the same as the antenna configuration of the traditional wideband phased array radar systems. In such a system, the antennas are commonly divided into four quadrants A, B,C and D, which are shown in Fig. 1(b), and the system is used to achieve amplitude comparison monopulse (ACM).Different from ACM, the MPI system is constituted by A,B and C in Fig. 1(a), and the radar coordinate system(O,X,Y,Z)is established consequently. Without loss of generality, A, B and C are called the channels. In phased array radar systems, the signal is transmitted by the whole antenna array. For convenience, in this paper, we assume that in the MPI system, A is both the transmitter and the receiver, but B and C are just receivers.
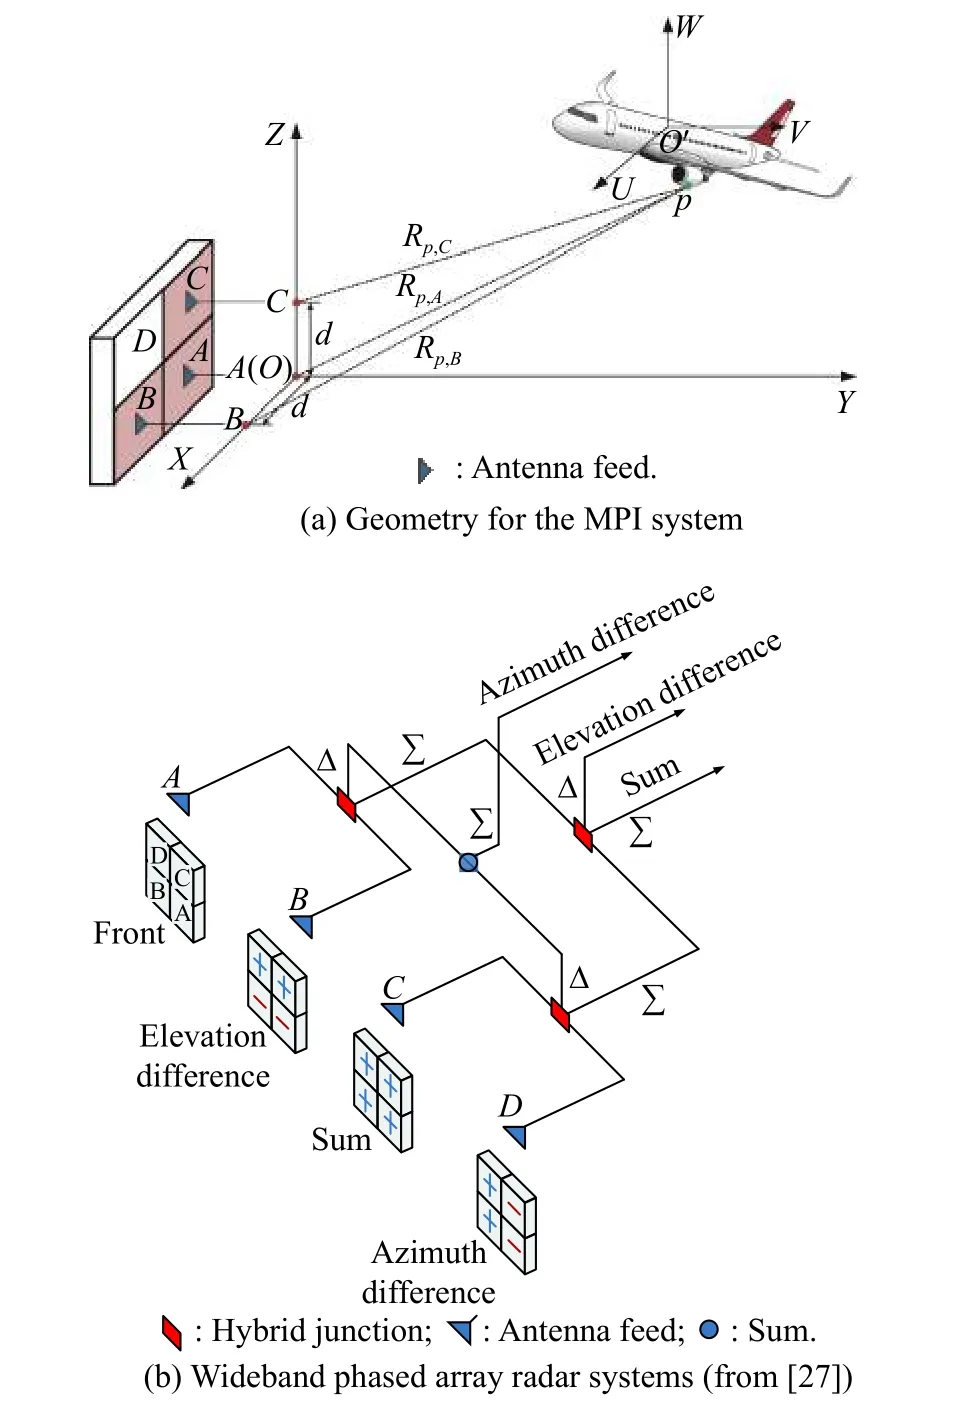
Fig. 1 Illustration of the radar system
In the radar coordinate system ( O,X,Y,Z), A is located at the origin O with coordinates ( 0,0,0) , B and C are located at X and Z axes with the coordinates (d,0,0) and(0,0,d), respectively. A, B and C construct two pairs of mutually perpendicular baselines with length d, which are AB=d and AC=d . We assume that O′is the center of the target with coordinates (x0,y0,z0) (hereinafter referred to as the central coordinate), and ( x0,y0,z0) can denote the relative position between the target and the radar.For representing the target size more conveniently, we establish the target coordinate system (O′,U,V,W) withO′as the origin, and it is supposed that ( O′,U,V,W) is parallel to the radar coordinate system (O,X,Y,Z). For any scatterer p on the target other than O′, (xp,yp,zp) represents its coordinate in the radar system (O,X,Y,Z), while(up,vp,wp)represents its coordinate in the target system(O′,U,V,W). Obviously, we have the relationship(xp,yp,zp)=(up,vp,wp)+(xo,yo,zo). What we discuss below is how to reconstruct the coordinates of scatterers in(O,X,Y,Z)to achieve the 3D imaging of the target. Since the proposed method can work in a single pulse, the translation and rotation of the target are not considered in the signal model.
2.2 Signal model
Suppose that A transmits a linear frequency modulated(LFM) signal. The complex envelope of the transmitted pulse has the following form:

where

t is the time, T is the pulse width, and γ is the chirp rate.Then the carrier wave is modulated by s(t) and the radio frequency (RF) signal is emitted. The transmitted signal can be described as

where fcis the carrier frequency. We assume that Rp,qis the distance from the channel q to the scatterer p at time t , p=1,2,···,P , P is the number of the scatterers, and q=A,B,Cdenotes the three channels. Then at the channel q, the down-conversion mixer converts the received RF signal of the scatterer p into the baseband signal,which can be written as

where zp=aejθis the complex backscattering coefficient of the scatterer p, a is the amplitude of z, θ is the phase of z, and the delay time of the transmitted signal received by the channel q is

where c is the speed of light, and Rp,qis the radial range between the scatterer p and the channel q.
Performing the Fourier transform (FT) on the baseband signal srq(t) yields the spectrum

where S(f)=rect(f/Bω)exp(−jπf2/γ) is the spectrum of s(t), and Bωis the bandwidth. Then the matched filter outputs in the frequency domain can be obtained as

where x∗denotes the complex conjugate of x. After sampling Yq(f) over f, the discrete spectrum is given by

where

k=−K,···,0,···,K, Kis the index of frequency points,denotes the round operation which rounds a number to the nearest integer that is greater than or equal to x. ∆ f =1/T is the frequency sampling step.
3. Monopulse 3D imaging method
3.1 3D imaging for single scatterer
Taking the scatterer p as an example, the signals in the channel A and B after matched filtering are

and

respectively. Applying the cross-correlation operation in the frequency domain to the above two signals, we have

where ∆ Rp,h=Rp,A−Rp,Bis defined as the horizontal wave path difference. Performing inverse discrete Fourier transform (IDFT) to Xcr(k) and the result can be expressed as
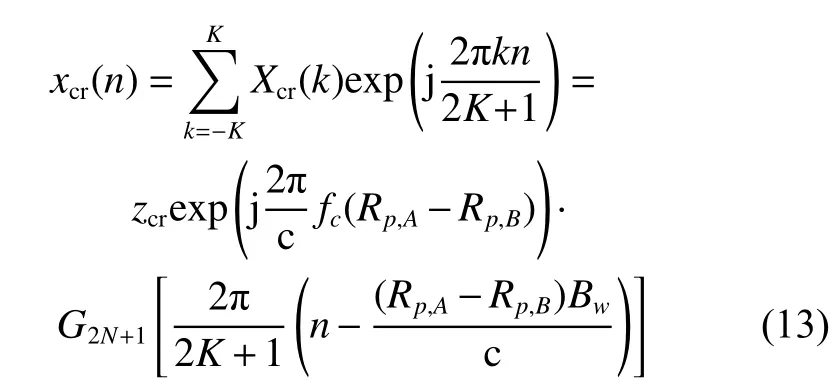

where ∆ ϕ denotes phase difference. According to the linear relationship between the wave path difference and the phase difference, the wave path difference can be expressed as

where λ=c/fcis the carrier wavelength. According to the spatial relationship among the scatterer p and the channels A and B, the horizontal wave path difference can be rewritten as

where

and

are the radial range between the scatterer p and the channels A and B, respectively. By solving (16) and (17), the coordinate of scatterer p in the X axis can be calculated as

Similarly, the coordinate zpcan be calculated as

where

is defined as the vertical wave path difference and

is the radial range between the channel C and the scatterer p. Substituting the obtained coordinate xpand zpinto(17), the reconstructed coordinate ypcan be derived as

Then, the 3D position of the scatterer p is reconstructed as (xp,yp,zp). As aforementioned, (up,vp,wp) is the target system coordinate of the scatterer, which can better reflect the size and details of the target. We can obtain(up,vp,wp)as

where ( xo,yo,zo) is the coordinate of the target centroid.
The 3D imaging of the target not only requires the location of the scatterers but also the intensity of the scatterers. Performing IDFT to Xp,A(k), we obtain the range profiles.

Therefore, the intensity of the scatterer p located at the nth range cell can be estimated as

where |·| denotes the absolute value operation.
By the processing mentioned above, the 3D image of the target can be achieved.
3.2 Range profile coregistration
The wave path differences can cause an overall shift in the range profiles, which is similar to the image mismatch phenomenon in InISAR. This phenomenon can be described as the range profile mismatch and it may lead to the failure of reconstruction of 3D images. The normalized range shift (normalized to the size of range cell∆r=c/(2Bw)) between the range profiles from the channels A and B can be calculated as ∆N=∆Rp,h/(2∆r).When the bandwidth is high enough, we have ∆ N >1. In this case, the same scatterer will locate in different range cells for these two echoes. Therefore, the echoes received by channels B and C should be compensated by the overall wave path differences to match with the echoes received by channel A.
Taking channels A and B as examples. Applying the cross-correlation operation to XA(k) and XB(k) in the frequency domain, we have
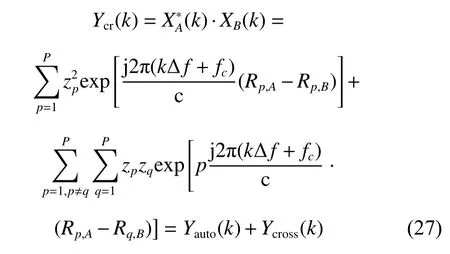
where Yauto(k) and Ycross(k) are the auto-terms and crossterms of the signal in (27). Performing IDFT to (27), the energy of the cross-correlation result Ycr(k) can be accumulated. For the same target, the wave path difference∆Rp,his closed to the same value for all P scatterers. This value is regarded as the horizontal wave path difference of the centroid and denoted byThe sum of the auto terms is the sum of single sinusoidal signals with close frequencies. Therefore, by performing IFT to (27), the energy of all scatterers from the auto-terms will converge into one main peak and the energy from the cross-terms may be dispersed on different peaks, of which the amplitudes are much less than that of the main peak [28].Therefore,can be obtained by estimating the position of the main peak. Then, the mismatch between XA(k)and XB(k) can be mostly eliminated by making use of the compensation termThe compensated signal of the channel B can be expressed as

Similarly, by using the cross-correlation result of the echoes of the channels A and C, the compensated signal of the channel C can be calculated as

3.3 Multi-scatterers separation
After the above range profile coregistration operation, the multi-scatterers separation operation can be further applied to extract each group of the signals which only contains the same scatterer from the echoes of channels A, B and C. Thus, the problem of the estimating wave path difference of multi-scatterers can be translated into a series of problems of estimating wave path difference of the single scatterer. The steps of the scatterer separation method are presented as follows.
Step 1Detection of the scatterers and estimation of the radial range between the scatterer and channel A. The detection threshold is denoted as υ and it can be set according to the relationship Pfa=exp[υ2/(2σ2)], wherePfais the desired probability of false alarm, and σ2is the noise power. The range profile in the channel A can be denoted as xA(n)=IDFT[XA(k)]. If the envelope of xA(n)at the nth range cell exceeds the detection threshold υ, a scatterer is detected. The scatterer number P can be also obtained after the detection in all range cells. When a scatterer is presented at the nth range cell, Rp,Acan be estimated by utilizing the maximum likelihood (ML) estimation [29] and the ML estimator can be denoted by

where R ∈[(n−1)∆r,n∆r).
Step 2Determine the position of the range window.The center of the range window locates atGiven that the scatterers are assumed totally separated in range and the range profiles may still be unmatched even when the range profile coregistration is performed, the size of the range window is usually set as five times of the range cell size.
Step 3Filter scatterers based on the range window.The range profiles in the range window are kept and the range profiles outside the range window is set to 0, just as follows:
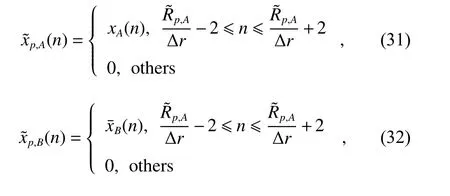

We illustrate an example of using the proposed algorithm in a four-scatterer case in Fig. 2. First, the scatterers can be detected by using the threshold technology.Then, the range estimate between the scatterer p and channel A is obtained by the ML estimation. Then, with the estimated range, the range window is determined. Finally, the range profiles in the range window are kept while that outside the range window is set as 0. In this way, the signal that only contains the echo from the scatterer p is obtained.
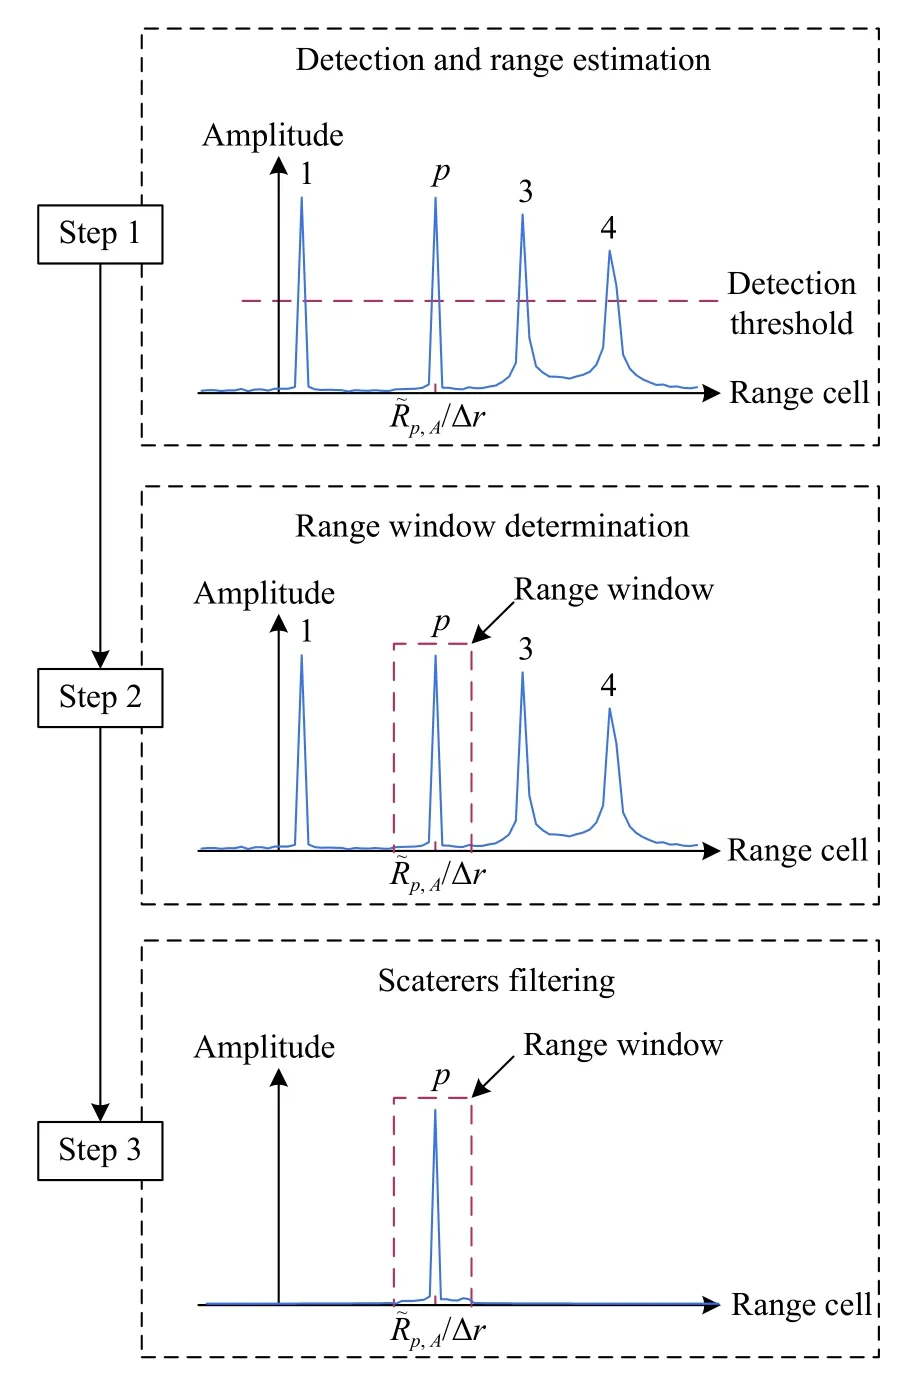
Fig. 2 Flowchart of separating scatterers
After operating multi-scatterers separation,andshould be transformed back to the frequency domain and the compensation in (28) and (29)should be neutralized to restore the original wave path difference. The obtained results can be written as

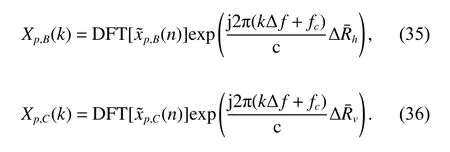
With obtained Xp,A(k) , Xp,B(k) and Xp,C(k), the crosscorrelation operation in (12)-(16) can be performed to reconstruct the coordinates.
It should be mentioned that two or more scatterers may locate in the same range window for some moment. In this case, the scatterer separation algorithm may fail.However, if the targets do not stay still, the scatterers may become separated after a period and the scatterer separation algorithm can work again.
3.4 Ambiguity resolution for phase difference
As shown in the previous analysis, the estimation of the wave path difference is the key in the proposed 3D imaging method. However, since the wave path difference is estimated from the phase difference, when the phase difference is larger than 2π, the phase ambiguity occurs. In this case, the estimated phase difference is an ambiguous value. Taking coordinate xpas an example, when the phase difference ∆ϕ ranges within the interval of [0,2π),we have

i.e.,

When the true coordinate exceeds the unambiguous range in (38), the estimated coordinate will be an ambiguous value. That means we cannot obtain the correct estimation results of wave path difference and coordinates in this circumstance. In the existing methods of 3D imaging, the size of the target is usually required to be within the unambiguous range to avoid phase ambiguity.When the wavelength of the carrier is small, and the baseline length is large, the unambiguous range for the c oordinate tends to be very small. This greatly limits the application of the phase comparison method.
In this section, an ambiguity resolution method using a coarse but unambiguous estimat is applied to resolve the phase ambiguity. Observing (12), it can be noted that the cross-correlation result can be regarded as a single sinusoidal signal. The frequency of the cross-correlation result is f′=∆R∆f/c and it can be estimated by the sinusoidal frequency estimation methods, such as the Rife method[30]. Let ∆ R be the real unambiguous value of wave path difference in this section. The estimate of the wave path difference from the frequency can be expressed as


where N=floor(∆R/λ) is the modulo number, f loor(·) denotes the floor function, Rresis the period residual of the wave path difference, 0 ≤Rres<λ , and mod(·) denotes the modulo operator.
Similarly, the ambiguous estimate of the phase difference can be represented as

where ∆Φ is the unambiguous phase difference, Φresis the period residual of the phase difference, and εϕis the estimation error. The estimate of the wave path difference from the phase difference can be represented as

where ∆Rres=Φresλ/(2π). It can be noted that N should be estimated to resolve the ambiguity of the phase difference. In order to estimate N, we subtract (42) from (40)and round off the result, and then we have

where round(·) denotes the rounding off operator. Thus,the unambiguous wave path differencecan be obtained as

Fig. 3 is an illustration of the ambiguity resolution. The ordinate represents the directly estimated phase difference, which is constrained by the phase maximum value 2 π.The abscissa represents the wave path difference. As shown in Fig. 3, when the phase difference ∆ϕ is given,the wave ambiguous path difference ∆Rphaseis determined by the linear relationship between ∆ϕ and ∆Rphase.Furthermore, if N is known, the unambiguous wave path difference ∆ R˜ can be determined.
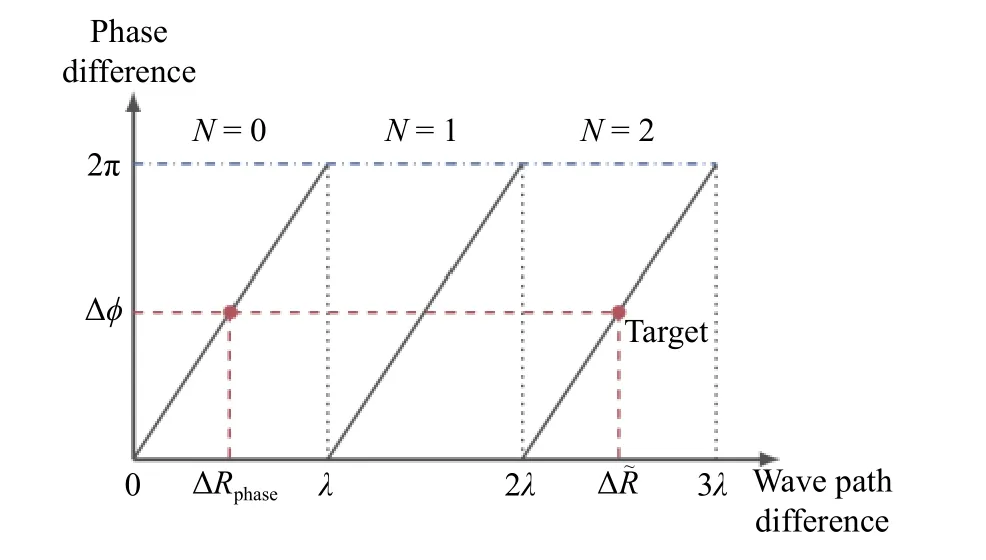
Fig. 3 Illustration of ambiguity resolution
The classical InISAR method has limits on choosing the length of the baseline. As indicated in [19], the length of the baseline should be long enough to ensure that the phase difference can be adequately measured by the system. However, the long baseline may result in a short ambiguity period which causes a severe phase ambiguity phenomenon. The bound of the unambiguous coordinate has been given in (38), where λRp,A≫d2−λ2/4. Consequently, according to (38) and (24), the maximal bound of the size in terms of the targetxo]. Therefore, the restriction of the baseline length is

For example, assume fc=10 GHz, λ=0.03 m ,Rp,A=100 km, (xo,yo,zo)=(75 000,33 000,58 000)m , and u=40 m, the length of the baseline should be d ≤0.02 m.Obviously, the baseline is too small. Consequently, the precision of the imaging result by using the InISAR based method may be low. As for the proposed MPI method,the limitation on the length of the baseline has been overcome with the help of the phase ambiguity resolution method.
3.5 Basic steps of monopulse 3D imaging algorithm
With the above preparations, we illustrate the flowchart of the proposed MPI method in Fig. 4 and the procedure of the proposed MPI method can be enumerated as follows.
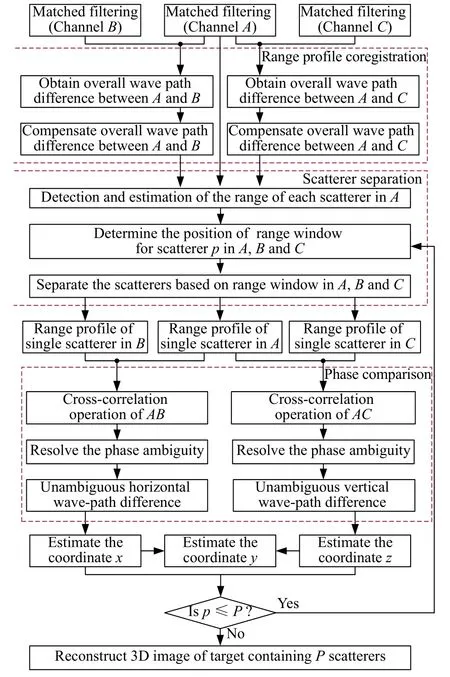
Fig. 4 Flowchart of separating scatterers
Step 1Obtain the matched filter outputs of channels A, B , and C.
Step 2Perform the range profile coregistration operations.
Step 3Perform the multi-scatterers separation operations to extract the signals that only contain scatterer p.
Step 4Apply the cross-correlation operation to the three range profiles along the baseline of { A,B} and{A,C}respectively. The ambiguous estimates of path difference can be obtained by estimating the phase of the main peak of the cross-correlation results. The ambiguity resolution operations should be applied to eliminate the phase ambiguity. Thus, the unambiguous and accurate path difference estimates can be derived.
Step 5According to the relationship between wave path difference and the coordinates, the coordinate xp,zpand ypcan be estimated respectively. Thus, the coordinates of the scatterer p can be reconstructed successfully.
Repeat Step 3 to Step 5 until getting all scatterers’ threedimensional coordinates, and the 3D image can be reconstructed finally.
3.6 Computational cost analysis
The computational cost is evaluated in terms of the floating-point operation (FLOP) performed. The computational cost of the radix-2 fast Fourier transform (FFT) or inverse FFT (IFFT) is assumed to be 10Llog2L for complex data, where L is the number of data. One complex multiplication consists of four real multiplications and two real additions, that is six FLOPs. The FLOP counts of each step are listed in Table 1 where Nmle=∆r/∆mleand ∆mleare the number and step of the search in (30), respectively. Therefore, the overall computational cost of the proposed method is about

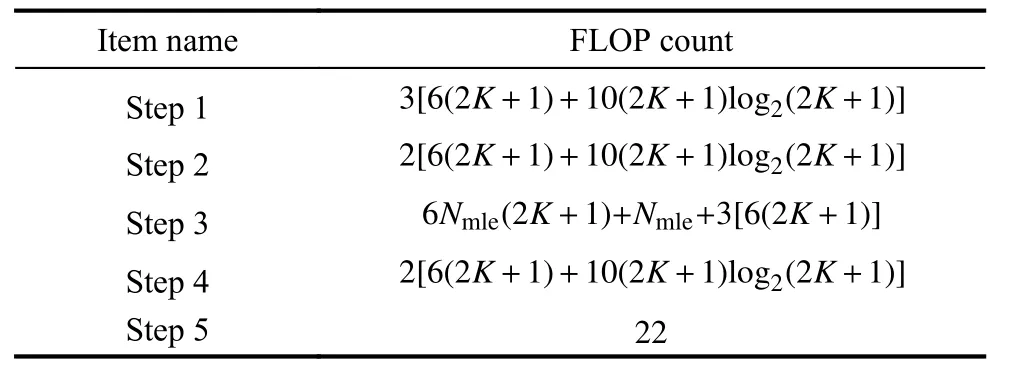
Table 1 FLOP count of each step
4. Precision analysis
In this section, we adopt the precision analysis method in[19] and discuss the precision of the proposed MPI method.We will focus on analyzing the accuracy of the wave path difference estimator and the effect of the baseline length and the signal to noise ratio (SNR).
As shown in (19), the reconstructed coordinate in X-axis is a multi-variable function, i.e.,

Then the root-mean-square error (RMSE) of the coordinate measurement can be written as

where σRand σ∆Rare the RMSE of the measured range R and wave path difference ∆R, respectively. Taking the partial derivatives of xpwith respect to R and ∆ R respectively, we can obtain

where (49) and (50) are the corresponding contributions from range error and wave path difference error, respectively.
Because the range estimate is derived by using the ML estimation, σRcan be represented [29] as

Therefore, (49) can be rewritten as

As for σx2, it is directly related to the accuracy of the phase estimation. According to the RMSE of the phase estimation method proposed in [31], the RMSE of wave path difference σ∆Rcan be expressed as

where S NRc=SNR/(2+1/SNR) is the S NR of the crosscorrelation result. Substituting (53) into (50) results

Thus, the theoretical RMSE of the coordinate estimation can be derived as
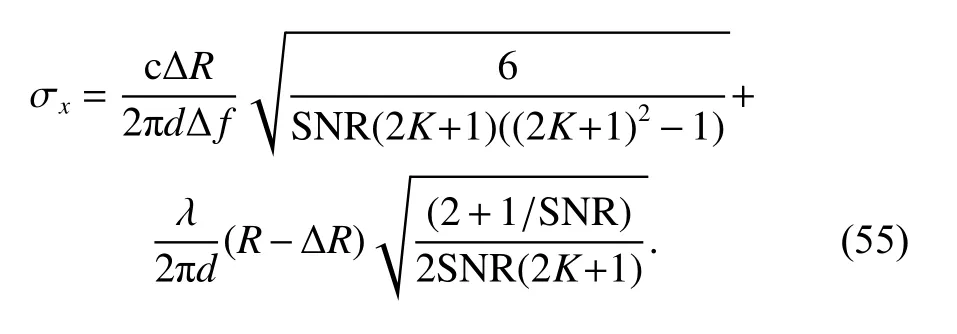
5. Experimental results and analysis
In this section, some experimental results are presented to investigate the performance of the proposed method.
5.1 Simulations data
To demonstrate the effectiveness of the proposed MPI method, several numerical experiments are performed on simulated data sets. Since the proposed method is implemented in a single pulse and relies on only the range profiles to separate the scatterers in the range dimension, the premise of applying our method is to ensure that the scatterers are located in different range cells, that is, the isolated scatterers points model is adopted. The point-scatterers model simulation is established in this part to validate the effectiveness of the proposed method, the model is improved on the basis of [32]. The 3D model of the target and three-view drawing of the scatterers of the target are shown in Fig. 5. The radar system parameters are given in Table 2.
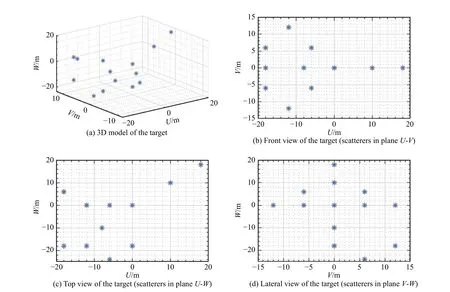
Fig. 5 Ideal model of the target
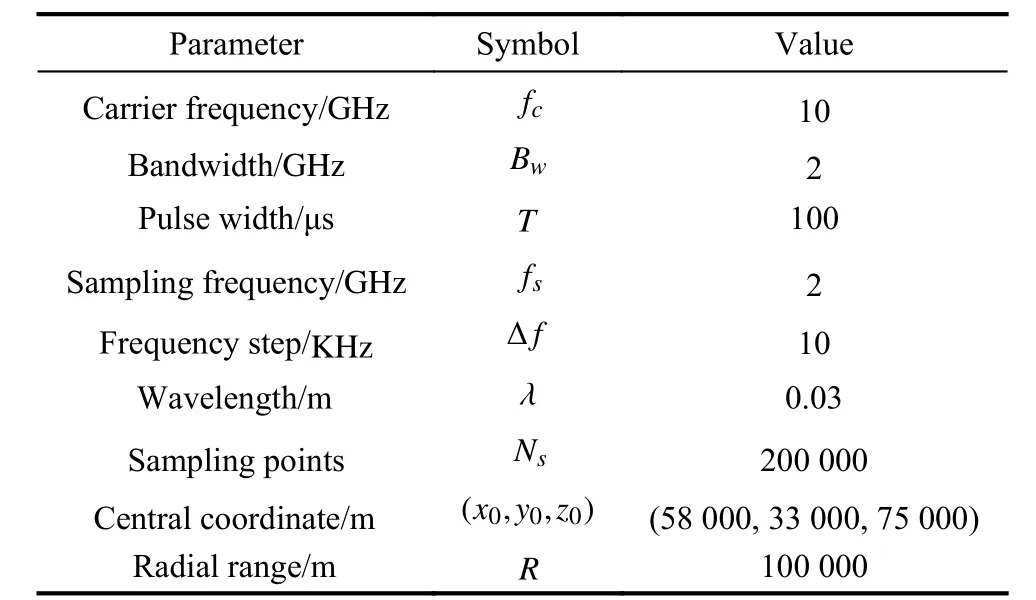
Table 2 Parameters of the radar system
Example 1In this example, we adopt the proposed method to achieve the 3D imaging of the target in Fig. 5.The length of baselines are set as AB=AC=d=5 m, the SNR is set as SNR=5 dB, and other parameters are kept the same as the paramters in Table 2. The final result is shown in Fig. 6. It can be observed that the reconstructed target is superimposed onto the scatterer model. The reconstructed scatterers are near or coincide with the scatterers of the model. It can be also noted that the ambiguity of the wave path difference is successfully resolved in this case.
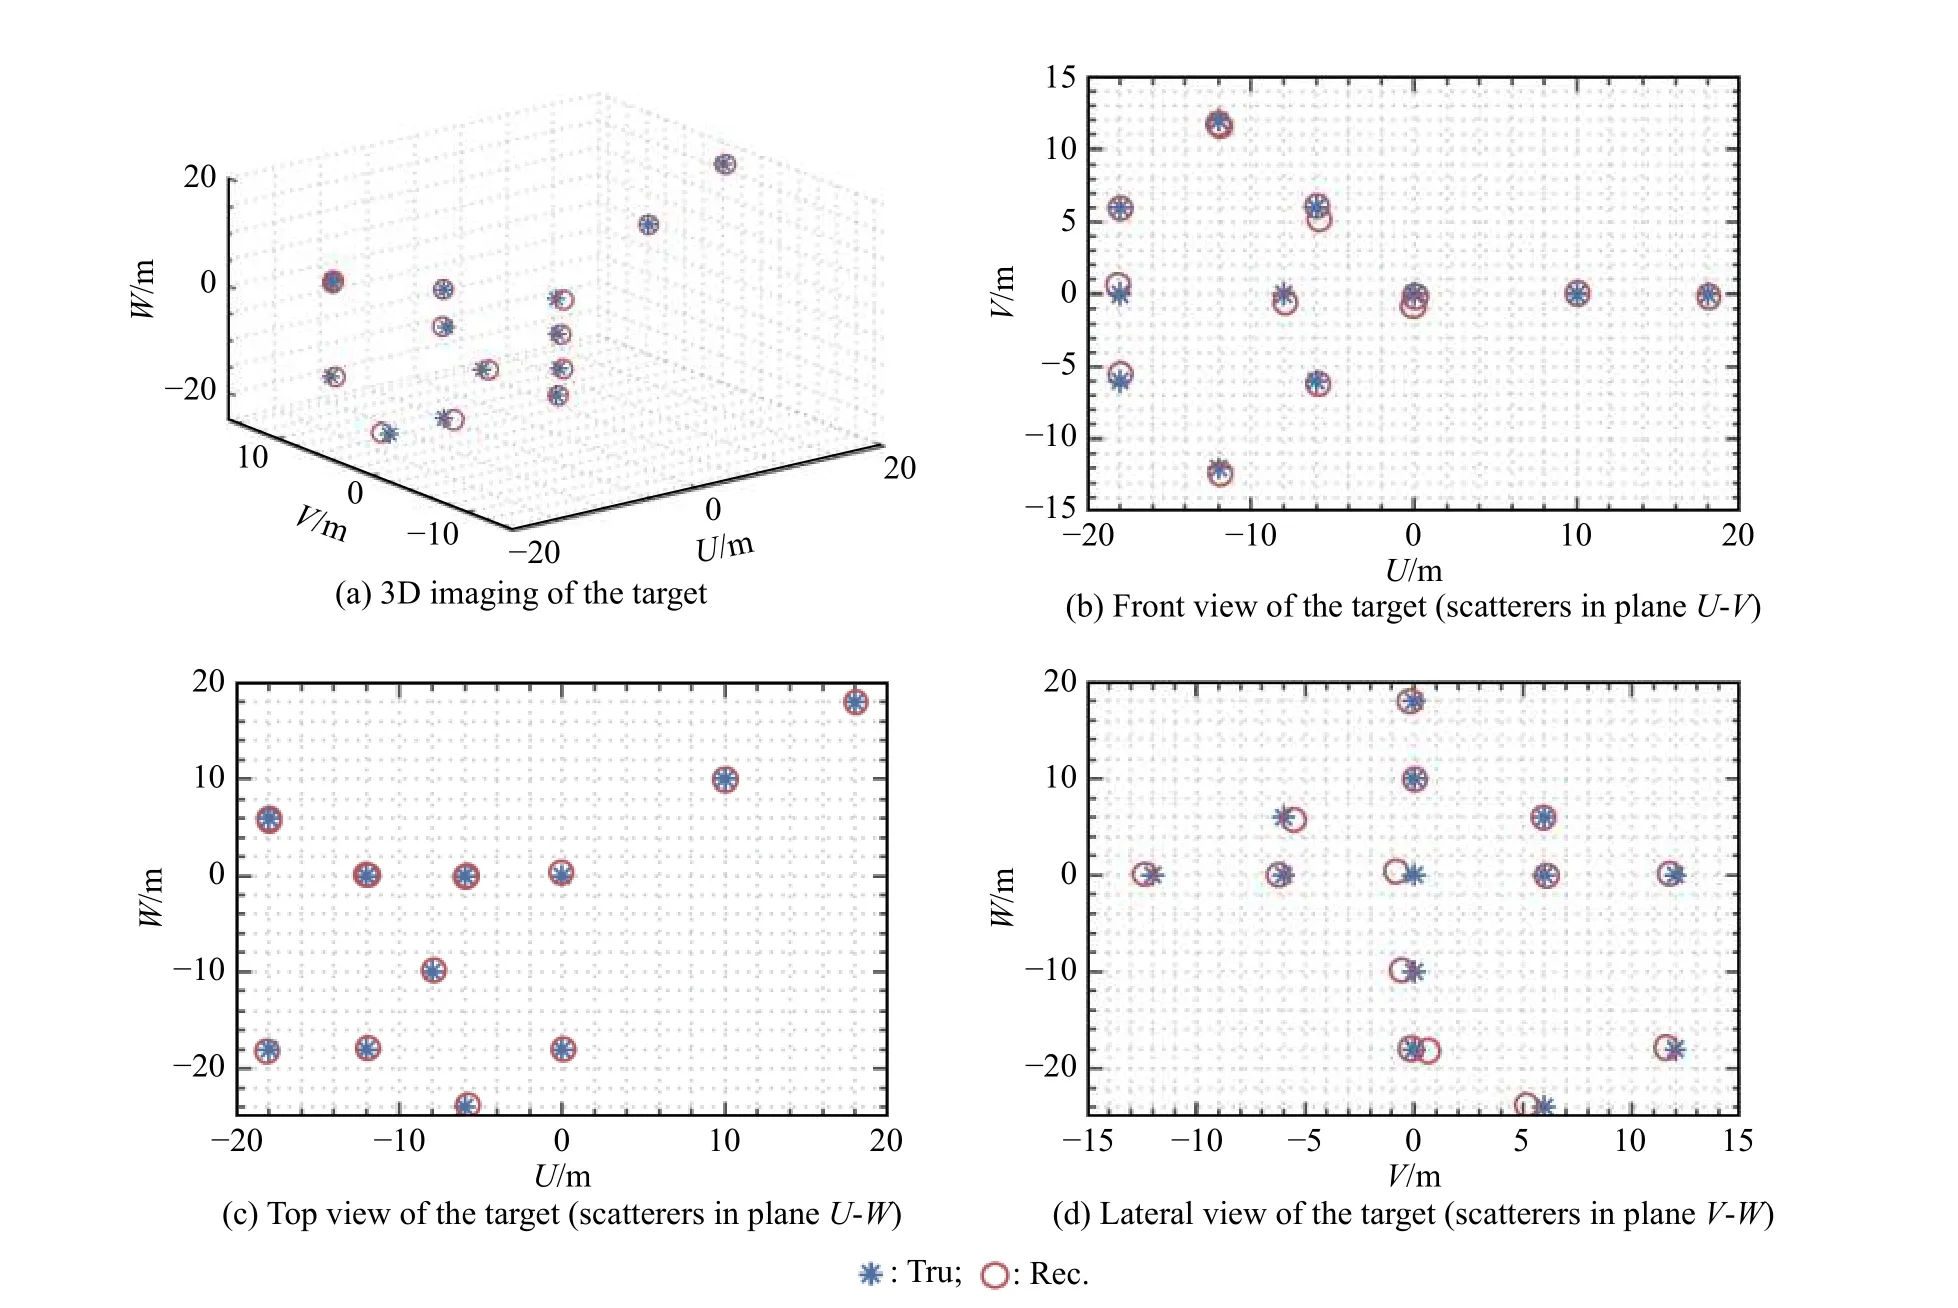
Fig. 6 Results of 3D imaging
Example 2In this example, we demonstrate the precision of the wave path difference and coordinate estimation, which are analyzed theoretically in Section 4. In order to verify the performance for the proposed method in the noisy background, 1 000 times Monte Carlo simulations are carried out for each SNR ranging from−20 dB to 2 0 dB with every step of 1 dB. For the simplicity of the analysis, we assume only one scatterer is in the echo. The baseline remains to be 5 m and other parameters remain the same as the parameters in Table 2.
According to the previous discussion, it can be known that when estimating the wave path difference, an estimate is first obtained by using the frequency estimation.Then the estimate is used to resolve the phase ambiguity.Finally, an unambiguous wave path difference estimate is obtained from the estimated phase difference. Hence, the precision of the final wave path difference estimation is related to both the precision of the frequency estimation and the precision of the phase estimation. The theoretical RMSE of the estimate of the wave path difference from the frequency can be derived as
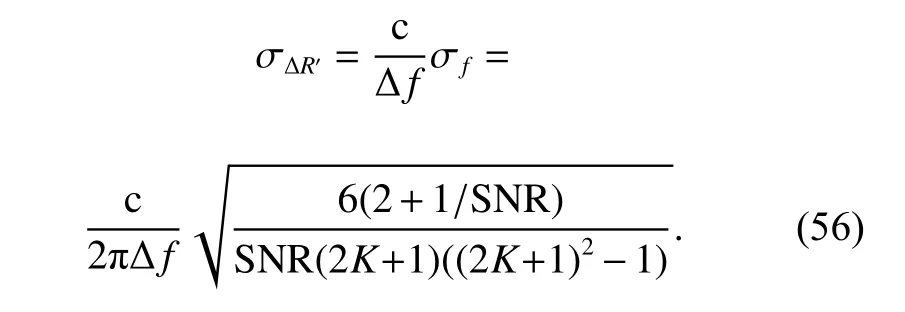
Therefore, the theoretical RMSE calculated with σ∆R′for the coordinate estimation is

Fig. 7 shows two theoretical RMSEs ((53) and (56))and the simulated RMSE for the wave path difference estimation. It can be seen that, when SNR is lower than the inflection point 1, that is SNR=−18 dB, the simulated RMSE would be large. This behavior is due to the fact that the SNR is lower than the threshold of the frequency estimation method. When the SNR ranges from the inflection point 1 to the inflection point 2, the precision of the estimate from the frequency is not high enough to resolve the phase ambiguity. Thus, the simulated RMSE is mainly determined by the performance of the frequency estimation. When the SNR is higher than the inflection point 2, that is SNR=−15 dB, the precision of the estimate from the frequency is high enough to resolve the phase ambiguity. In this case, the simulated RMSE is determined by the performance of the phase difference estimation.
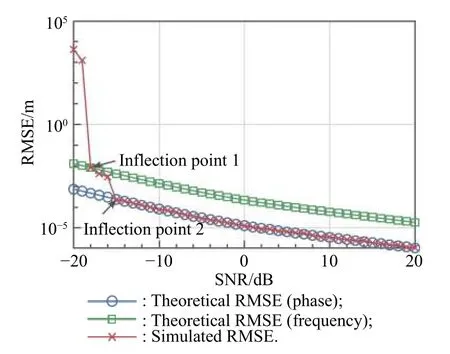
Fig. 7 Performances of wave path difference estimation
Fig. 8 shows the comparison of the simulated RMSE results with two theoretical RMSEs (53) and (56) for the coordinate estimation. It is evident in Fig. 8 that the curve of the simulated RMSE is similar to that of Fig. 7,which means the RMSE of the reconstructed coordinate estimate is mainly affected by the RMSE of the path difference estimate.
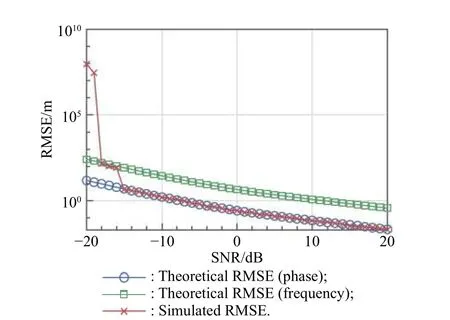
Fig. 8 Performances of coordinate estimation
Example 3This experiment is carried out to demonstrate the performance of the proposed method with various baseline lengths. The length of the baseline directly determines the precision of the reconstruction coordinates. Hence, we investigate the performance of the proposed method with five different sizes of baseline length(0.5 m, 1 m, 2 m, 5 m and 10 m). The other parameters are the same as the previous experiment.
Fig. 9 shows the performance of the proposed method at different lengths of the baseline for a single scatterer. It can be seen that the higher precision of the reconstruction coordinate estimator can be achieved as the baseline length increases. This makes the proposed method have great potential especially in radar systems which have flexible employment of the antennas. It can be also noted that the curves have similar inflection points which means that the length of the baseline does not affect the process of the phase ambiguity resolution.
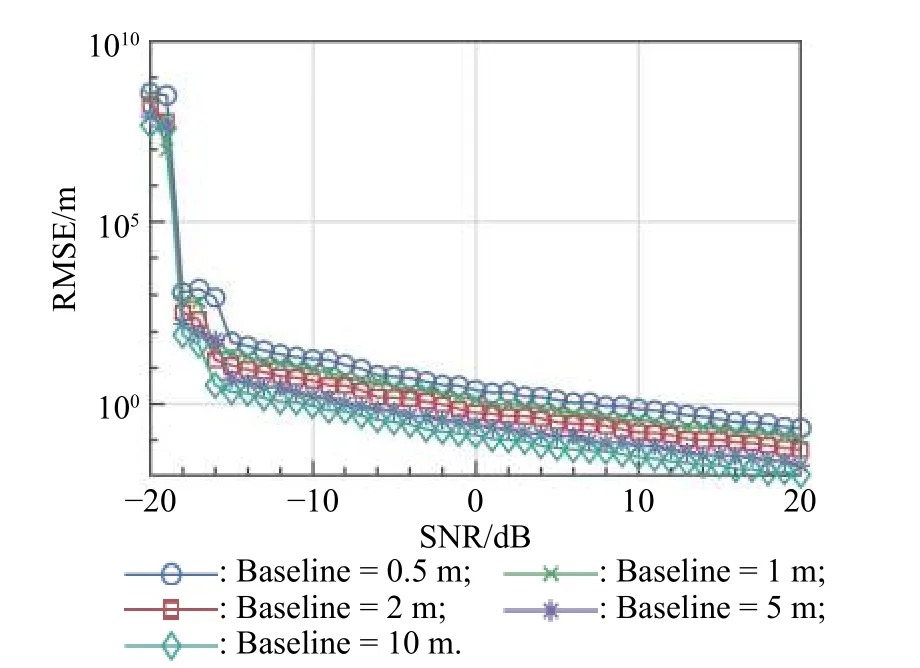
Fig. 9 Performance of various baseline lengths of the proposed method under a single scatterer
Fig. 10 are the results of the 3D target reconstruction with different SNRs (5 dB and 0 dB) and different baseline lengths (5 m and 2 m). These results show that the quality of the 3D image can be improved as the S NR and the baseline length increase.
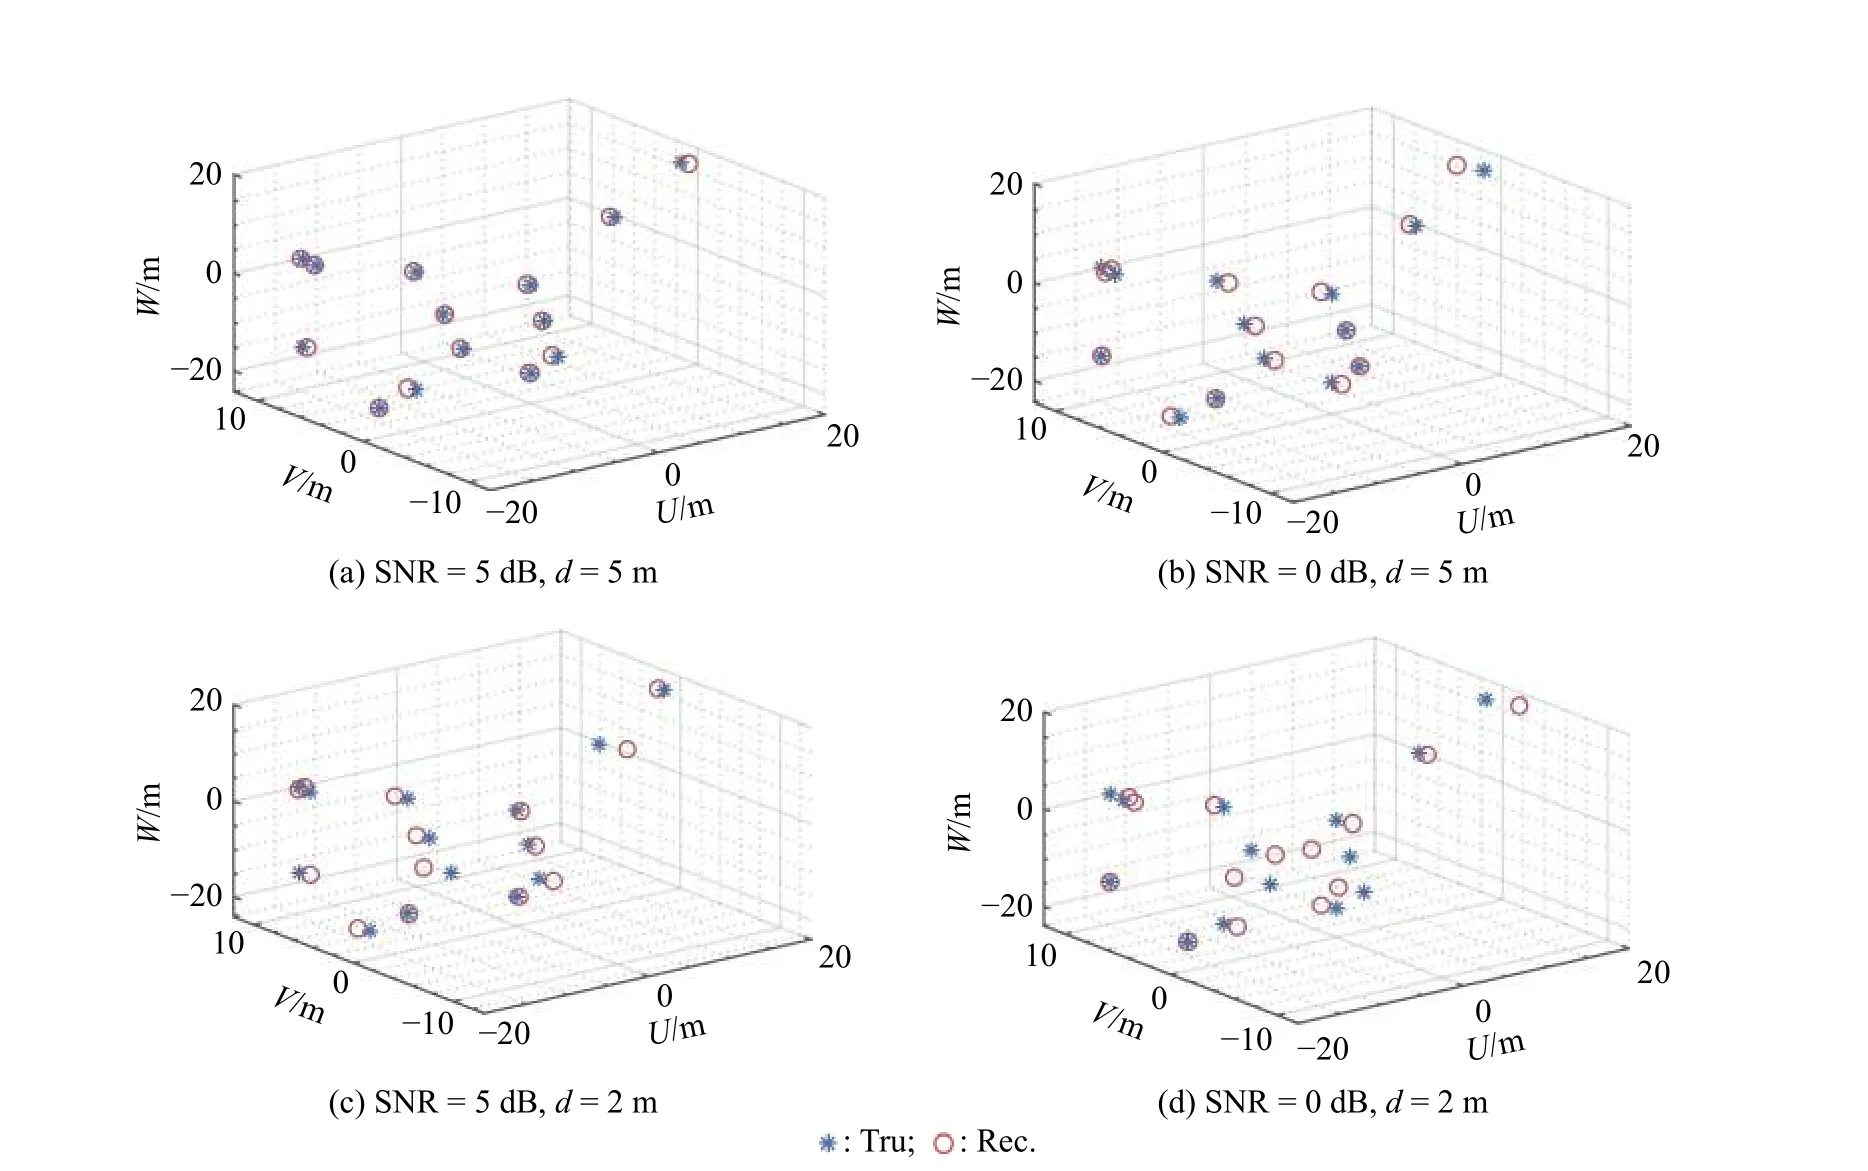
Fig. 10 Result of 3D imaging versus different SNRs and different baseline lengths
Example 4In this experiment, we show the performance of the proposed method with various values of the carrier frequency. The carrier frequency can affect the process of the phase ambiguity resolution. From the previous discussion in Subsection 3.4, it can be known that the wave path difference estimated from the phase is changing periodically with a period of λ. The ambiguity of wave path difference occurs more easily when λ is smaller, while λ is related to the carrier frequency fc.Therefore, the different values of carrier frequency would affect the phase ambiguity resolution. We investigate the performance of the proposed method with four different values of the carrier frequency (5 GHz, 8 GHz,10 GHz and 15 GHz) . The baseline remains to be 5 m, and other parameters are the same as the previous experiment.
Fig. 11 shows the performance of the proposed method at different values of the carrier frequency. From the results, we can see that the inflection point may be different when the different carrier frequency is adopted. Thus,by properly choosing the carrier frequency, the proposed method may work in various SNR conditions.
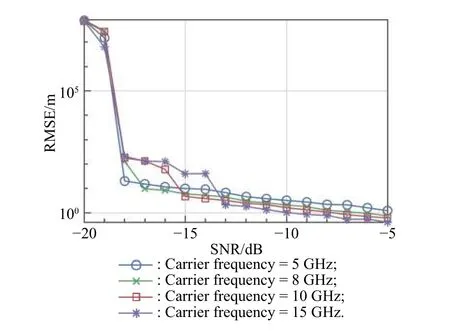
Fig. 11 Performance of the proposed method with various values of carrier frequency
5.2 Evaluation of the proposed method with FEKO generated data
In this section, simulations with electromagnetic data are conducted to test the performance of the proposed method.FEKO software is employed to create these data. FEKO is a suite of professional electromagnetic analysis tool which is widely used for radar cross-section analysis, micro-Doppler feature analysis, radar 3D imaging, electromagnetic compatibility analysis, and so on. Fig. 12(a) is a model of the DJI Phantom 3, the red parts in the picture are the four motors of the drone, and the wheelbase is 350 mm. Generally, the motor parts of the drone are made of metal materials whose electromagnetic radiation coefficient is large, while the other parts of the drone are made of polycarbonate. Therefore, the radar echo signal of the drone mainly comes from the motor parts. The four motors of the drone are used to build the electromagnetic model in FEKO shown in Fig. 12(b). The method of moments (MOM) is employed to simulate the linear polarization backscattering field of motors. We assume that the central coordinate of the four motors is (xo, yo, zo)=(400, 400, 300)in the radar coordinate system, the length of baselines is set as 5 m, and the parameters of the FEKO simulation are presented in Table 3. The simulation results with FEKO generated data are shown in Fig. 13, and for the sake of intuition, the drone model is also attached in Fig. 13. It can be seen that the imaging result of the four scatterers almost coincides with the four motors of the drone.
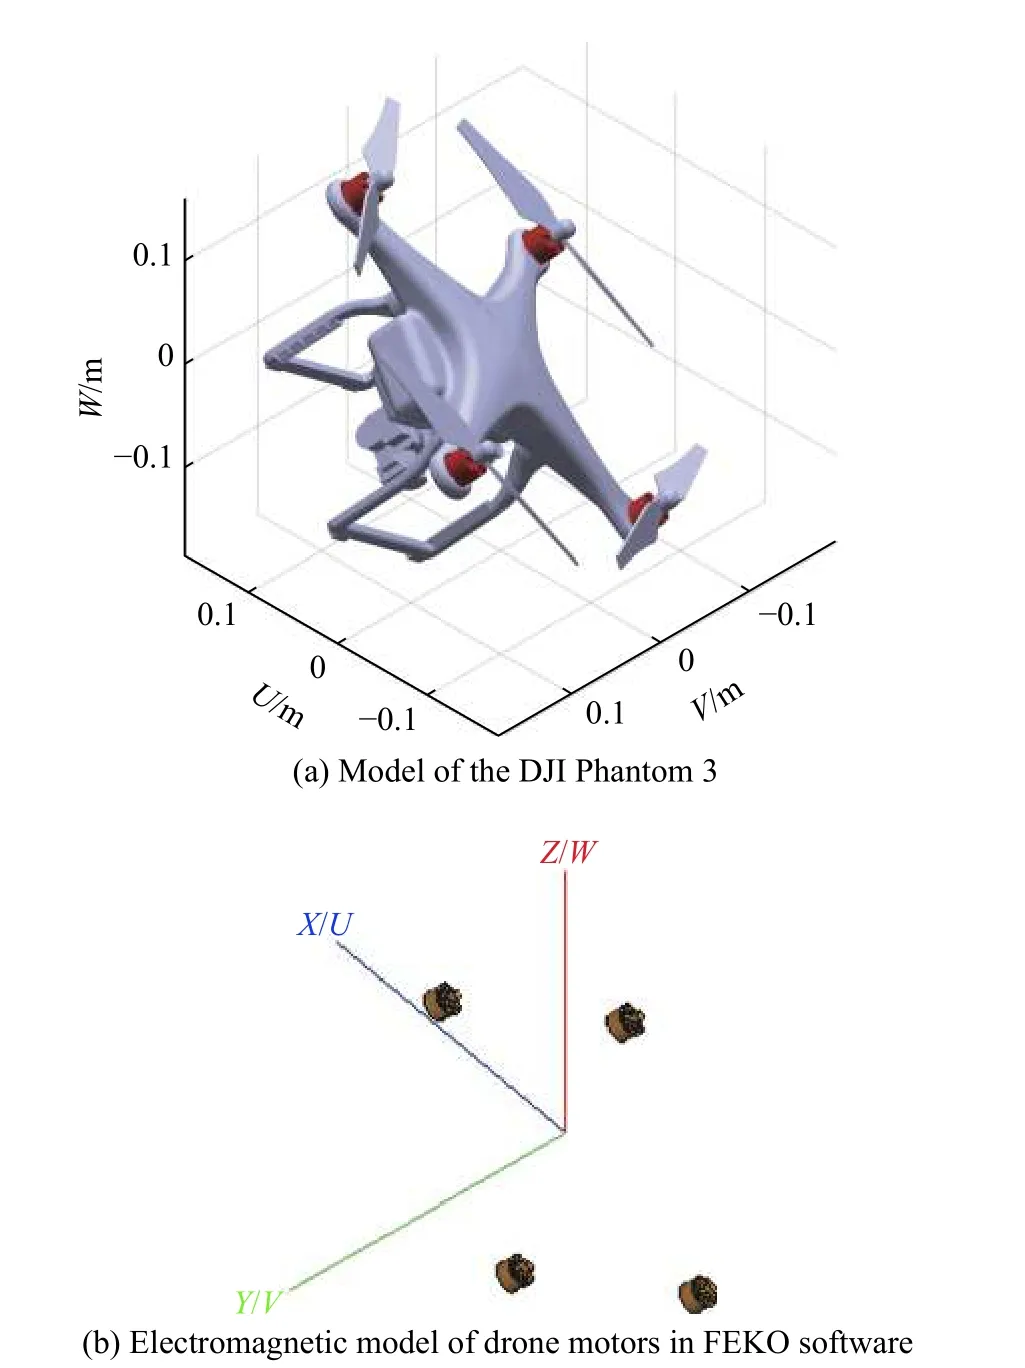
Fig. 12 Illustration of the target setting
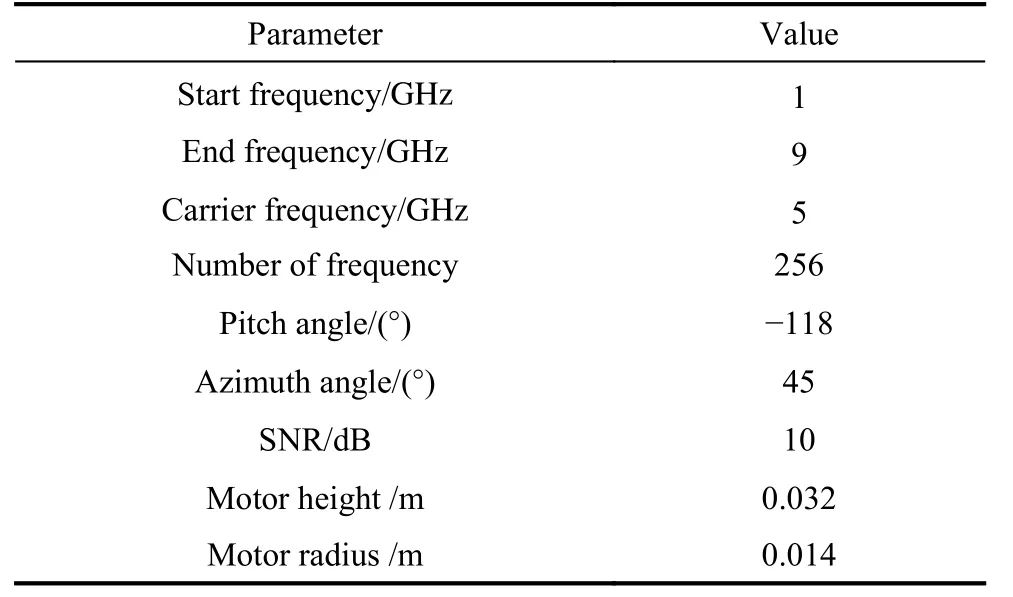
Table 3 Parameter setting of FEKO
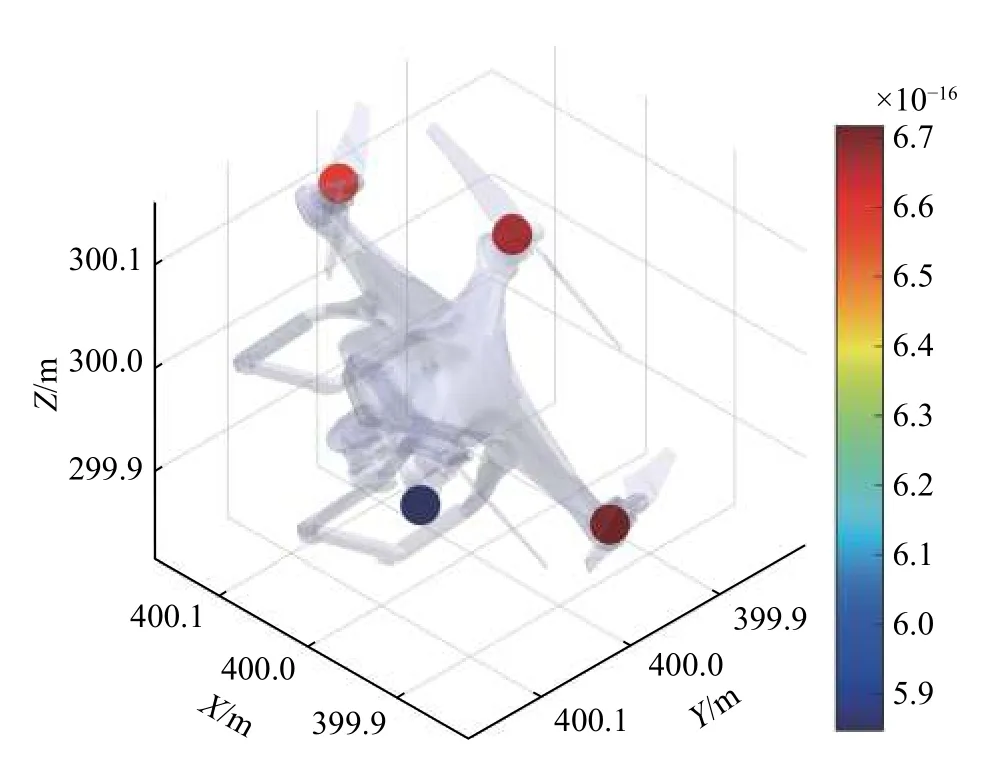
Fig. 13 Simulation results with FEKO generated data
6. Conclusions
This paper mainly deals with a novel approach for 3D imaging of the target only in a single echo, which avoids the complicated motion compensation in InISAR and achieving real-time 3D imaging. In order to get the unambiguous wave path difference estimate, the phase ambiguity is resolved by utilizing the estimate of the frequency of the cross-correlation result. Compared with other existing phase ambiguity resolution methods, the proposed method does not need extra antenna pairs and a priori knowledge. The performance of the estimators is shown through Monte Carlo simulations and the derived theoretical RMSE.
In this paper, the proposed method makes sense for the transient 3D imaging (also called snap-shot) of strong scatterers of the target and is of great help to target recognition. The proposed method also has its application conditions: the bandwidth of the radar system should be high enough, thus the scatterer of the target can be separated.The proposed method may be more suitable for space targets. The method is applicable to the existing wideband radars and only requires signals from four quadrants of wideband phased array radar systems to implement the algorithm. For future research, we aim to improve the MPI on the ability to deal with the multi-scatterer in the same range cells and reject clutter.
 Journal of Systems Engineering and Electronics2021年1期
- Journal of Systems Engineering and Electronics的其它文章
- Unsplit-field higher-order nearly PML for arbitrary media in EM simulation
- A deep learning-based binocular perception system
- STAP method based on atomic norm minimization with array amplitude-phase error calibration
- Higher order implicit CNDG-PML algorithm for left-handed materials
- Fast and accurate covariance matrix reconstruction for adaptive beamforming using Gauss-Legendre quadrature
- Multiple interferences suppression with space-polarization null-decoupling for polarimetric array
