
Centrifuge model tests on pile-reinforced slopes subjected to drawdown
2021-01-12 06:10SujiaLiuFangyueLuoGaZhang
Sujia Liu, Fangyue Luo, Ga Zhang
State Key Laboratory of Hydroscience and Engineering, Tsinghua University, Beijing,100084, China
Keywords:Slope Pile Drawdown Failure Reinforcement Centrifuge model test
A B S T R A C T Piles are generally an effective way to reduce the risk of slope failure.However, previous approaches for slope stability analysis did not consider the effect of the piles coupled with the decrease of the water level (drawdown). In this study, a series of centrifuge model tests was performed to understand the deformation and failure characteristics of slopes reinforced with various pile layouts. In the centrifuge model tests,the pile-reinforced slopes exhibited two typical failure modes under drawdown conditions:across-pile failure and through-pile failure.In the through-pile slope failure,a discontinuous slip surface was observed,implying that the assumption of the slip surface in previous stability analysis methods was unreasonable.The test results showed that drawdown led to instability of the piles in cohesive soil,as the saturated cohesive soil failed to provide sufficient constraint for piles. The slope exhibited progressive failure, from top to bottom, during drawdown. The deformation of the piles was reduced by increasing the embedment depth and row number of piles. In addition, the deformation of soils outside the piles was influenced by the piles and showed a similar distribution shape as the piles, and the similarity degree weakened as the distance from the piles increased. This study also found that the failure mechanism of unreinforced and pile-reinforced slopes induced by drawdown could be described by coupling between the deformation localization and local failure, and it revealed that pile-reinforced slopes could reduce slope deformation localization during drawdown.
1. Introduction
Landslides can be induced or activated by fluctuations of water level under various conditions, such as operation of reservoirs,storm surges, and rainfall (Zhang et al.,2016; He et al.,2018; Song et al., 2018). For example, the Qianjiangping landslide in China caused 24 deaths, which occurred during drawdown in the Three Gorges Reservoir(Jian et al.,2014).To reduce the disasters,piles are generally an effective means to reinforce unstable slopes(Anbarasu et al., 2010; Zhang et al., 2017).
The limit equilibrium method and the limit analysis method are currently widely used to study the effect of piles on slope stability(Ausilio et al.,2001;Rao et al.,2017).For example,Zhang and Wang(2010)proposed an equivalent principle for the three-dimensional pile effect and extended the simplified Bishop method to evaluate strain-softening pile-reinforced slopes. However, these methods did not consider the mutual effects of piles and drawdown.
Field observations are frequently used to observe the responses of piles in reinforced slopes(Kang et al.,2009).For example,Hong et al. (2002) assessed the stability of unreinforced and reinforced cut slopes in soft ground with an instrumentation system, which indicated that the cut slope was stabilized by the piles in soft ground. Ashford et al. (2006) focused on the response of practical pile-reinforced slopes and found that the failure characteristics of the piles were influenced by the soil layer distribution.Nimityongskul et al. (2018) assessed the lateral response of piles near a slope subjected to full-scale lateral load tests.
Numerical simulation is an important approach for studying pile behaviors,which considers the stress-strain relationship of soil to improve the accuracy of the analysis. For example, the pile-soilpile interaction in a group of inclined piles was simulated by the finite element method(Ghasemzadeh et al.,2018).The influence of piles on the improvement of the factor of safety can be directly estimated under a specific spacing ratio through the numerical simulation of pile-reinforced slopes (Ellis et al., 2010). However,numerical analyses are not suitable for simulating the near-failure response of pile-reinforced slopes.
Centrifuge model tests can reconstruct the gravity stress of prototypes from a small-scale model to study the failure characteristics of slopes and the reinforcement effect of various structures (Wang and Zhang, 2014a; Zhang and Wang, 2016; Luo et al., 2018), and to study pile-reinforced slopes in various situations (Indrasenan et al., 2006; Sommers and Viswanadham, 2009;Wang et al., 2014). Several centrifuge model tests were used to analyze the stability of hybrid slopes reinforced by piles and the test results showed that the factor of safety of slopes with low permeability could be increased by piles under impoundment conditions(Banerjee and Lee,2013).The reinforcement effect of piles was also analyzed using centrifuge modeling in different situations (Wang and Zhang, 2014b).
Few centrifuge model tests have been performed on pilereinforced slopes under drawdown conditions. In this study,centrifuge model tests were carried out and the effect of the pile layout was considered. The progressive slope failure mechanism was studied based on full-field displacement measurement and analyses of deformation and failure processes during drawdown.In addition, the deformation and failure characteristics of the reinforced and unreinforced slopes were compared to understand the reinforcement effect and mechanism of piles installed in the slope.
2. Centrifuge model tests
2.1. Test device
The centrifuge model tests were conducted at Tsinghua University,Beijing,China,using a TH-50 g-t centrifuge with a capacity of 50 g-t and a maximum acceleration of 250g. The size of the model container for the test is 500 mm in length,200 mm in width,and 350 mm in height. A 40 mm thick transparent plexiglass was equipped on one outer side of the container for observation and measurement of the shape and displacement process of the model during the test. An in-flight water simulator was set up on the model container for simulation of water storage and drawdown.For the simulator,a water storage tank with a capacity of 24 L was connected to a solenoid valve with a segment of pipe that was fixed on the water inlet of the model vessel to control the water inflow.The other solenoid valve was used to control the water outflow near the bottom of the model container.The pore water pressure sensor was placed at the bottom of the model vessel to monitor the water level in real time.The solenoid valves and the pore water pressure sensor were connected to the digital control module to control the variation of the water level out of the centrifuge (Luo and Zhang,2016).
2.2. Slope model
The slope model is made of a cohesive soil layer in the upper part (28 cm high) and a sand layer in the lower part (8 cm high)(Fig.1). The gradients of the cohesive soil layer and the sand layer are 1:1 and 1:2, respectively. The soil was compacted to the designed dry density in a 7-8 cm thick horizontal layer in the model container. Then the redundant soil was cut down to the designed gradient (Fig. 2). To more accurately calculate the displacement of the points in the slope using the correlation-based image measurement, white particles and glass sheets were randomly placed on the outer side of the cohesive soil layer and sand layer,respectively.The inner side of the model container was evenly coated with the silicone oil to minimize the friction between the slope and container.

Fig.1. Image of a pile-reinforced slope model.
The sand has an average grain diameter of 0.21 mm and a particle specific gravity of 2.68.The maximum dry density of the sand is 1.36 g/cm3and the minimum density is 1.71 g/cm3. The dry density of the sand is 1.6 g/cm3for the tests with an initial water content of 18%. According to the unified soil classification system(USCS),the cohesive soil in the tests can be classified as CL-ML.The dry density of cohesive soil is 1.55 g/cm3with an initial moisture content of 18%.The permeability coefficient,cohesion and internal friction angle of cohesive soil are 10-5cm/s, 27 kPa and 25°,respectively, according to the permeability and triaxial compression tests.
2.3. Piles and reinforcement schemes
The pile was simulated using a hollow steel pipe with a square cross-section having a side length of 14 mm.The wall thickness of the pile is 2 mm. The piles were inserted in a row into the soil vertically with pile spacing of 67 mm.
For the analysis of the failure and deformation behaviors of pile-reinforced slopes considering the effect of the reinforcement layout, the embedment depth and row number of piles were varied in centrifuge model tests, while other factors such as slope model and pile spacing were maintained constant. As shown in Fig.2,in the SS test,a row of piles are inserted at the bottom of the cohesive soil layer;in the SD test,a row of piles are inserted to the bottom of the sand layer; and in the DD test, double rows of piles are inserted at the bottom of the sand layer. In addition, an unreinforced slope is included in the test series, termed the UR test,which is used for comparison in terms of the reinforcement effect and mechanism.
2.4. Test procedure
All the centrifuge model tests are conducted in three steps.First, the acceleration of the centrifuge is raised to 50g with an increase of 10g each time. The acceleration level does not increase until the settlement of the slope becomes stable under the current centrifugal field. The second step is to raise the water level from 0 mm to 60 mm,120 mm,180 mm, and 240 mm after slope settlement stabilizes at 50g. In the third step, when the slope settlement is almost constant at a water level of 240 mm,the water level is then reduced from 240 mm to 0 mm at a speed of 2.5 mm/s.
2.5. Measurement

Fig. 2. Schematic views of slope models for four centrifuge model tests: (a) UR test; (b) SS test; (c) SD test; and (d) DD test.
During each centrifuge model test, images of the slopes were captured at a rate of 20 frames per second with an image tracking and displacement calculation system (Zhang et al., 2009). The displacement at a point of concern at any time could be determined by analyzing the image series with a correlation-based algorithm.In this study, a padding-zero algorithm involving a fast Fourier transform algorithm was employed to determine the locations of the observation points in the first image on the subsequent images by matching the greyscale distribution of a zone around the observation points between the images(Zhang et al.,2006).Taking the slope toe as the origin and the horizontal and vertical directions as positive,a rectangular coordinate system was established(Fig.2).In light of the similarity ratio of centrifuge model tests, the prototype displacement and water level are both 50 times that of the models.
3. Slope failure behaviors
3.1. Failure mode
Fig. 3 shows an image of a pile-reinforced slope in the SS test after slope failure. One can see from this figure that the piles exhibit obvious rotation under drawdown conditions, which is similar to the previous centrifuge model test results where the slope was reinforced by piles with short free heads (Liu et al.,2019). The pile instability is likely caused by the fact that the saturated cohesive soil could not provide sufficient constraint for the piles during drawdown.This is inconsistent with the previous results of pile-reinforced slopes with a similar pile layout (Wang and Zhang, 2014a, b). Meanwhile, an obvious slip surface can be observed on the slope. The slip surface is discontinuous at the position of the piles, which is different from previous test observations under drawdown conditions where the slip surface was continuous (Luo and Zhang, 2016). The difference in the slip surface elevation on the left and right sides of the piles is nearly one tenth of the embedment depth of the pile. The result indicates that the piles induce an obvious discontinuous slip surface as the piles rotate at a certain angle under drawdown conditions. The discontinuous slip surface demonstrates that the assumption of the slip surface in previous stability analysis methods may be unreasonable.
According to the images captured in the tests,the slip surfaces can be drawn in the coordinate system.Fig.4 presents all the slip surfaces of unreinforced and pile-reinforced slopes.Obviously,all the slip surfaces are curved in shape. It shows that the sliding body of the unreinforced slope is larger than that of pilereinforced slope. This result indicates that the sliding body is restricted by the piles.

Fig. 3. Photograph of the slope after failure in SS test.

Fig. 4. Slip surfaces in different tests under drawdown conditions.
For the pile-reinforced slopes, the failure modes could be divided into two categories on the basis of the relevance between the slip surface and pile.The slip surface of the slope reinforced by shallower piles passes through the piles, which is termed the through-pile failure mode.In contrast,the slip surface of the slope reinforced by deeper piles passes by the piles,which is termed the by-pile failure mode.Therefore,the slope failure mode induced by drawdown, indicated by the slip surface, depends on the pile layout.It could be inferred that the by-pile failure mode will occur if the piles are embedded deeper, while the through-pile failure mode will occur if the piles are embedded relatively shallow. It is noteworthy that the discontinuous slip surface only occurs in the through-pile failure mode.
3.2. Failure process

Fig. 5. Development of the slip surfaces for different slopes under drawdown conditions: (a) UR test; (b) SS test; and (c) SD test. The water levels corresponding to local failure are included in the round brackets.
Fig. 7 shows the variation in the piles’ rotation angle (θ) of the slope with single-row shallower piles during drawdown.The pile is considered as a rigid body and it can rotate around the tips from the captured images. The rotation angles of piles increase during drawdown. Similar to the tangential displacement of the point couple, the rotation angle of piles is small at the beginning of drawdown and then grows rapidly. Pile instability occurs at the inflection point. The pile instability moment is marked with black dashed lines in Fig. 7 and demonstrated in Fig. 5b. It can be seen that the pile becomes unstable between the local failure moments of points E and F,which are on different sides of the piles.In other words, the slip surface in the slope reinforced with single-row shallower piles develops downward from the top of the slope as the water level drops.

Fig. 6. Variations in the relative normal (dn) and tangential (ds) displacements of the point couples(locations are shown in Fig.5b)with water level(h)in the SS test during drawdown.
It is noted that the same piles have been used in all the reinforced slopes in this study,and the pile free head is slightly longer in the SS test. However, the free head does not substantially affect the pile instability,because the pile is simulated with a hollow pipe so that the self-weight of the free head is not great and thus has a slight effect on the pile-soil interaction. For example, the pile settlement is fairly small when the centrifugal acceleration increases from 1g to 50g,and the pile exhibits satisfactory stability as the centrifugal acceleration reaches 50g.The self-weight of the free pile head will induce an obvious rotation moment when the pile rotates at a large angle (e.g.10°or more) upon pile instability. In other words,the free pile head may contribute to pile instability to some extent but cannot induce pile failure. Such a conclusion can be confirmed by the fact that the pile becomes unstable after local failure of the upper part of the slope (Fig. 5b), indicating that the pile instability is caused by slope failure.
The water levels at local failure along the slip surface of the slopes are determined using point couple analysis and shown in Fig. 5. It can be seen from the figure that the water level at local failure decreases with decreasing elevation for all slopes.This result demonstrates that the slip surface appears at the top of the slope and gradually develops downward during drawdown. The water level corresponding to local failure of the pile-reinforced slope is lower than that of the unreinforced slope at the same elevation along the slip surface. This indicates that the pile-reinforced slope begins to destabilize later and its safety limit is higher than that of the unreinforced slope.In addition,the slope failure is caused by a larger drawdown if the piles are embedded deeper to the bottom of the sand layer.
3.3. Failure mobilization
The failure mobilization of the slope is determined when the slip surface begins to appear. Fig. 8 shows the reduction in the water level at failure mobilization of unreinforced and reinforced slopes. This result shows that the variation in the water level at failure mobilization of the pile-reinforced slope is approximately 30%greater than that of the unreinforced slope.This indicates that the pile strengthens the slope stability.In addition,the reduction in the water level at failure mobilization increases if the piles are embedded deeper, suggesting that the pile reinforcement effect is enhanced with increasing embedment depth.
4. Deformation of the slope
4.1. Displacement behaviors of the slope
Fig.9 shows the variations in the settlement and water level of a typical point on the shoulder of the unreinforced slope during drawdown. It is shown that the settlement develops as the water level decreases.It can also be seen that an inflection point appears as the settlement increases, which divides the process into two stages. At stage I, the settlement is small and increases slowly. At stage II, the settlement increases rapidly, indicating that obvious slope deformation appears.
Fig.10 compares the variations in the horizontal displacement of point M in the unreinforced and reinforced slopes during drawdown. An inflection point appears as the horizontal displacement increases in each slope, representing the two-stage deformation process. Larger drawdown is required to enter the second stage of deformation in case of piles. The horizontal displacement of the pile-reinforced slope is lower than that of the unreinforced slope at the same water level. The results indicate that piles apparently restrict the slope deformation.In addition,the displacement of the slope reinforced by single-row deep piles decreases more than that of the slope reinforced by single-row shallow piles, but is higher than that of the slope reinforced with double-row deep piles.It can be concluded that the pile reinforcement effect on the slope deformation is enhanced by increasing the embedment depth and row number of piles.
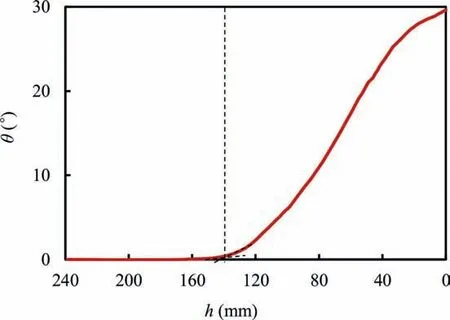
Fig. 7. Variation in the rotation angle (θ) of piles during drawdown.
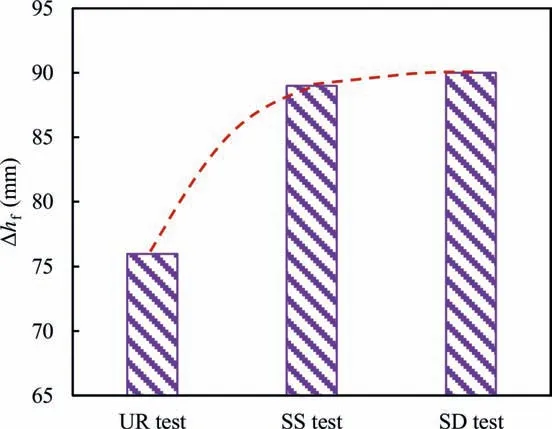
Fig. 8. Decrease of water level at failure mobilization (Δhf) of the slopes reinforced with different pile layouts under drawdown conditions.
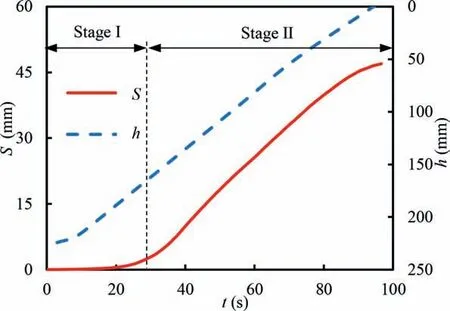
Fig.9. Variations in the water level(h)and settlement(S)of point M in the slope with time (t) during drawdown in UR test (location of point M is marked in Fig. 2a).
Fig.11 shows the slope displacement vectors. One can see that the displacement is distributed nonuniformly and decreases from the exterior to the interior of the slopes in the four tests.It is worth noting that the displacement directions of the pile-reinforced slopes are more vertical than those of the unreinforced slopes.The sliding body could be obviously distinguished according to the displacement vectors. The reinforcement effect of the pile on the slope deformation is enhanced by increasing embedment depth and row number of piles, which is confirmed by the displacement distributions in different slopes.
The white skeletons of human beings who had perished at sea, and had sunk down into the deep waters, skeletons of land animals, oars80, rudders, and chests of ships were lying tightly grasped by their clinging arms; even a little mermaid, whom they had caught and strangled; and this seemed the most shocking of all to the little princess
4.2. Pile-soil interaction
Fig.12 shows the horizontal displacement distributions of the piles and surrounding soils along the height of a reinforced slope.It shows that the horizontal displacements of the slope and piles increase with the slope height. The vertical displacement of the soils outside the piles increases linearly with the slope height,which is similar to that of the piles. The displacement of the soils inside the pile is nearly zero at the bottom of the slope and increases sharply at an inflection point.This result displays that there is a substantial difference in the horizontal displacement distributions of the soils on different sides of the piles.
Fig.13 presents the shape comparison of the soils outside the piles. It can be seen from this figure that the shape similarity is weakened as the distance from the piles increases. There is an obvious nonuniform distribution of horizontal displacement at the spot far from the piles (x = -206 mm), which is substantially different from that of the piles. In Fig.13, the positions of the slip surfaces at the horizontal location are marked with black dashed lines. The displacement increases substantially at the position of the slip surface at each horizontal location.As the distance from the piles increases, the gradients of the vertical displacements at the positions of slip surfaces increase so that the effect of piles on the slope deformation decreases and the shear failure becomes more obvious.
Fig.14 shows the vertical distribution of the horizontal strain of the soils close to the piles on different sides of the piles in the SS test. The distribution of the horizontal strains is nonlinear and the maximum strain appears near the pile midpoint. The horizontal strain could reflect the extent of the pile-soil interaction. It could be deduced that the pile-soil interaction is relatively strong at the middle part of the piles.
4.3. Deformation zone
Fig. 15 shows the horizontal distributions of the horizontal displacements in the slopes. One can see that the horizontal displacement decreases from the surface to the inside of the slope.There is almost no deformation in location far away from the slope surface. This suggests that the slope deformation caused by the drawdown is within a limited zone. The boundary of the deformation zone could be determined by the inflection point in the displacement distribution curve, where the horizontal displacement increases from zero. This boundary is termed the A-surface herein and outlined with blue dashed lines in Fig.15.
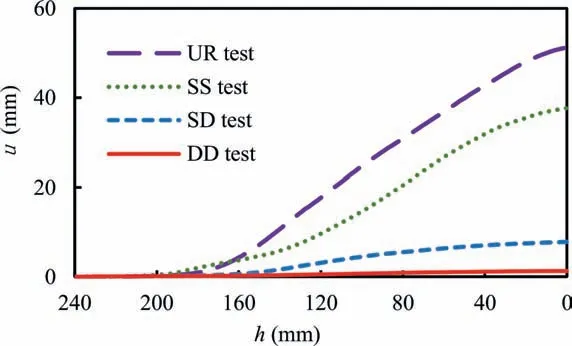
Fig. 10. Variations in the horizontal displacement (u) of point M in different tests during drawdown.

Fig.11. Displacement vectors of different slopes at a water level of 105 mm: (a) UR test; (b) SS test; (c) SD test; and (d) DD test.
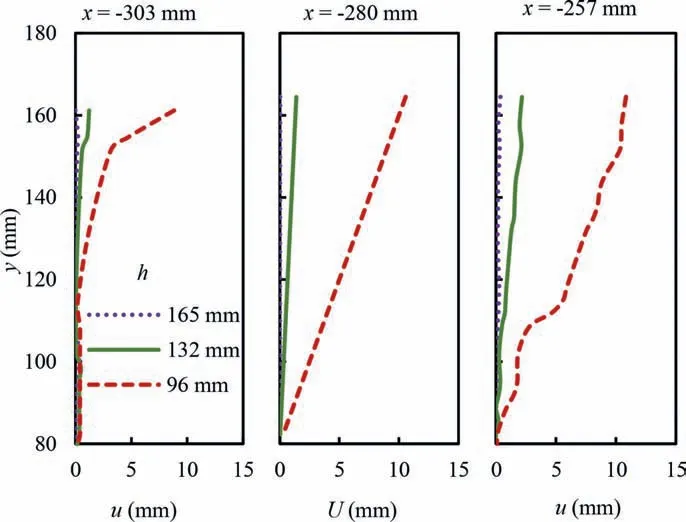
Fig.12. Horizontal displacement distributions of the piles and surrounding soils along the height of a reinforced slope before and after slope failure in the SS test. u and U represent the horizontal displacements of the slope and piles, respectively.
Fig. 16 summarizes both the slip surfaces and A-surfaces for unreinforced and pile-reinforced slopes. It shows that the slip surfaces are all situated in the deformation zone.The shape of the A-surface in the unreinforced slope resembles that of the slip surface.The A-surface of the slope reinforced by single-row shallower piles runs from the top of slope to the tips of the piles.This indicates that the rotation of the piles leads to the expansion of the deformation zone in the region near the piles. The deformation zone shrinks when the embedment depth and row number of the piles increase.
5. Failure mechanism
The diversity factor of displacement (DFD) is used to measure the deformation of a soil element in the slope (Zhang and Wang,2016). Compared with the traditional strain measurement method, the image-based method can calculate more measuring points.Thus,DFD is suitable for quantifying the deformation of the slope in these tests.In this study,four measuring points are evenly distributed in the calculation area:
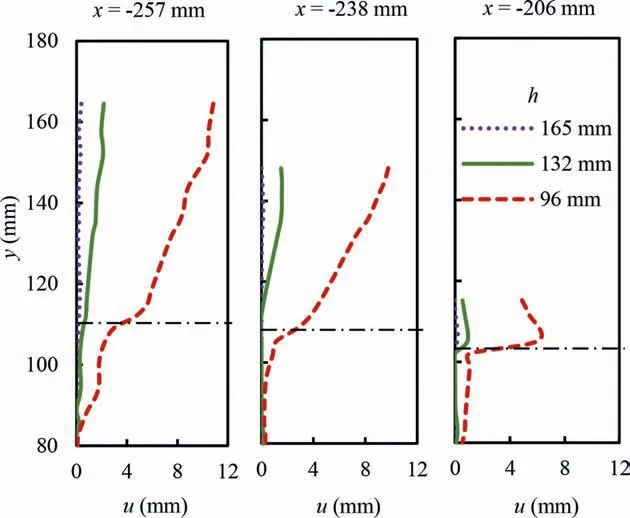
Fig.13. Horizontal displacement distributions of the soils outside the piles along the height of a reinforced slope in the SS test.
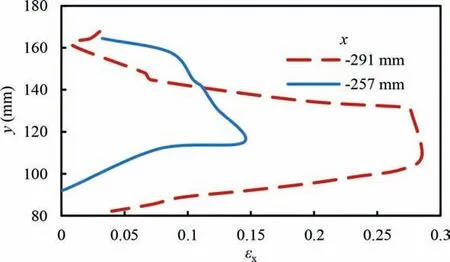
Fig.14. Vertical distribution of the horizontal strains of the slope at a water level of 96 mm in the SS test.
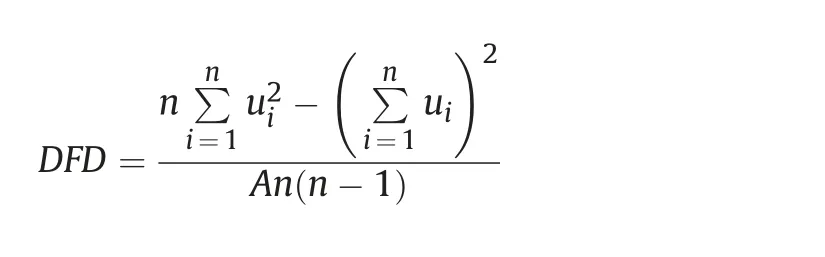
where n is the number of measuring points in the calculation area,and A is the area of the element.The element for analysis is a square with side length of 6.6 mm.
Fig. 17 shows the horizontal distributions of DFD values for unreinforced slopes before and after slope failure. It can be observed from this figure that the DFD is quite small in the beginning and then increases nonuniformly during drawdown.There is a small area where the DFD grows rapidly and approaches a large value. This result shows that the deformation localization is restricted within a zone,the length of which is approximately 1/15 of the slope height.The extent of deformation localization expands during drawdown. It is noteworthy that the slip surface, outlined using a black dashed line in Fig.17,occurs in the localization zone.Finally, deformation localization accumulates and induces local failure. In addition, there is a significant DFD peak near the slip surface after local failure. This demonstrates that local failure causes new deformation localization nearby. Therefore, the failure mechanism of the slope could be described using coupling processes between deformation localization and local failure under drawdown conditions.
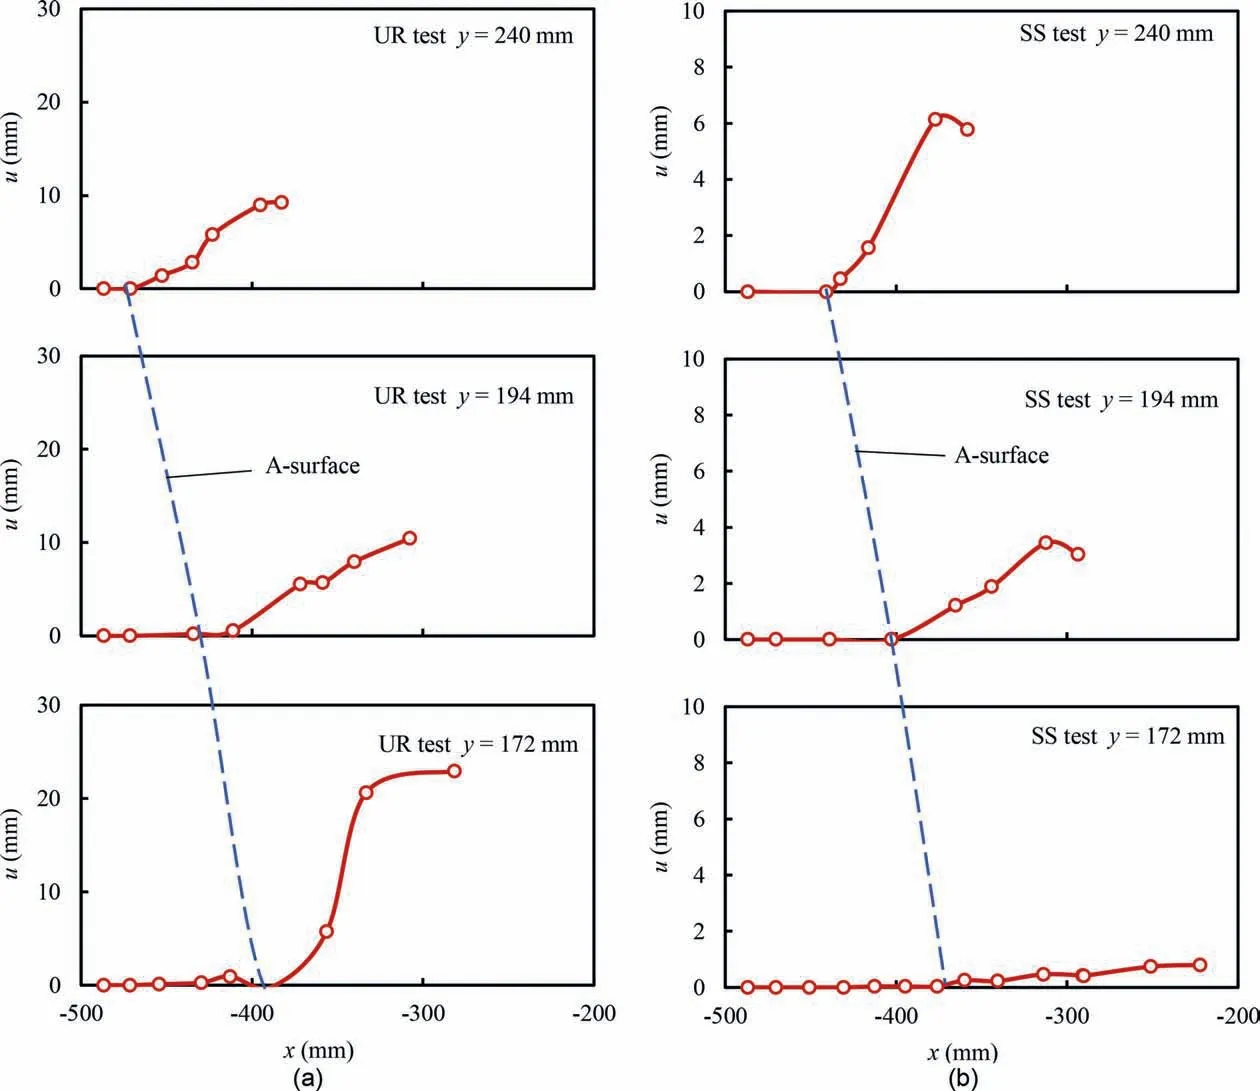
Fig.15. Horizontal distributions of the horizontal displacements (u) in the slopes just after local failure in the (a) UR and (b) SS tests.
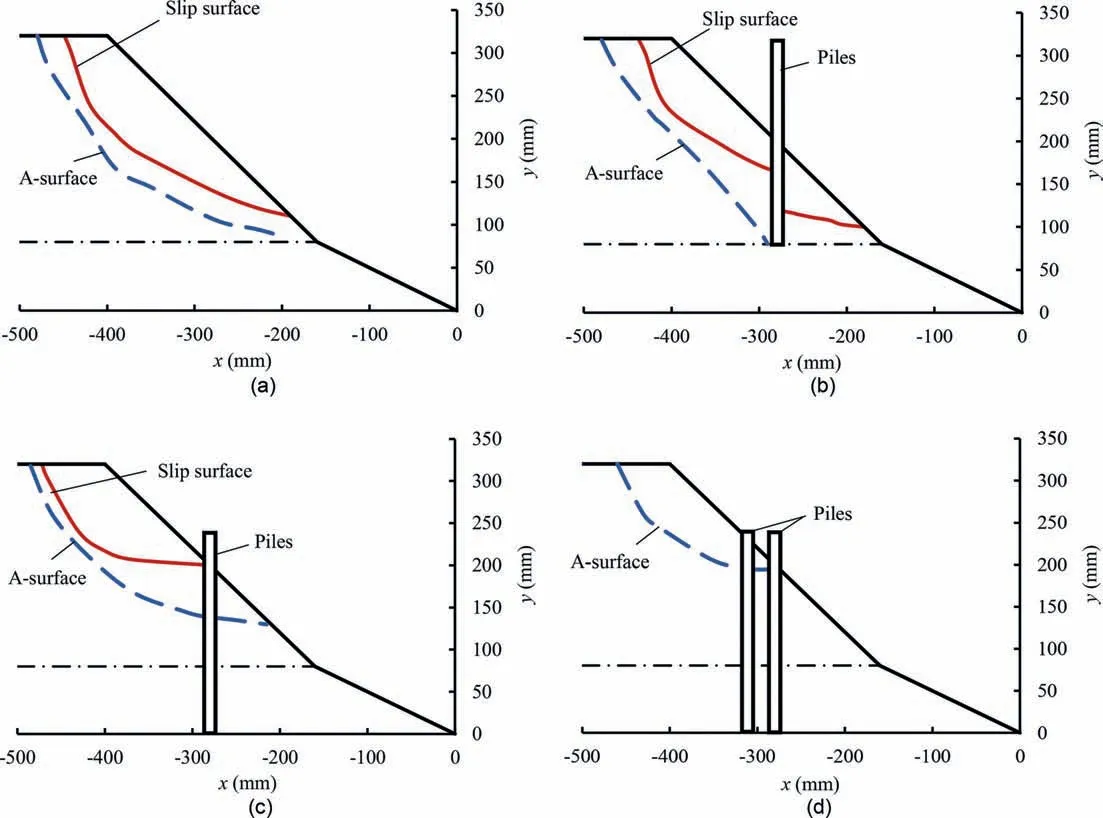
Fig.16. A-surfaces and slip surfaces for different slopes under drawdown conditions: (a) UR test; (b) SS test; (c) SD test; and (d) DD test.
Fig.18 shows the horizontal distributions of the DFD values for the slope reinforced by single-row shallow piles before and after slope failure.One can see that the DFD increases under drawdown conditions and approaches its peak in a certain area, which resembles the unreinforced slope (Fig.17). The phenomenon that the pile layout influences the location of the slip surface could be explained by the proposed failure mechanism.Fig.19 compares the distributions of the DFD values for the unreinforced and reinforced slopes. For easy comparison of different slopes, the DFD values of the points in different slopes are normalized with the peak of the DFD values on their respective elevations. It can be observed that the positions of the deformation localization of the three slopes are obviously different. In other words, the pile layout changes the deformation localization area. Such a change has a substantial influence on the location of the slip surface according to the failure mechanism;thus,the slip surface changes accordingly(see Fig.4).

Fig. 17. Horizontal distributions of DFD values for the slope in the UR test during drawdown before slope failure: (a) y = 303 mm (water level at failure: 164 mm); and (b)y = 184 mm (water level at failure: 153 mm).

Fig.18. Horizontal distributions of the DFD values for the slope during drawdown in the SS test(a)before and(b)after slope failure(y=303 mm;water level at failure:151 mm).
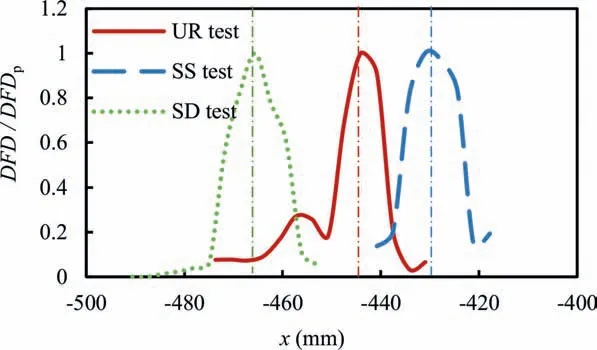
Fig. 19. Horizontal distributions of the normalized DFD values for the slopes(y = 303 mm). DFDp denotes the peak DFD at the corresponding elevation.
6. Pile reinforcement mechanism

Fig. 20. Variations in the normalized DFD values for different slopes (y = 303 mm).DFD0 represents the peak DFD at local failure.

Fig. 21. Horizontal distributions of the DFD values for reinforced and unreinforced slopes at a water level of 160 mm (y = 184 mm).
Fig. 20 shows the variations in normalized DFD values for the unreinforced and pile-reinforced slopes. The DFD value of each point is normalized with the maximum DFD at local failure on its elevation. Thus, the moment that the normalized DFD reaches 1 represents the occurrence of local failure. It shows that the normalized DFD of the pile-reinforced slope increases slower and reaches 1 later than that of the unreinforced slope. The piles can delay the deformation localization and increase the slope stability.It can also be found that the pile layout influences the progress of the deformation localization of the slope.
Fig. 21 compares the distributions of the DFD values for the unreinforced and double-row pile-reinforced slopes before slope failure. It shows that the deformation of the unreinforced slope is greater than that of the pile-reinforced slope. Specifically, the DFD values of the pile-reinforced slope show a more uniform distribution than those of the unreinforced slope.The piles homogenize the deformation distribution of the slopes and thus reduce the deformation localization, which can minimize slope failure. This is the pile reinforcement mechanism for the slope under drawdown conditions.
7. Conclusions
Through centrifuge model tests, the deformation and failure behaviors of pile-reinforced slopes considering various pile layouts are investigated. The failure and reinforcement mechanisms are studied through analysis of the deformation and failure of pilereinforced slopes. The following conclusions are drawn:
(1) The pile-reinforced slopes exhibit two typical failure modes under drawdown conditions: across-pile failure and through-pile failure. The through-pile failure mode is more likely to occur when the strength of embedding layer is weak. The drawdown results in the instability of piles in cohesive soil, as the saturated cohesive soil fails to provide sufficient constraint for piles.
(2) The slip surface of the pile-reinforced slope might be discontinuous in the through-pile failure mode. The pilereinforced slopes show progressive failure from top to bottom during drawdown, regardless of the continuity of the slip surface.
(3) The piles effectively reduce the deformation of slopes under drawdown conditions, and this reinforcement effect is enhanced by increasing embedment depth and row number of piles. The soils outside the piles exhibit similar shape as the piles, and such shape similarity is weakened as the distance from the piles increases.
(4) The deformation of the slope due to drawdown occurs within a limited zone.The area of the deformation zone decreases as the embedment depth and row number of piles increase.
(5) The drawdown-induced failure mechanisms of the unreinforced and reinforced slopes are consistent and can be described as coupling processes between the deformation localization and local failure. The drawdown leads to deformation localization that induces local failure, and such local failure further causes greater deformation localization near it.The failure mechanism could clarify the phenomenon that the location of the slip surface depends on the pile layout.
(6) Piles reinforce the slope by reducing and delaying its deformation localization during drawdown.
Declaration of competing interest
The authors declare that they have no known competing financial interests or personal relationships that could have appeared to influence the work reported in this paper.
Acknowledgments
The study is supported by the National Key R&D Program of China (Grant No. 2018YFC1508503) and the Open Research Fund Program of State Key Laboratory of Hydroscience and Engineering,Tsinghua University (Grant No. sklhse-2020-D-03), which are greatly acknowledged.
 Journal of Rock Mechanics and Geotechnical Engineering2020年6期
- Journal of Rock Mechanics and Geotechnical Engineering的其它文章
- Ultrasonic imaging of microscale processes in quartz gouge during compression and shearing
- Influence of degree of interlock on confined strength of jointed hard rock masses
- Crack dynamic propagation properties and arrest mechanism under impact loading
- Micro-annulus generation under downhole conditions: Insights from three-dimensional staged finite element analysis of cement hardening and wellbore operations
- Excavation of underground research laboratory ramp in granite using tunnel boring machine: Feasibility study
- Strength and dilatancy behaviors of deep sands in Shanghai with a focus on grain size and shape effect