
Estimation of age and growth and mortality parameters of the sea cucumber Isostichopus fuscus(Ludwig,1875)and implications for the management of its fishery in the Galapagos Marine Reserve
2020-10-21 06:02JorgeRmrezGonzlezNicolsMoitySolngeAndrdeVerHrryReyesMckliff
Aquaculture and Fisheries 2020年5期
Jorge Rmírez-González,Nicols Moity,Solnge Andrde-Ver,Hrry Reyes Mckliff
aCharles Darwin Research Station,Charles Darwin Foundation.Av.Charles Darwin,Puerto Ayora,Galapagos,Ecuador
bGalapagos National Park Directorate,Marine Resources Department.Av.Charles Darwin,Puerto Ayora,Galapagos,Ecuador
ARTICLEINFO
Keywords:
Sea cucumber
Small-scale fishery
Galapagos Marine Reserve
Age&growth
Mortality
Maximum sustainable yield
Total allowed catch
ABSTRACT
The fishery of the sea cucumber Isostichopus fuscus was the most important one in the early 2000s in the Galapagos Marine Reserve.Its overexploitation leads to its total closure from 2016 to 2021.At the end of this period,if the co-management system of the Galapagos Marine Reserve decides to open this fishery,a total allowed catch must be established using the methodology of Wolff,Schuhbauer,and Castrejón(2012).The objective of this paper is to evaluate this methodology and improve the total allowed catch calculation.We replicated Wolff et al.‘s methodology that uses the Cadima equation of Maximum Sustainable Yield(in Troadec,1977).We determined the age and growth parameters of I.fuscus to estimate total mortality and improved the calculation of the area of fishing and habitat of this species in Galapagos to estimate its abundance.We found inconsistences in Wolff et al.‘s estimations of mortality and abundance and we recommend that the Maximum Sustainable Yield be used not as the total allowed catch,but as a limit reference point for this fishery.We propose,instead,to use a dynamic abundance model that is capable of estimating a variety of reference points,including the fishing mortality for optimal fishing that is recommended to use to establish a total allowed catch.In addition,for the first time,the age and growth parameters of I.fuscus for Galapagos and the eastern-central region of the Pacific Ocean are determined(L∞=42.5 cm;K=0.21/year).
1.Introduction
Sea cucumbers are considered a food delicacy and have an important cultural significance in traditional medicine in Asian countries,particularly in China.This is the reason for the high demand of this seafood and its high value in Asian markets(Fabinyi,2012;Purcell,Lovatelli,Vasconcellos,&Ye,2010;Purcell,Williamson,&Ngaluafe,2018;To&Shea,2012).This has caused an increase on the number of sea cucumbers species and fishing grounds exploited in the world,and,in some cases,an overexploitation of the most valued species jeopardizing its conservation status(IUCN,2019;Mercier et al.,2013;Purcell,Samyn,&Conand,2012).Isostichopus fuscus is the main commercially exploited sea cucumber in the Eastern Tropical Pacific,and,as a result of its unsustainable exploitation,it is listed as endangered in the IUCN and it is included in CITES Appendix III.The species is commercially exploited in four countries in the region,Mexico,Panama,Peru and Ecuador(Toral-Granda,2008).Exploitation of I.fuscus in Ecuador started in 1988 to supply Asian markets but soon decayed due to a collapse of the population as a result of over fishing.Since 1992,there is a fishing ban in mainland Ecuador by Ministerial Decree that prompted a migration of the activity to the Galapagos Islands(Carranza&Andrade,1996).
At the beginning of the 2000s,I.fuscus fishery was the most important in the Galapagos Marine Reserve(GMR).The highest capture was registered in 2002 with more than 8 million individuals extracted,yielding a gross income of more than US$4 million.From 2002,the catch of sea cucumbers decreased to reach its historical registered minimum of 540,000 individuals fished in 2015(Dirección del Parque Nacional Galápagos,2015a).
In 2016,a total closure for five years was established for the sea cucumber fishery in the GMR.This was an agreement between the Galapagos National Park Directorate(GNPD)and the fishing sector of Galapagos.The agreement included the following management measures:1)the fishery will be re-opened if independent monitoring prior to the re-opening establishes a density equal or greater than 11 sea cucumbers/100 m2on the west of Isabela Island;2)the minimum catch size should be 20 cm of total length(TL)in fresh animals or 7 cm TL in brine-preserved animals;3)the fishing season should be opened on 1 June and closed immediately after the total allowable catch(TAC)is reached and;4)a TAC must be established using the Wolffet al.(2012)methodology,but there should be a minimum TAC of 600,000 sea cucumbers(Dirección del Parque Nacional Galápagos,Comisión Técnica Pesquera,&Sector Pesquero Artesanal de Galápagos,2016).
The first time that a TAC was established in the GMR for the sea cucumber fishery was in 1994.In this year,the fishery was experimentally opened with a TAC of 550,000 individuals.There is no documentation on the methodology used to calculate the TAC in 1994,but it has been questioned,as it was not based on population parameters of I.fuscus,nor on the reality of the fishing capacity at that time(De Miras,Andrade,&Carranza,1996).As a result of the lack of control capacities by the authorities,more than 4 million sea cucumbers were extracted in only four months,from October 1994 to January 1995,resulting in the closing of the fishery for three years(Castrejon,2011;De Miras et al.1996).
In 1999,the sea cucumber fishery was re-opened in the GMR with no TAC.From 2000,a TAC was established each year that the fishery was opened,except in 2002.Until 2008,the annual TAC was based on the total catches of previous sea cucumber fishing seasons,for example,it was common to propose a TAC averaging catches of the lasts years(Autoridad Interinstitucional de Manejo,2001;2003;2008).
In 2009,the Fishing Management Plan of the GMR(known as the Fishing Chapter of the Management Plan)established that the TAC for the sea cucumber fishery should be estimated based on the abundance of this resource.It also identified the development of a methodology to estimate this TAC as a research priority(Comisión Técnica Pesquera,2009).
To address this priority,Wolffet al.(2012),for the first time in the history of the sea cucumber fishery in the GMR,proposed a methodology for the calculation of the TAC.Their proposal included as a first step,the estimation of the exploitable abundance of I.fuscus with the following equation:

Where Btis the exploitable abundance of sea cucumbers in the year t,dtis the average density in the year t and A is the total fishing and habitat area of I.fuscus in the GMR,determined by these authors to be 124.8 km2.
With Bt,they proposed to calculate the TAC using the following equation of Maximum Sustainable Yield(MSY)of Cadima(Troadec,1977):

Where Z is the instantaneous total mortality rate of I.fuscus,determined by Wolffet al.(2012)as 0.243/year.
This methodology was the basis for establishing the TAC for the sea cucumber fishery in 2011.The calculation of the TAC considered the abundance of the individuals greater than 20 cm TL,and not of all the sizes as Wolffet al.(2012)suggested.The MSY resulted in 844,242 individuals(Comisión Técnica Pesquera,2009).The GMR co-management system rounded this value and established a TAC of 1 million sea cucumbers for 2011(Dirección del Parque Nacional Galápagos,2011).
This was the only time that the TAC was actually calculated according to a scientific methodology in the GMR.In 2015,the fishery was opened despite the density being below the established 11 sea cucumbers/100 m2reference point(Dirección del Parque Nacional Galápagos,2015b).Given the low abundance of I.fuscus,the TAC calculated as per Wolffet al.(2012)methodology was of 219,205 sea cucumbers,a historically very low number(Jorge Ramírez-González personal observation)and the co-management system decided to establish an arbitrary TAC of 500,000 sea cucumbers(Dirección del Parque Nacional Galápagos,2015c).
In this paper,we revisit Wolffet al.(2012)methodology and suggest some improvements.To calculate Z of equation(2)they did not use the age and growth parameters for I.fuscus in Galapagos.In addition,to calculate parameter B of the same equation,there is an updated bathymetry for the GMR,a new geospatial vector for the GMR zoning 2000 and data on benthic cover of the shallow areas of the GMR that were not used in Wolffet al.(2012).Thus,our objective is to update the methodology and improve the calculation of the TAC for the sea cucumber fishery in the GMR.
This study is the first step towards improving the management of the sea cucumber fishery in the GMR.The second step will be to use robust methodologies to update and propose new reference points,and the third one will be a spatially explicit analysis to consider the entire population of I.fuscus in the GMR within its fishery management.The overall objective of this paper is to provide scientific input to the comanagement system and to the fishing manager of the GMR,the GNPD,before 2021,when negotiations to open or keep the sea cucumber fishery closed will be back on the table and decisions on the management of this fishery will be taken.
2.Materials and methods
2.1.Study area
The GMR is located 1240 km to the west of Guayaquil city,Ecuador,and has its geographical center at 96°46′W and 0°05′S.The reserve covers the entire marine area within 40 nautical miles measured from the baselines of the Galapagos Archipelago and its inland waters.It comprises a total area of~138,000 km2(Fig.1)(Dirección del Parque Nacional Galápagos,2014).
The GMR is a marine protected area of multiple permitted uses,including small-scale fishing,tourism,research and conservation.These uses were spatially restricted to areas de fined by a coastal zoning from 2000 to 2015(zoning 2000),where the no take zones covered 1% of the GMR total area and 77% of its coast(Moity,2018a).In 2016,new zoning was established to also include open waters of the GMR,where the no take zones cover 32% of the GMR's total area(Ministerio del Ambiente,2016).
2.2.Age&growth and mortality
2.2.1.Data sources
The data sources were the annual densities and lengths of I.fuscus from the Research and Fishing Participatory Monitoring Program of the Charles Darwin Foundation,GNPD and fishing sector of Galapagos(1999–2007)and from the Population Monitoring of Sea Cucumber of GNPD and fishing sector of Galapagos(2008–2018).Both monitoring programs were carried out in the fishing and habitat area of I.fuscus(Fig.1)using circular plots of 100 m2(radius of 5.64 m).In total,9,472 plots were settled between<1 and 42 m depth(11.1 m mean;6.6 SD).50,513 sea cucumbers were counted inside the plots and their TL in cm recorded.
2.2.2.Age&growth and mortality analysis
The age and growth parameters were estimated assuming that I.fuscus follows the von Bertalanffy model:

Where Ltis the TL in cm.,L∞is the asymptotic length in cm.,K is the individual growth rate in year-1,t is the age of the individual in years and t0is the hypothetical age when size is zero.For this study we assumed t0=0.
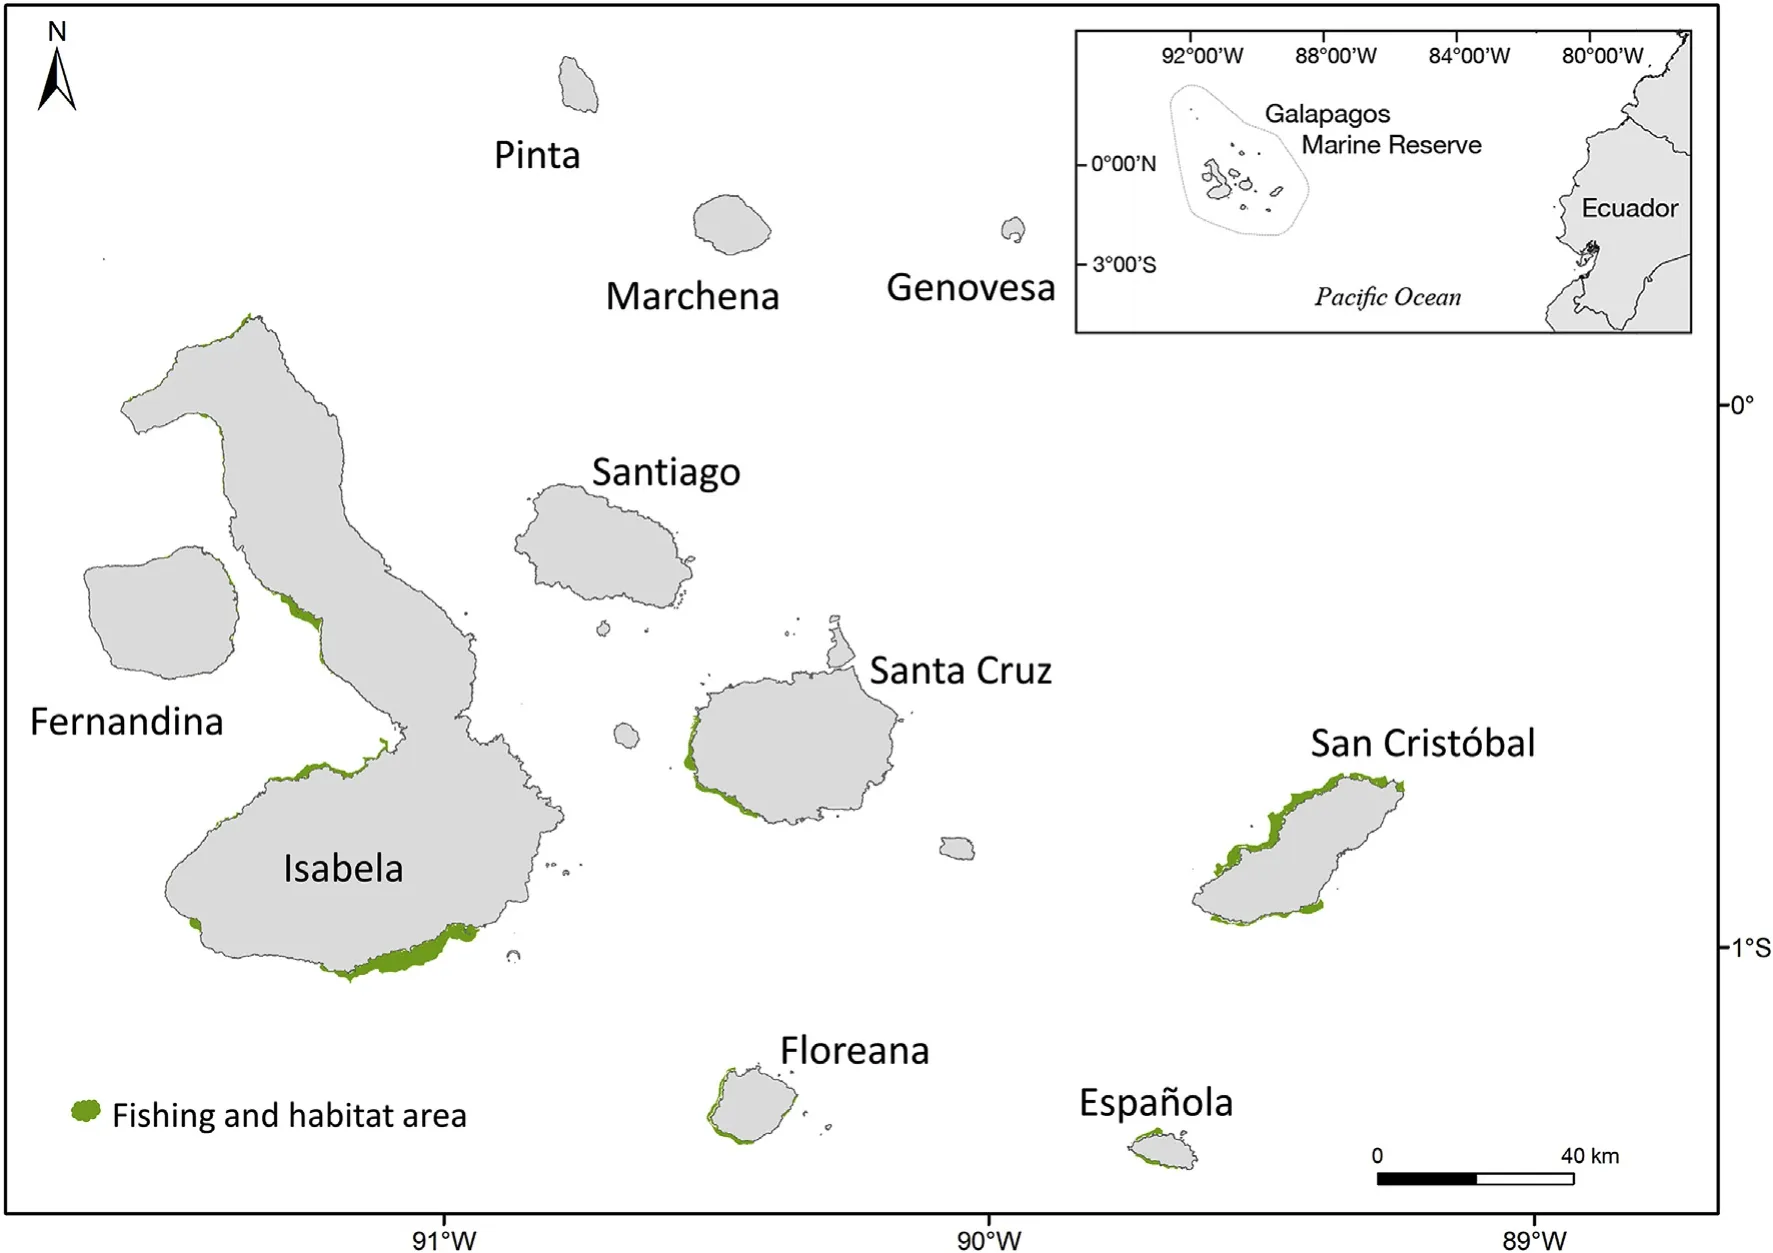
Fig.1.Study area and fishing and habitat area of I.fuscus in the Galapagos Marine Reserve.
L∞and K were estimated with the Electronic Length Frequency Analysis with Surface Response Analysis routine(ELEFAN-RSA)(Pauly,1987).This routine uses ranges of values of L∞and K as inputs.The range for L∞ was±10 cm of the value calculated with Powell-Wetherall method(Powell,1979;Wetherall,Polovina,&Ralston,1987).The range of K was established from 0.01/year to 1/year as it was calculated in this range for I.fuscus by Glockner-Fagetti,Calderon-Aguilera,and Herrero-Pérezrul(2016).For all routines,a time series of all years(1999–2018)of length-frequency data was pooled and used in the R software(R Core Team 2018 version 3.5.3)using the TropFishR package version 1.6.2(Mildengerger et al.,2019).
To use the MSY equation(2),Z was estimated with the Chapman-Robson method(Chapman&Robson,1960;Robson&Chapman,1961),with 95% confidence intervals and using the R FSA package version 0.8.22(Ogle,Wheeler,&Dinno,2018).For this,the lengths of the sea cucumbers were transformed to relative ages with equation(3).Agefrequency data for each year after a sea cucumber fishery was opened(1999–2006,2008,2009,2012 and 2016)were pooled,ensuring that the data came from a population under exploitation,and therefore subject to fishing and natural mortality.
The annual exploitable abundances(B)of I.fuscus were estimated in number of individuals with equation(1).Because equation(2)uses B as exploitable abundance,the result was multiplied by the proportion of sea cucumbers greater or equal to the minimum catch size authorized(20 cm TL).Because,in any case,the annual densities had a normal distribution(Shapiro-Wilk;p<0.001),the average of each annual density and standard error with 95% confidence was obtained with bootstrap resampling(1,000x)using R BootES package version 1.2(Gerlanc&Kirby,2015).
The TAC calculation of Wolffet al.(2012)with equation(2)was replicated.For this,the values of B2009and Z estimated in this paper were used.Because equation(2)uses B as exploitable abundance,only the proportion of sea cucumbers greater than or equal to 20 cm LT in 2009(85%)was used.
2.3.Spatially explicit habitat and fishing area model
The total habitat and fishing area of I.fuscus(parameter A in equation(1),needed to calculate B)was estimated by means of a spatially explicit model.I.fuscus is mostly found on rocky bottoms(Toral-Granda&Martínez,2007)from subtidal depths to 39 m depth(Maluf,1988).However,for diving safety reasons,the maximum fishing depth reached by almost all fishers in Galapagos is 30 m.Therefore,our model goes from 0 to 30 m.To model I.fuscus habitat area,habitat type and depth must be taken into account.For the bathymetry,we used the GEBCO model(GEBCO Compilation Group,2019)which is available on a 15 arc-second grid.
2.3.1.Data sources
The estimation of benthic cover was done on the basis of four sources.The first source is the sea-cucumber monitoring program spatial data(n=701).We assumed the monitoring points to be representative of rocky bottoms since monitoring is performed exclusively on rocky bottoms to maximize the chance of finding I.fuscus.We used a conservative radius of 11.28 m,twice the monitoring radius used in the 100 m2plots.
The second source isa spatially and biogeographically representative sampling of the seabed composition(sand or rock,as percentage)that was carried out at 334 locations scattered throughout the GMR.The sampling was based on video analysis of GoPro HERO4 Black edition footage deployed at ca.25 m depth and covering a radius of~10 m at 360°in each sampling point(see a thorough description in Acuña-Marrero et al.,2018).The radius size was calculated as the median of the visibility value recorded in the visual census data of the Subtidal Ecological Monitoring of the Galapagos Marine Reserve database 1994–2014(n=3,980)(Banks et al.2016).We consider all areas with≥50% rock classification as rocky bottom and the rest as sandy bottom.
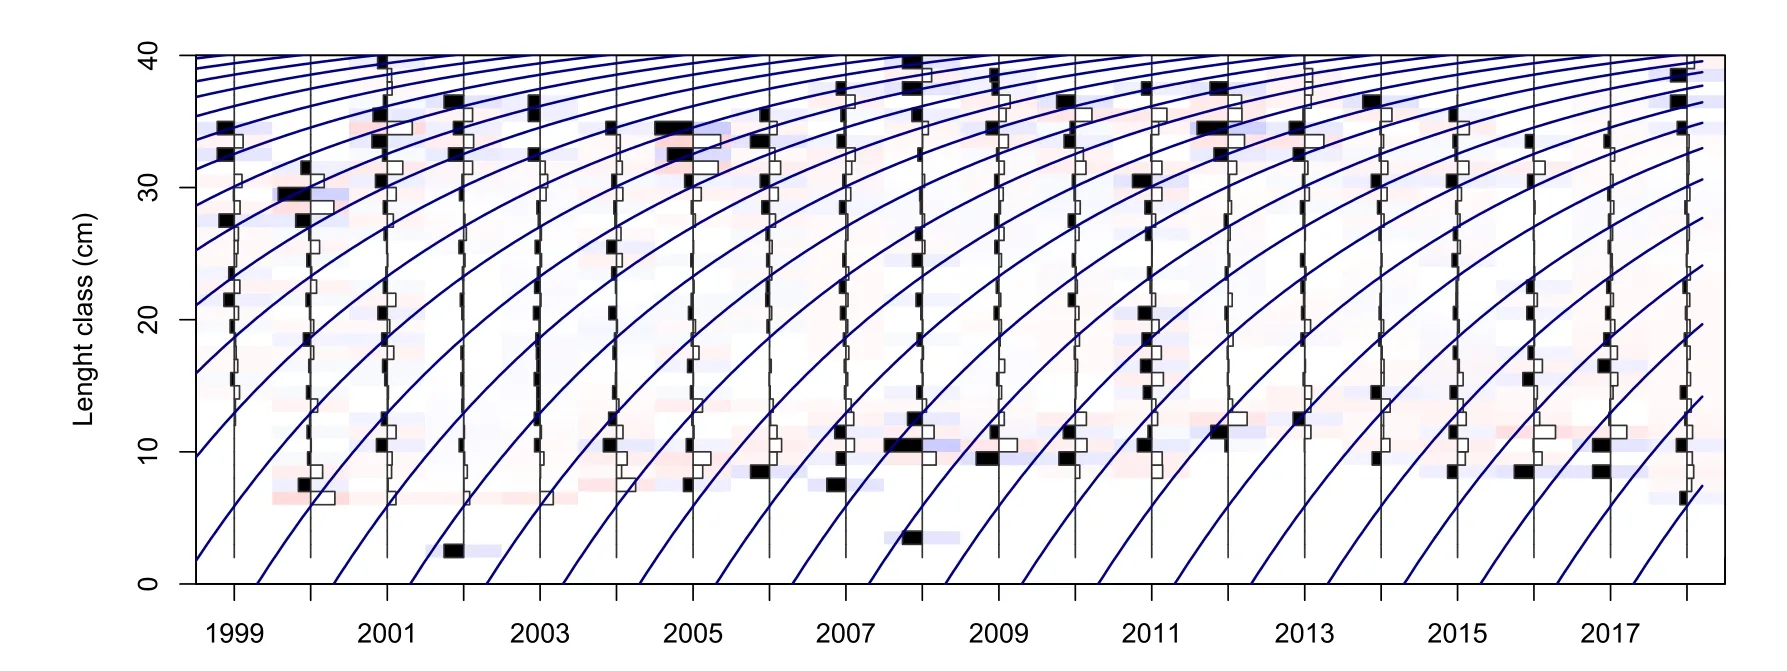
Fig.2.Von Bertalanffy growth curve model fitted to length-frequency data of I.fuscus from 1999 to 2018 in the Galapagos Marine Reserve by using Electronic Length Frequency Analysis with Surface Response Analysis method(ELEFAN-RSA).Black bars indicate running average frequencies(Pauly,1987).
The third source for I.fuscus habitat determination is a remote sensing unsupervised classification of Landsat imagery(with a cell resolution of 30 m)of the visible shallow subtidal areas of the archipelago complemented with aerial photographs (1:60.000) from the Geographical Military Institute(IGM)of Ecuador.This was part of the‘Inventory of the Wetlands of Ecuador’project(Briones et al.,1997)and it classifies benthic substrate to~15 m depth.The classification is based in categories according to the proportion of sand and rock.We consider all areas with more rock proportion than sand,as rocky bottoms(i.e.the benthic cover classes rocky-sandy bottom,rocky bottom with surfacing rocks and rocky bottom)and the areas with more sand proportion than rock,as sandy bottoms(i.e.the benthic cover classes sandy bottom,sandy-rocky bottom,sandy bottom and coral communities and sandy-rocky bottom with coral communities).
The fourth source is spatial information from the beaches of the GMR(Moity,unpublished data)for which we calculated the area of influence in the subtidal area as the area in which we can expect to find sandy sediment away from the shore surrounding a beach.This was done according to the exposure of each beach to wave energy,since wave energy is a key parameter in sandy shores littoral dynamics(McLachlan&Defeo,2017).To estimate wave exposure,we used the fetch,a measure of the distance the wind can blow without encountering any barrier.The fetch is a good proxy for exposure in shallow areas(Hill et al.,2010).We divided the coastline in sectors separated 5 km from each other,and for each sector,the fetch was calculated using the R package fetchR(Seers,2018).For each section we used the mean fetch value from nine equiangular fetch vectors per quadrant(i.e.one fetch vector per 10°),with a maximum distance of 300 km.Each beach was assigned to a coastline sector using Thiessen polygons centered at beach polygon's center points,and given a fetch value.According to the distribution of the fetch data,we classified fetch values per quantile in three categories,namely,high,medium and low fetch.Then we randomly sampled n=30 beaches per category and exported the beaches as kml format to be visualized in Google Earth(GE Pro software v.7.February 3,5776)where we measured the distance from the high tide mark to the farthest visible sand patch underwater.The mean distance value per category was calculated.As we found no significant differences in distances between the three beach categories(t-test,p=0.098),we used the median of the data(459.2 m)to create a buffer around each beach polygon that delimits the sand cover influence area.
2.3.2.Procedures for habitat and fishing area determination
Our spatial explicit model first uses the bathymetry limits to de fine I.fuscus habitat and fishing area,limiting the area to-30 m.We then add two sources of benthic cover data according to their higher accuracy since they were measured in the field,the sea-cucumber monitoring program data and the video data.We then fill the remaining areas with the remote sensing habitat classification data and the spatial information from the beaches of the GMR.Since most of the shallow areas of the GMR are classified as rocky bottoms(64.4% of the video sampling points and 88.7% of the remote sensing classification),we assume that most of the shallow coastal subtidal areas between 0 and-30 m are predominantly composed of rocky bottoms.Thus,all areas not covered from the previous sources of information down to-30 m are assumed to be rocky bottoms.
Finally,we removed the areas covered by mangrove forests(Moity and Delgado,2018;Moity,Delgado,&Salinas-de-León,2019)as these are not an optimal habitat for I.fuscus either.Since the data used in this work was obtained while the Zoning 2000 was still guiding use restrictions in the GMR,we also removed the no-take zones(Moity,2018a,2018b)from the remaining fishing and habitat areas.
The last step in our spatially explicit model was to measure the area of the remaining rocky area within the bathymetric range used in this study.Spatial analyses were done in ESRI ArcGIS 10.6.1 software,and all layers projected to ETRS 32,715.
3.Results
The range of densities was 0–860 sea cucumbers/100 m2(10.3 mean;20.1 SD)and the range of lengths was 2–40 cm TL(20.3 mean;5.0 SD).
The seed L∞value obtained with Powell-Wetherall method was 40.1 cm(95% confidence intervals:34.9 cm–45.3 cm).The values of L∞and K with the highest ELEFAN-RSA score were 42.5 cm and 0.21/year,respectively.Fig.2 shows the von Bertalanffy growth curve fitted to length-frequency data of I.fuscus.According to this model,I.fuscus reaches L∞at the age of 32.2 years and the largest individual observed(40 cm TL)was 13.4 years old in the GMR.
The Z value estimated with Chapman-Robson method for I.fuscus in the GMR was 0.791/year(95% confidence intervals:0.677/year–0.905/year)(Fig.3).
The total habitat and fishing area for I.fuscus in the GMR was calculated as 272.1 km2(89.3% of the total available area in our model,Fig.1),which is an increase of~118% from the value calculated by Wolffet al.(2012).The habitat and fishing area for I.fuscus is available as an ESRI shape file and KMZ file at Pangaea,Data Publisher for Earth and Environmental Science(Moity&Ramírez-González,2019).The annual exploitable abundance of sea cucumber decreased from 2001 to 2004,after which abundance fluctuated between 7.9 and 23.1 million sea cucumbers(Fig.4).
The parameters Z,d,A and B estimated to replicate the MSY methodology of Wolffet al.(2012)were higher than those of these authors and the TAC was 12 times higher(Table 1).
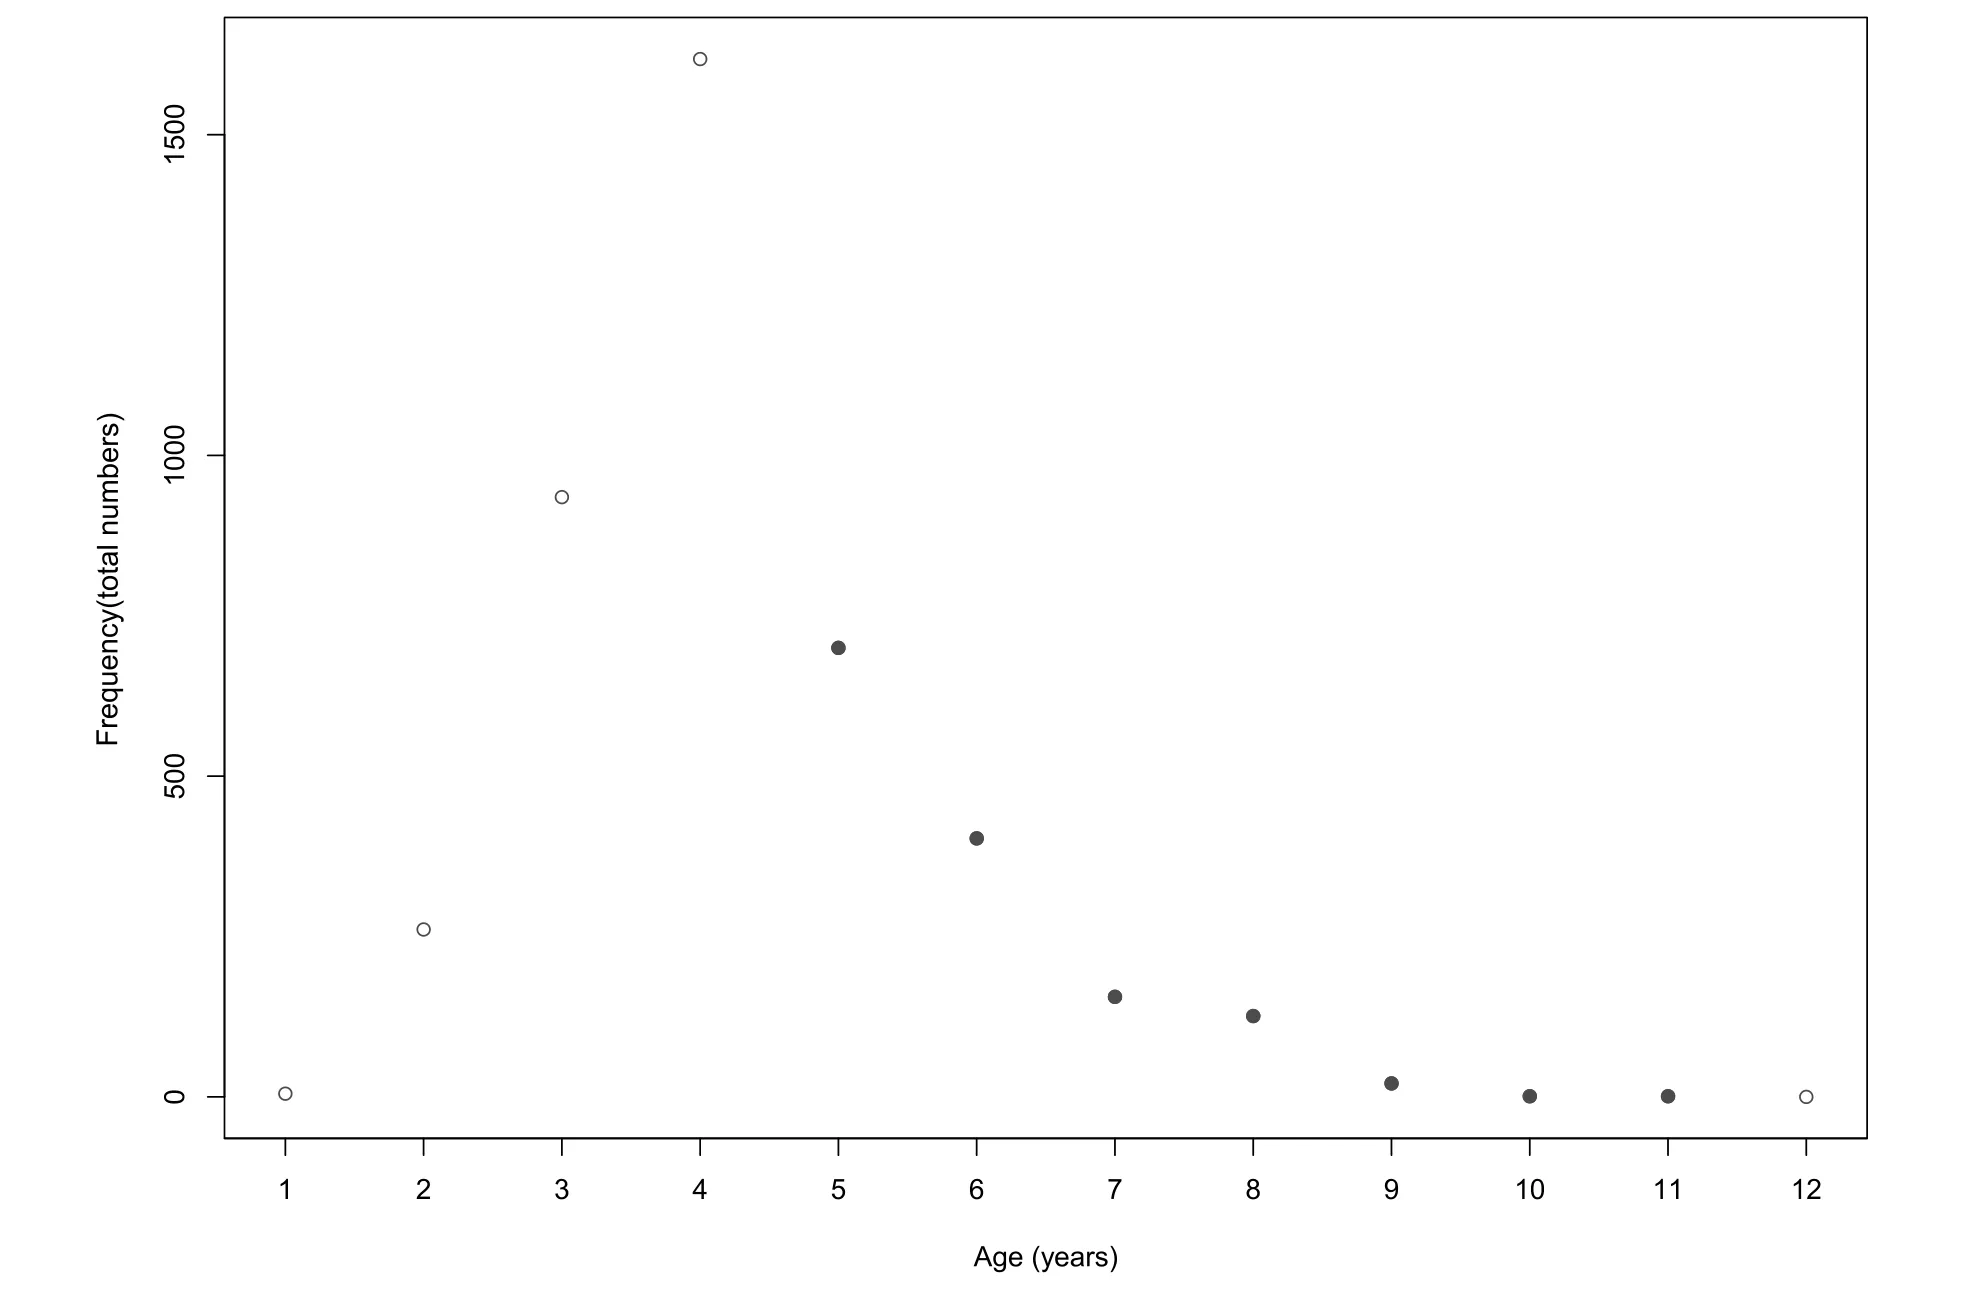
Fig.3.Length converted catch curve for I.fuscus in the Galapagos Marine Reserve by using the Chapman-Robson method.Black dots indicate recoded ages.
4.Discussion
For the first time age and growth parameters of I.fuscus were estimated in the GMR and for the eastern-central region of the Pacific Ocean.Based on these estimated growth parameters we conclude that this species has a first maturity age of 2.2 years and a maturity at 50% of the population of 3.8 years,following the maturity lengths determined by Toral-Granda(1996)for I.fuscus in Galapagos.
Fifty percent of the Galapagos I.fuscus population is mature 1.2 years earlier than off northwest Mexico(Herrero-Pérezrul,Reyes Bonilla,García-Domínguez,&Cintra-Buenrostro,1999;Reyes-Bonilla&Herrero-Perézrul,2003).Toral-Granda and Martínez(2007)suggested that the difference in maturity lengths is due to a faster growth of this species in Galapagos or to different environmental conditions between regions.
In Mexico,the L∞of I.fuscus has been estimated to range between 29.1 cm and 39.7 cm and the K between 0.18/year and 0.35/year(Glockner-Fegatti et al.,2016).The L∞in this study(42.5 cm)is the highest and the K(0.21/year)is one of the lowest that have been estimated for this species.Comparing the von Bertlanffy models between this study and the last one made for Mexico(L∞=35.74 cm;K=0.27/year),suggests that I.fuscus in Galapagos grows slower than in Mexico after its sexual maturity age(3.8 years;Fig.5).This makes sense,considering that sea cucumbers invest more energy in reproduction than in growth(Ru,Zhang,Liu,Sun,&Yang,2018)and,in Galapagos,I.fuscus reproduces all year(Toral-Granda&Martínez,2007),while in Mexico it has a seasonal reproduction(Herrero-Pérezrul et al.,1999).
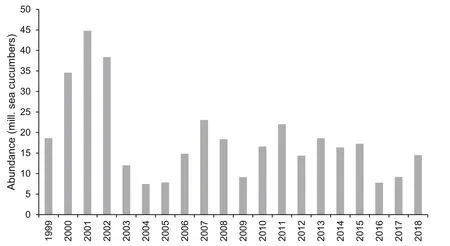
Fig.4.Annual exploitable abundances of I.fuscus in the Galapagos Marine Reserve.
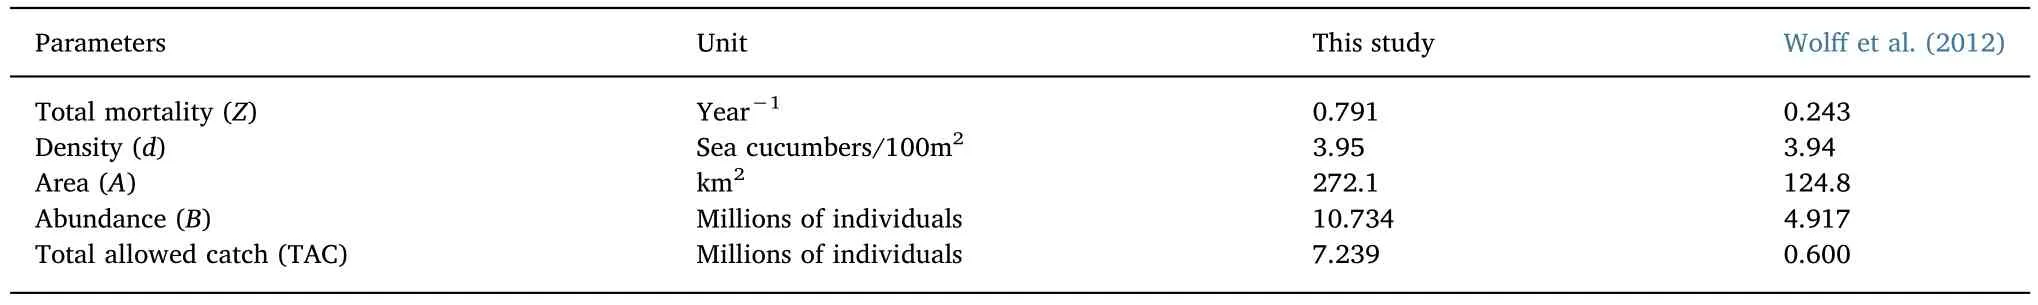
Table 1Parameters used and TAC resulted of the replication of Wolffet al.(2012)methodology of MSY using the Cadima equation.
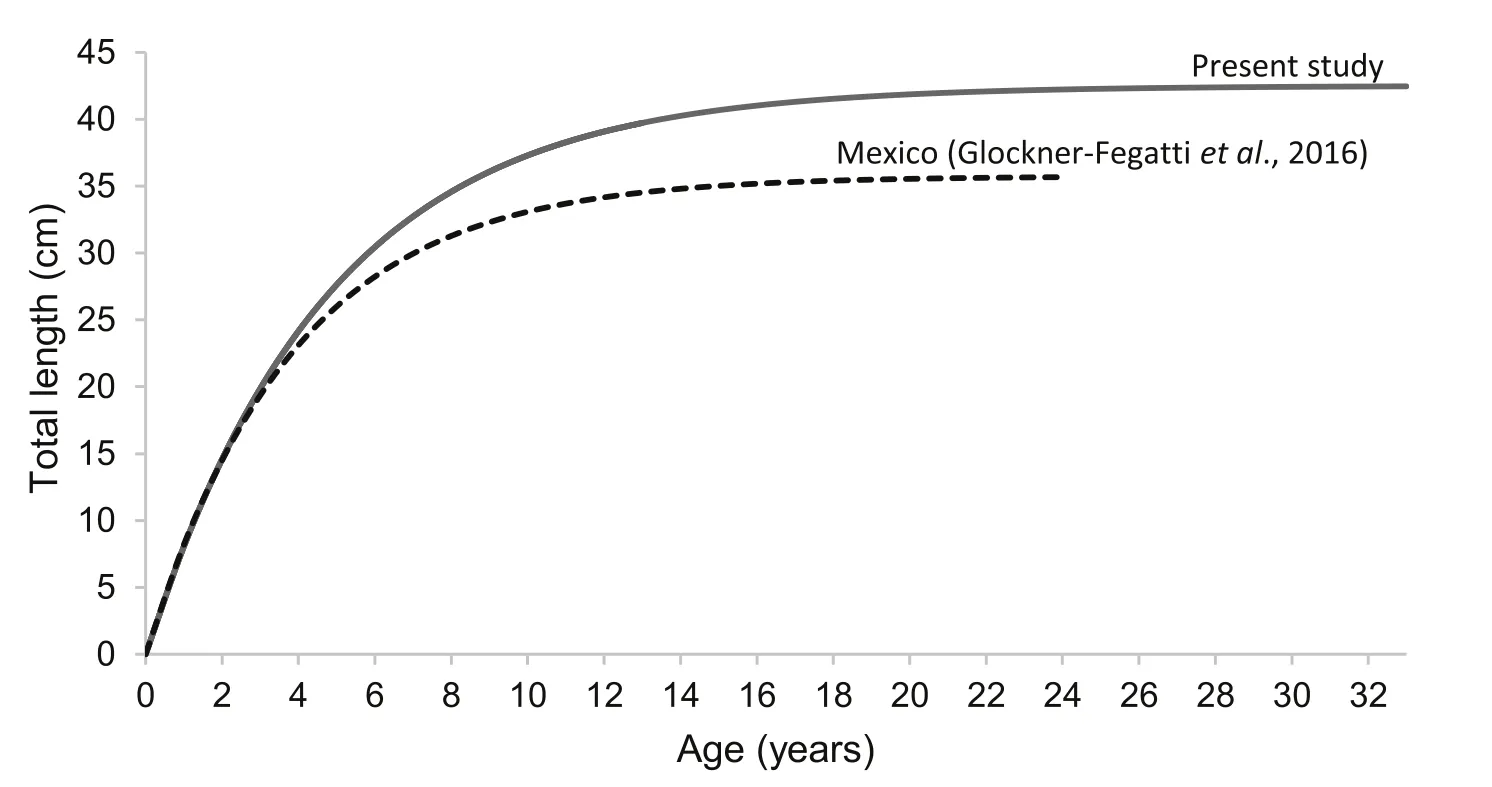
Fig.5.Von Bertalanffy growth curves model of I.fuscus of present study and Mexico.
On the other hand,the age and growth parameters were among the factors that caused differences in the MSY result between this study and Wolffet al.(2012).With these parameters,it was possible to use the Champan&Robson method to estimate the Z of I.fuscus used in the Cadima MSY equation.This method is considered a direct estimator of mortality(Then,Hoenig,Hall,&Hewitt,2015)and has been used previously to calculate the mortality for I.fuscus(Glockner-Fegatti et al.,2016).Its performance has also been assessed in a positive way with respect to other methodologies(Dunn,Francis,&Doonan,2002;Smith et al.,2012).Therefore,Champan&Robson is a validated mortality estimator.
Wolffet al.(2012)determined Z from the natural mortality value of Hearn et al.(2005)for I.fuscus in Galapagos,who used a stock depletion model.To our knowledge,this model has been used only twice to estimate natural mortality(Polovina,Haight,Moffitt,&Parrish,1993),including once for I.fuscus.Its performance as a mortality estimator has not been evaluated.Therefore,we consider that Champan&Robson's method is more appropriate for estimating mortality than the stock depletion model.
Regarding the parameter B,there were differences between our study and Wolffet al.(2012).This was because,to estimate A(equation(1))we used an updated bathymetry and new data to estimate the proportion of rocky bottom in the fishing and habitat area of I.fuscus in the GMR.Wolffet al.(2012)estimated 50% of the area suitable for I.fuscus in the fishing and habitat area.We find that~90% of the fishing and habitat area is rocky bottom(after removing the no-take zones and mangrove areas).Only 10% of the area is unsuitable sandy bottoms(versus 20% in Wolff et al.).Wolff et al.estimated that yet another 30% is too shallow or too steep while we estimate that too shallow-intertidal waters are negligible and that the currently available bathymetry in shallow areas does not allow the calculation of slopes with accuracy.In addition,to estimate B we used the proportion of sea cucumbers greater or equal to the minimum catch size authorized(20 cm TL).These methodological differences probably explain the discrepancy in our estimation of the exploitable abundance compared to Wolffet al.They should have considered only the zones where fishing was allowed,only individuals with authorized catch sizes and two additional fishing grounds of sea cucumber(east of Floreana Island and south of Isabela Island).As a result,Wolffet al.underestimated the fishing and habitat area of I.fuscus in the GMR and the exploitable abundance of this resource.
Our adjustments in the estimates of mortality and exploitable abundance with the TAC methodology of Wolffet al.(2012)resulted in a higher value of MSY.However,this does not necessarily establish a higher TAC since there is ample discussion that have emphasized that MSY as a reference point and not as a TAC value(Doubleday,1976;Larkin,1977).One of the main arguments is that the MSY demarcates the boundary point between an overexploited fishery and one that is not overexploited(Caddy&Mahon,1995).When the MSY is used as the TAC,there is a risk of exceeding this limit,due to failures in control and surveillance,or by decision-making,as in 2011,when the co-management system of the GMR decided to round offthe TAC and the MSY was exceeded by more than 155,000 sea cucumbers(see Section 1).To establish a TAC from the exploitable biomass,it is recommended to determine the extractable proportion based on the estimate of the fishing mortality for optimal fishing(Caddy&Mahon,1995).
Therefore,we recommend not using the MSY as a TAC value,but as a limit reference point for the I.fuscus fishery in the GMR.To do this,we propose to substitute the use of the Cadima equation by a dynamic surplus production model(Hilborn&Walters,1992).The justification is that Cadima equation was designed for data poor fisheries(Sparre&Venema,1998)and its scope is very limited.Currently,there are sufficient I.fuscus data from the independent monitoring in the GMR to allow the use of the dynamic surplus production model,which is capable of estimating the following reference points for a fishery:abundance for MSY,fishing effort for MSY,density for MSY and fishing mortality for MSY(Caddy&Mahon,1995;Haddon,2011).The latter would be essential for determining the TAC for the I.fuscus fishery in the GMR.
5.Conclusions
For the first time,we report age and growth parameters of I.fuscus for the GMR and the eastern-central region of the Pacific Ocean.There is sufficient evidence to justify not continuing to use the Cadima MSY equation to determine the TAC of the I.fuscus fishery in the GMR.We propose the use of a dynamic surplus production model to estimate reference points and use the fishing mortality for optimal fishing to establish the TAC for the sea cucumber fishery in the GMR.
Acknowledgements
We want to thank all the staffof the CDF,GNPD and all fishers of Galapagos who participated in the sea cucumber monitoring in the GMR from 1999 until now.As well as the Government of Ecuador,international cooperation and NGOs who have financed the sea cucumber monitoring.To the anonymous peer reviewers.CDF authors would like to thank the Gordon&Betty Moore Foundation for funding the stafftime and to Michael Brooke for reviewing the preprint.This study was conducted under research permit GNPD No.PC-37-19.This publication is contribution number 2302 of the Charles Darwin Foundation for the Galapagos Islands.
 Aquaculture and Fisheries2020年5期
- Aquaculture and Fisheries的其它文章
- Fish assemblages in protected seagrass habitats:Assessing fish abundance and diversity in no-take marine reserves and fished areas
- Assessment of faunal communities and habitat use within a shallow water system using non-invasive BRUVs methodology
- Assessing potential protection effects on commercial fish species in a Cuban MPA
- The role of marine protected areas in sustaining fisheries: The case of the National Park of Banc d’Arguin,Mauritania
- Mapping fisheries hot-spot and high-violated fishing areas in professional and recreational small-scale fisheries
- Fisher's perceptions about a marine protected area over time