
Fish assemblages in protected seagrass habitats:Assessing fish abundance and diversity in no-take marine reserves and fished areas
2020-10-21 06:02RhinnonKigginsNthnKnottTristnNewAndrewDvis
Aquaculture and Fisheries 2020年5期
Rhinnon S.Kiggins,Nthn A.Knott,Tristn New,b,Andrew R.Dvis
aCentre for Sustainable Ecosystem Solutions and School of Biological Sciences,University of Wollongong,Wollongong,NSW,2522,Australia
bFisheries Research,NSW Department of Primary Industries,PO Box 89,Huskisson,NSW,2540,Australia
ARTICLEINFO
Keywords:
Baited remote underwater video
BRUV
Jervis Bay Marine Park
JBMP
Booderee National Park
Sanctuary zone
Haletta semifasciata
Blue Weed Whiting
ABSTRACT
Marine reserves are an important management tool for conserving local biodiversity and protecting fragile ecosystems such as seagrass that provide significant ecological functions and services to people and the marine environment.With humans placing ever-growing pressure on seagrass habitats,marine reserves also provide an important reference from which changes to seagrass and their ecological assemblages may be assessed.After eight years of protection of seagrass beds(Posidonia australis)in no-take marine reserves(Sanctuary Zones)within the Jervis Bay Marine Park(New South Wales,Australia;zoned in 2002),we aimed to assess what changes may have occurred and assess continuing change through time in fish assemblages within these seagrass meadows.Using baited remote underwater videos(BRUVs),we sampled seagrass fish assemblages at three locations in no-take zones and five locations in fished zones three times from 2010 to 2013.Overall,we observed a total of 2615 individuals from 40 fish species drawn from 24 families.We detected no differences in total fish abundance,diversity,or assemblage composition between management zones,although we observed a significant increase in Haletta semifasciata,a locally targeted fish species,in no-take marine reserves compared with fished areas.Fish assemblages in seagrass varied greatly amongst times and locations.Several species varied in relative abundance greatly over months and years,whilst others had consistently greater relative abundances at specific locations.We discuss the potential utility of marine reserves covering seagrass habitats and the value of baseline data from which future changes to seagrass fish populations may be measured.
1.Introduction
As humans continue to place ever-growing pressure on the marine environment through over fishing,pollution,climate change,and maritime activities(Crain,Halpern,Beck,&Kappel,2009),marine parks have become an important tool for managing our marine resources(Gell&Roberts,2003;Halpern,2003).‘No-take’marine reserves,in which all forms of fishing and development are prohibited,are one of several management strategies commonly utilised to conserve local biodiversity and protect vulnerable habitats such as seagrass.There is growing recognition of the crucial role of such habitats for the provisioning of vital ecological function and ecosystem services in coastal areas(Lester et al.,2009;Nordlund,Unsworth,Gullström,&Cullen-Unsworth,2017).Seagrass meadows in particular,offer a multitude of services within marine environments including providing nursery habitats for small fish(Heck,Hays,&Orth,2003),improving water transparency through sediment stabilisation(Moore,2004),protection from coastal erosion(Stratigaki et al.,2011),nutrient recycling(Touchette&Burkholder,2000),trophic transfers(Heck et al.,2008),and carbon sequestration(Fourqurean,Kendrick,Collins,Chambers,&Vanderklift,2012).Despite the substantial ecosystem functions and services seagrass meadows provide,they are experiencing worldwide declines due to a combination of anthropogenic and natural disturbances(Duarte,2002;Orth et al.,2006).Thus,marine reserves provide an important management option for protecting seagrass habitats through the exclusion of destructive activities(e.g.anchoring,dredging,mooring,development)that have been shown to drastically increase seagrass fragmentation,whilst also serving as an insurance policy in the face of continued declines of these habitats(Badalamenti,Alagna,D'Anna,Terlizzi,&Di Carlo,2011;Glasby&West,2017;Okudan,Demir,Kalkan,&Karhan,2011).
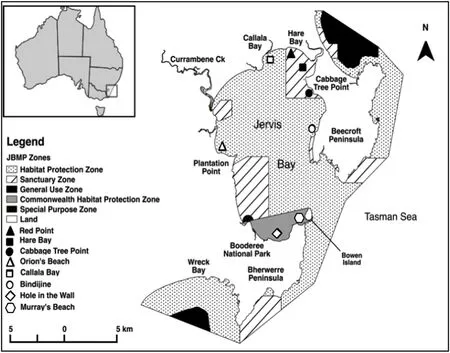
Fig.1.Sampling locations in Jervis Bay Marine Park (JBMP) and the Commonwealth waters ofBooderee National Park(BNP)in Jervis Bay,NSW Australia.BRUV units were deployed at Red Point,Hare Bay and Cabbage Tree Point(Sanctuary Zones,closed symbols),Orion's Beach,Callala Bay and Bindijine(Habitat Protection Zones,open symbols),and Hole in the Wall and Murray's Beach(Commonwealth Habitat Protection Zones,open symbols).
Equally important,no-take marine reserves may also act as reference areas where human threats are minimised thereby enabling the assessment of potential anthropogenic changes in surrounding regions(Kenchington,Ward,&Hegerl,2003).These monitoring data and their interpretation could aid policy makers and managers to make informed decisions regarding management practices.Indeed,through the exclusion of fishing practices and human development within reserve locations,considerable differences in fish abundance,diversity,biomass,and assemblage composition have been detected in a wide range of habitats between no-take marine reserves and fished areas worldwide(Halpern&Warner,2002;Stewart et al.,2009).Whilst a majority of these studies have been focussed in coral-and rocky-reef habitats(e.g.Kelaher et al.,2014;Russ,Aller-Rojas,Rizzari,&Alcala,2017;Westera,Lavery,&Hyndes,2003),a limited number have examined seagrass environments(but see:Chirico,McClanahan,&Eklöf,2017;Henderson et al.,2017;Seytre&Francour,2014;Whitmarsh,Fairweather,Brock,&Miller,2014).
Ongoing monitoring of marine reserves is essential in determining whether management objectives are being achieved(Gerber,Beger,McCarthy,&Possingham,2005;Pomeroy,Watson,Parks,&Cid,2005).Assessing the effectiveness of a reserve may involve spatial and/or temporal comparisons,and optimally,a before and after component(i.e.before and after the management change).In the absence of“before”data,temporal comparisons between no-take marine reserves and fished areas following the creation of a reserve are particularly useful and may then form a contemporary baseline to assess any future change related to the management action(Glasby,1997;Kelaher et al.,2014).This may involve a combination of short-(i.e.month-month)and longterm(i.e.year-year)assessments to obtain a more representative sample of fish assemblages across reserves and fished areas through time.
In the Australian east coast state of New South Wales(NSW),a network of multi-use marine parks has been developed.They contain several different zoning types designed to manage human activities in a sustainable manner.These include no-take marine reserves(termed Sanctuary Zones)where fishing and collecting are prohibited,Habitat Protection Zones(HPZ)where recreational fishing and some forms of commercial fishing are permitted(i.e.partially protected zones),and General Use Zones(GUZ)where recreational and commercial fishing(except longlining and estuary mesh netting)are permitted(Marine Estate Management Act,2014).The management of these marine parks requires the ongoing monitoring and review of ecological changes associated with this management approach(Kelaher et al.,2014).Although numerous studies have assessed changes in biodiversity associated with marine park management in Australia(e.g.Coleman et al.,2015;Ferguson,Harvey,&Knott,2016;Malcolm,Schultz,Sachs,Johnstone,&Jordan,2015;Malcolm,Jordan,Creese,&Knott,2016),very few studies have provided an assessment of seagrass fish assemblagesbetween protection zones in an Australian marine park(Henderson et al.,2017;Whitmarsh et al.,2014).Rather,the vast majority of such studies have occurred in the northern hemisphere,specifically the Mediterranean region(e.g.Francour,2000;Raventos,Ferrari,&Planes,2009;Seytre&Francour,2014).
This study aimed to assess changes in spatial and temporal patterns of fish assemblages in a no-take marine reserve and several fished areas withinPosidonia australisseagrass meadows in Jervis Bay,Australia.Our study commenced eight years after no-take protection had been in place and incorporated sampling over a three-year period providing estimates for year-to-year variation and shorter-term month-to-month variation.We tested the general null hypotheses that there would be:1)no difference in species composition and abundance between no-take marine reserves and fished areas;and 2)that any differences in the patterns of fish abundance and diversity in no-take marine reserves compared with fished areas would be consistent through time.Overall,we aimed to provide a quantitative assessment of any ecological changes in the fish assemblages related to marine park management,and provide a contemporary baseline of data from which future changes can be measured.
2.Materials and methods
2.1.Study location
Sampling was carried out in Jervis Bay Marine Park(JBMP)and the adjacent waters of Booderee National Park(BNP)located in Jervis Bay,a large(21000 ha)open embayment in NSW,Australia(35°08′S,150°45’E)(Fig.1).The average depth within Jervis Bay is 16m,with the 10m depth contour generally found 1.5km from the shoreline of the Bay(New South Wales Roads and Maritime Services,2014;Roper et al.,2011).The shallow nature of the Bay,along with the excellent water clarity,explains the large expanses of seagrass meadows present throughout Jervis Bay since many seagrass species typically grow in<10m water depth(West,1990).
Established in 1998,JBMP is a multi-use marine park managed by the NSW State Government with zoning plans introduced in 2002.The majority of JBMP consists of Sanctuary Zones(SZ:referred to here as no-take marine reserves)and Habitat Protection Zones(HPZ:referred to here as fished areas).The Commonwealth section of the Bay(under the control of the Federal Government of Australia)is part of the Booderee National Park,and is located within the southern portion of Jervis Bay.This area is also managed as a HPZ with the exception of anchoring,which is prohibited in waters shallower than 10m(i.e.to protect seagrass meadows in these areas).The NSW State Government and Commonwealth National Parks enforce JBMP and Commonwealth zoning restrictions respectively,whilst dedicated marine park compliance officers and rangers routinely patrol the marine park to maintain a high level of compliance.
2.2.Survey design
To assess the temporal consistency of any potential differences in fish assemblages in Jervis Bay in relation to the marine park management zones,we sampled across several locations in both no-take marine reserves and fished areas in August 2010(austral winter),September 2012(austral spring),and January 2013(austral summer)between 0800 and 1600 h(Fig.2).The timing of sampling was not specifically important as we were testing for general effects or the consistency of differences between the “ fished”and “no-take areas”and the three sampling times were driven mainly by logistics and feasibility.In the initial sampling round(2010),we sampled six locations within JBMP including three no-take marine reserve locations:Red Point,Hare Bay,and Cabbage Tree Point(located in Hare Bay SZ;Figs.1 and 2);and three fished locations:Bindijine,Orion's Beach,and Callala Bay(located in HPZ;Figs.1 and 2).In 2012 and 2013,we sampled an additional two fished locations within BNP:Murray's Beach and Hole in the Wall(Figs.1 and 2).At each location,four baited remote underwater videos(BRUVs)were deployed by boat,separated by a minimum of 250m.Each BRUV unit was left to record for 35 min to allow for 30min sampling time.This decision was based on previous BRUV studies with similar sampling times(e.g.Broad,Knott,Turon,&Davis,2010;McKinley et al.,2011;Westera et al.,2003).All sampling occurred in shallow seagrass beds at depths of 0.8–6.3m within SZ and 1–8.8m within HPZ(see supplementary material).The range of depths were similar for each zone and were selected based on visibility and the presence of seagrass at depths of less than 10m.BRUV samples were taken haphazardly within each location and global positioning system(GPS)co-ordinates for each replicate were recorded.The same locations were surveyed in each of the three sampling periods.Hare Bay SZ is the main no-take marine reserve with substantial areas of seagrass within the Bay.Hence,locations within this reserve were compared to those in fished areas from across Jervis Bay using an asymmetrical design(as per Glasby,1997).
2.3.Sampling fish:BRUVs
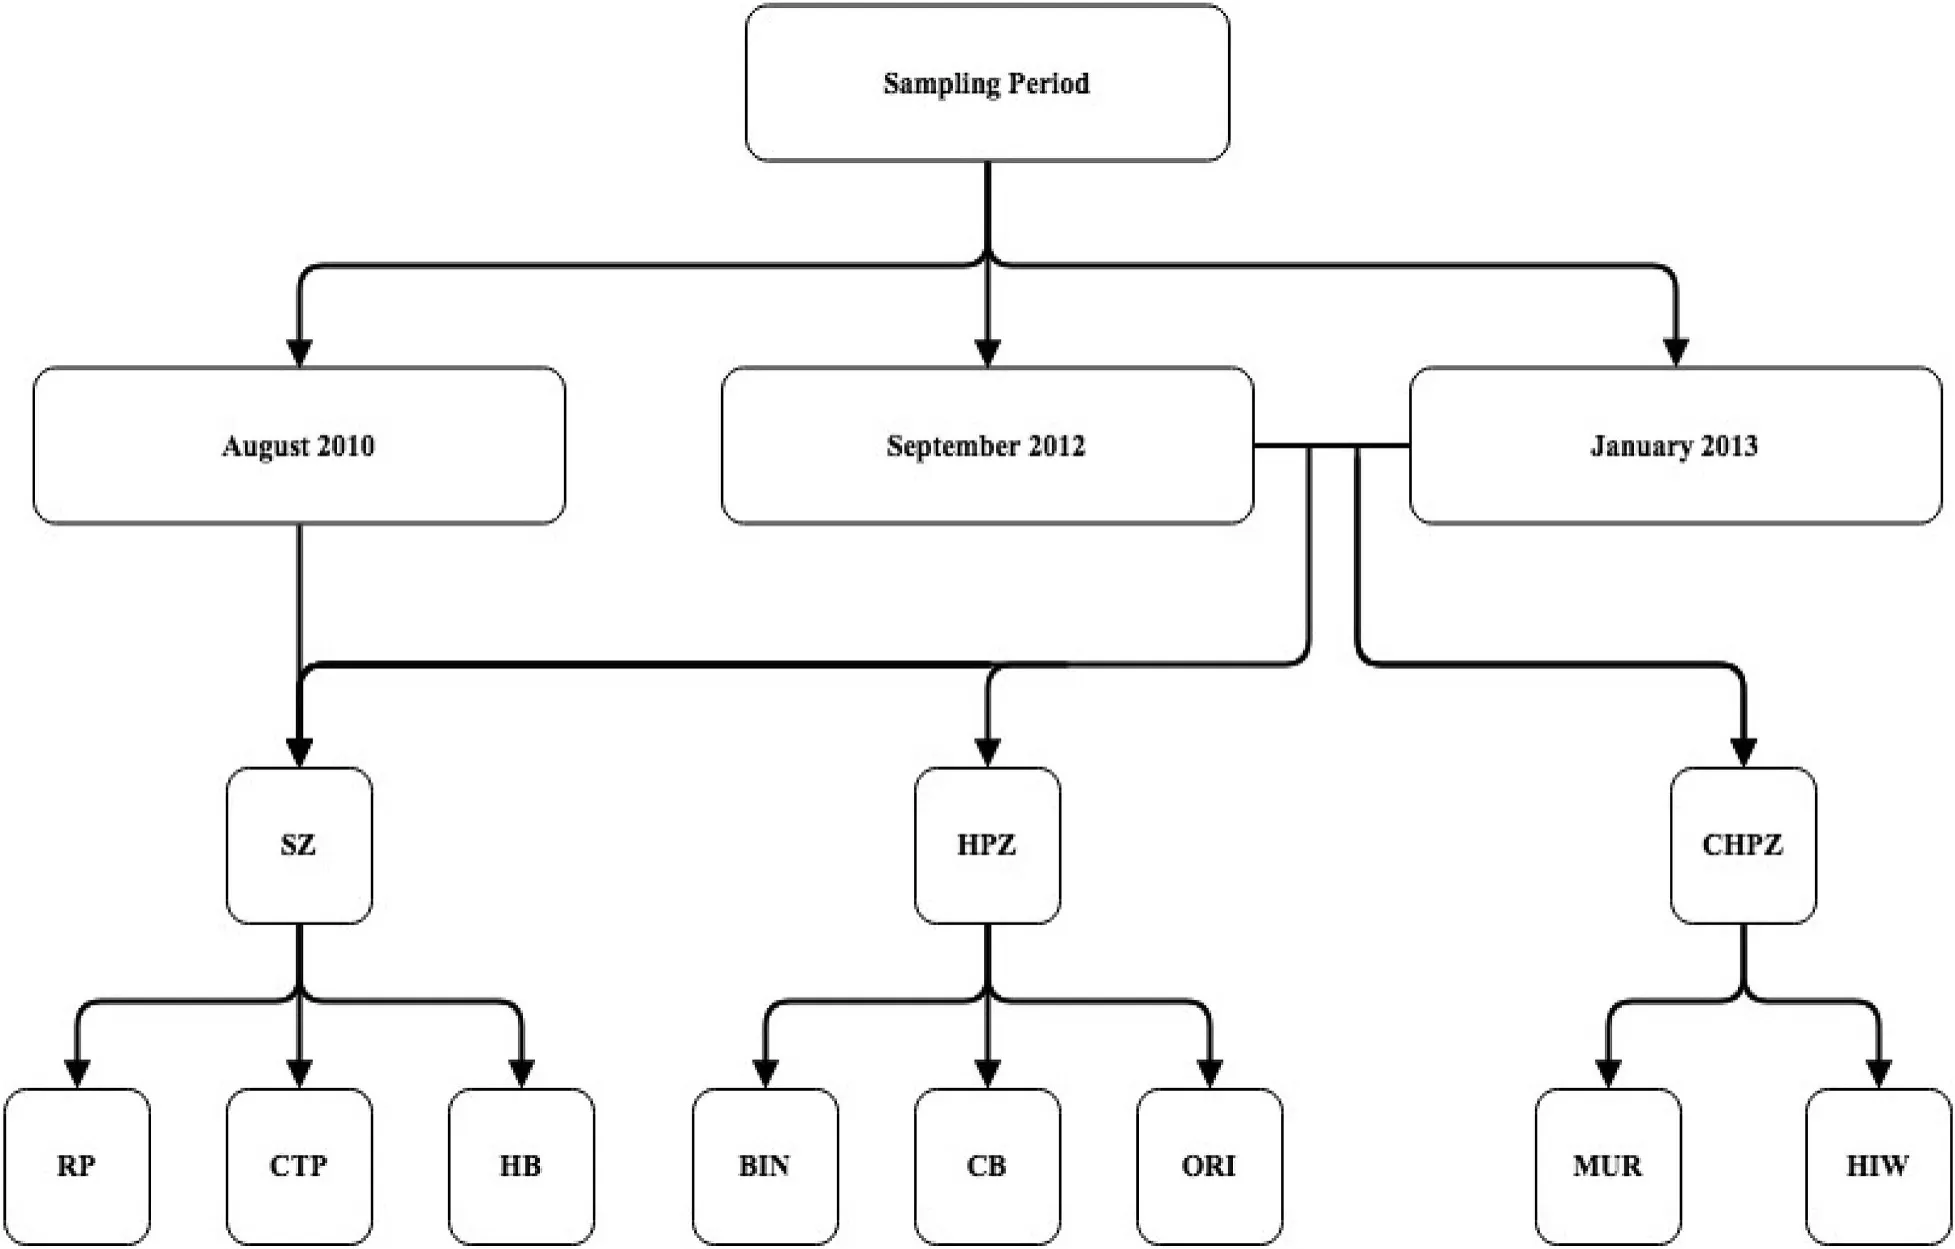
Fig.2.Schematic representation of experimental design.Four BRUVs were deployed at each of the 8 locations surveyed throughout Jervis Bay including:Red Point(RP),Cabbage Tree Point(CTP),and Hare Bay(HB)(situated in Sanctuary Zones,SZ);Bindijine(Bin),Callala Bay(CB),and Orion's Beach(Ori)(situated in Habitat Protection Zones,HPZ);Murray's Beach(Mur),and Hole in the Wall(HIW)(situated in Commonwealth Habitat Protection Zones,CHPZ).
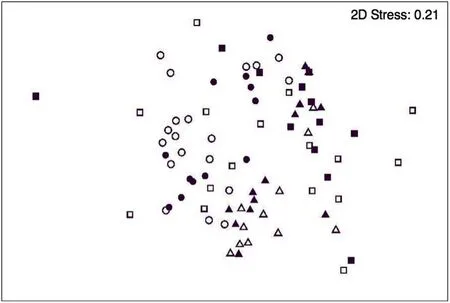
Fig.3.nMDS plot of seagrass fish assemblages in Sanctuary Zones(closed)and Habitat Protection Zones(open)across 2010(triangles),2012(squares),and 2013(circles)in Jervis Bay,Australia.
BRUV units were based on conventional designs and included single and stereo units(Cappo,Speare,&De'ath,2004).Each unit comprised of a galvanised steel frame to provide support and structure.A PVC bait arm extended horizontally 1.5m from the BRUV frame and a bait canister made from plastic mesh was attached to the end of the bait arm.A rope of minimum 10m length was attached to two buoys,used to relocate BRUV units after sampling.Approximately 500 g of crushed pilchards(Sardinops sagax)were used and replaced after each deployment to ensure a consistent volume of bait across replicates.Pilchards have previously been shown to be an effective bait for surveying marine fish assemblages(Wraith,Lynch,Minchinton,Broad,&Davis,2013).BRUV units contained High Definition Canon HG21 cameras with a wide angle lens and placed in waterproof housings.Cameras were set on ‘Manual Infinity’focus and footage was recorded to secure digital(SD)cards.
2.4.Video and statistical analyses
Video analysis commenced from Bottom Time(BT)(i.e.the time when the BRUV unit settled on the sea floor)and were analysed for exactly 30min from BT.All fish observed during this time and identified to species level were included in the analyses.Species identified were verified with experienced stafffrom Fisheries NSW and the University of Wollongong(UOW),and an ‘Image Library’was produced for quality control purposes.
For each video,we recorded species richness,TotalMax N,and time of first arrival(T1st).T1stestimates were taken for only 2012 and 2013 data and were unavailable for 2010.Max Nis the maximum number of individuals of a species observed in a single frame throughout the 30 min video and is a relative measure of abundance.This approach prevents counting the same individual twice should it swim in and out of the frame(Willis,Millar,&Babcock,2000).Max Nwas measured for each identified species and aTotal Max Nwas the sum of all speciesMax Ns.T1stis the time of first arrival of each fish species on video and can also be used as an indicator of relative abundance.Max NandT1stestimates of fish were analysed for seven species,which were observed in>20% of samples(i.e.commonly occurring).Analyses on species that occur less commonly than 20% are difficult to analyse and interpret.
To test for differences in the fish assemblages and the relative abundances of commonly occurring species between no-take locations(SZ) and fished locations (HPZ) a three-way asymmetrical PermutationalMultivariateAnalysisofVariance(PERMANOVA;Primer-E Version 6)was used.These analyses included the factors:Zone[a fixed factor with two levels:Sanctuary Zones(no-take)and Habitat Protection Zones( fished)],Time(a random factor with three levels:August 2010,September 2012,and January 2013),and Location(a random factor nested within Zone with 3–5 levels depending on the time period and zone).Multivariate analyses used Bray-Curtis measures of dissimilarity and the univariate analyses used Euclidean distance measures.All analyses used untransformed data.Only data from fish identified to the level of species were included in the analyses(i.e.only nine fish observed in the videos were excluded from the analyses).Patterns of fish assemblage composition and abundance were visualised with Non-Metric Multi-Dimensional Scaling(nMDS)ordination plots.Due to the patchy distribution of many seagrass species,the time of first arrival analyses varied from species to species;Acanthopagrus australis,Helotes sexlineatus,andTrachurus novaezelandiaewere only abundant enough to be analysed for 2013;Haletta semifasciataandHeterodontus portusjacksonipooled across 2012 and 2013 sampling times;Nelusetta ayraudonly included locations where it occurred in 2012 and 2013;and onlyTrygonorrhina fasciatawas abundant enough to be analysed for both 2012 and 2013.
3.Results
Across 88 deployments examining spatial and temporal patterns of seagrass fish assemblages,we recorded a total of 2615 fish and 40 species from 24 families(Supplementary Table 1).This included 497 individuals and 20 species from 14 families in August 2010(n=24),570 individuals and 25 species from 18 families in September 2012(n=32),and 1548 individuals and 35 species from 21 families in January 2013(n=32).Only one unique species was observed in the 2010 samples,whilst four and eight unique fish species were found in the 2012 and 2013 samples,respectively.Whilst all individuals were identified in 2010 and 2012,nine individuals could not be identified in January 2013 including three individuals from the Monacanthidae.All unidentified fish(excluding one species from theCheilodactylusgenus)were excluded from the analysis.
No differences were detected in fish assemblages in seagrass in the no-take marine reserves and fished areas(Fig.3,Table 1).The major difference in these assemblages was amongst sampling times(Fig.3,Table 1),with changes through time often dependent on location(Fig.3,Table 1).There were also no differences in the species richness for seagrass fish assemblages between no-take marine reserves and fished areas(Fig.4,Table 1)nor were there differences for the total relative abundances(TotalMax N)or the time of first arrival for all fish species(Fig.4,Table 1).Changes amongst sampling times was where most variation in assemblages,species richness,total fish relative abundance and time of first arrival(T1st)for seagrass fish occurred,and for the assemblage and the total relative abundance this was also dependent on location(Fig.4,Table 1).Several abundant schooling species(i.e.Helotes sexlineatus–Eastern Striped Grunter,Gerres subfasciatus–Common Silverbiddy,andNelusetta ayraud–Ocean Jacket)were also excluded from the analyses,however,their inclusion or exclusion from the analysed dataset or transformation of the data did not change our interpretation of the analyses.
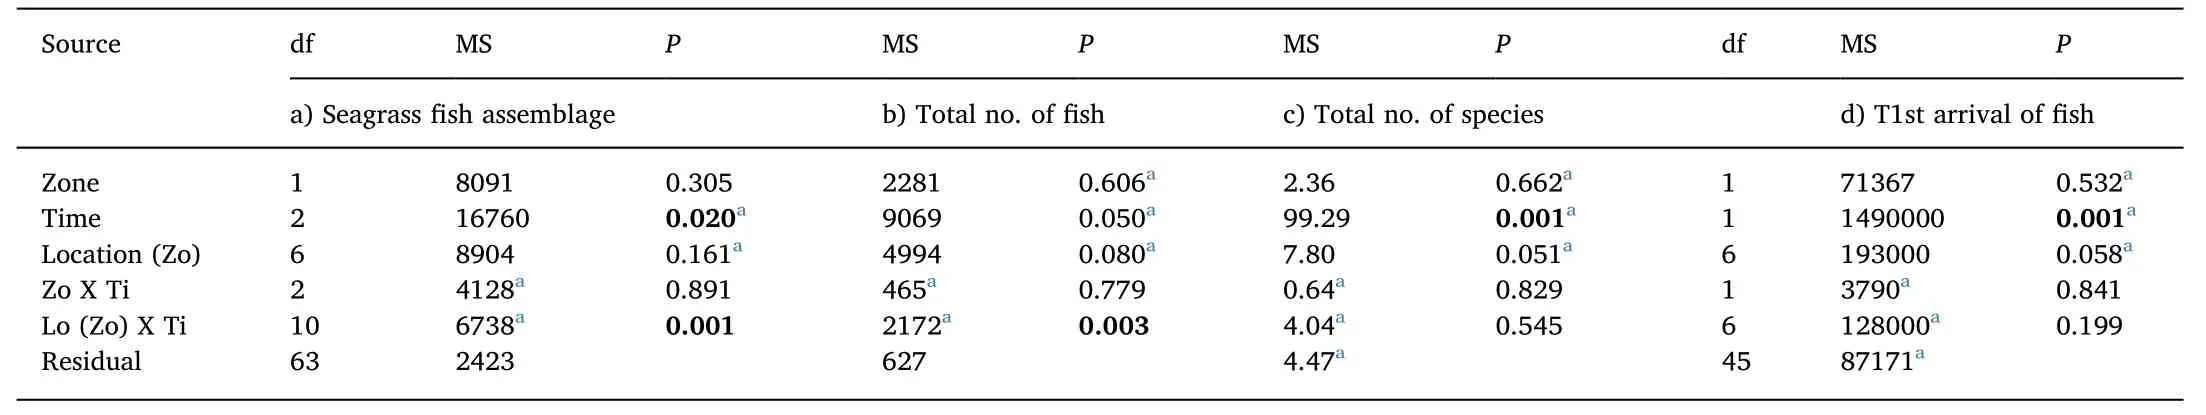
Table 1A comparison of fish assemblages in seagrass in Sanctuary Zones and Habitat Protection Zones.Three-way asymmetrical Permanova results for a)seagrass fish assemblage,b)abundance(total max N),and c)species richness of seagrass fish recorded in August 2010,September 2012,and January 2013(Time,Random)across 8 locations(Location,Random)in Jervis Bay,Australia.Three-way asymmetrical Permanova results for d)time of first arrival(T1st)of seagrass fish recorded in September 2012 and January 2013at 8 locations(Location,Random)in Jervis Bay,Australia.Multivariate analyses(a)used Bray-Curtis dissimilarities;and the univariate analyses(b-d)used Euclidean distances.Data for all taxa are untransformed.P-values in bold represent significant tests.
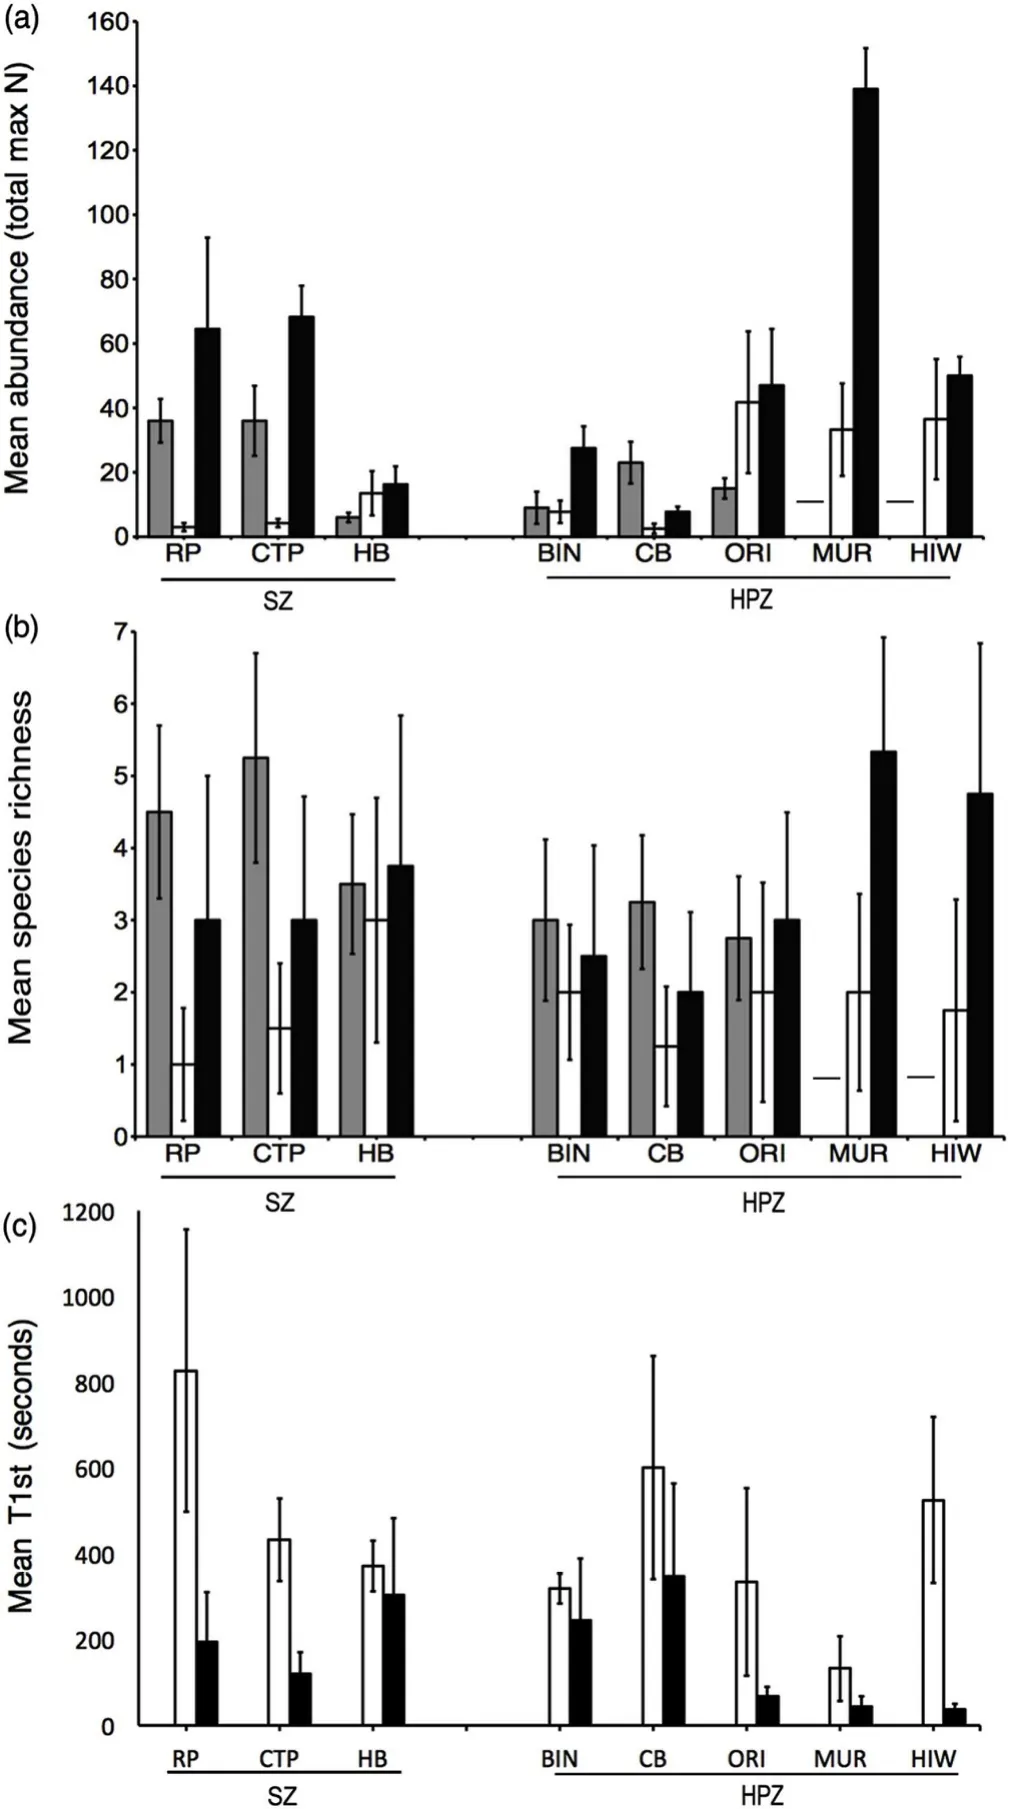
Fig.4.A comparison of fish assemblages in seagrass in Sanctuary Zones and Habitat Protection Zones in Jervis Bay,Australia.a)Mean(±s.e.m.)relative abundance(total max N),b)Mean(±s.e.m.)species richness,and c)Mean(±s.e.m.)time of first arrival(T1st).Locations sampled in Sanctuary Zones included Red Point(RP),Cabbage Tree Point(CTP),and Hare Bay(HB),and in Habitat Protection Zones included Bindijine(BIN),Callala Bay(CB),Orion's Beach(ORI),Murray's Beach(MUR),and Hole in the Wall(HIW).Sampling was carried out in August 2010(grey),September 2012(white),and January 2013(black).Hyphens indicate no data for 2010at Murray's Beach and Hole in the Wall.Note,T1st values were only available for 2012 and 2013.
Across each sampling time we observed large variation in seagrass fish assemblages(Fig.4)at most locations(except Callala Bay).Generally,there was a higher mean abundance of seagrass fish in 2013 compared with 2010 and 2012 samples.Similarly,at each location fish arrived more rapidly in 2013 compared with 2012,adding further support to a higher abundance of fish during 2013(Fig.4).The mean number of seagrass fish species differed significantly across time with greater diversity observed at all locations in 2010[which had the fewest locations(six)and total replicates(24)]and 2013 compared with 2012,and 2010 samples recording either higher or similar species richness compared with our 2013 samples(Fig.4,Table 1).
Seagrass fish abundance and diversity was also influence by location(Fig.4,Table 1).In 2010,the highest mean abundance(TotalMax N)and species richness was recorded for Cabbage Tree Point,whilst Orion's Beach and Hare Bay recorded the greatest abundance and diversity in 2012,respectively.In 2013,Murray's Beach produced the highest abundance and diversity estimates compared to all other locations.Conversely,Callala Bay recorded the lowest abundance and species richness of all locations in 2012 and 2013.Interestingly,Hare Bay recorded amongst the highest diversity estimates in all years,however,TotalMax Nwas amongst the lowest when compared to other locations in each sampling time.
Haletta semifasciata(Blue Weed Whiting)was found to differ significantly in mean abundance(TotalMax N)between management zones.H.semifasciatarecorded large increases in mean abundance(TotalMax N)in no-take marine reserves compared with fished areas,and was most abundant at Red Point in 2010,followed by Hare Bay in 2012(Fig.5,Table 2).There was no statistically significant difference in the time of first arrival(T1st)ofH.semifasciatabetween the reserve and fished locations(Fig.6).No other species showed any significant differences in relative abundance or inT1stbetween these two management zones(Figs.5 and 6,Tables 2 and 3).
The abundance of several fish species includingAcanthopagrus australis,Helotes sexlineatus,andNelusetta ayrauddisplayed significant differences across time;most notably,increased abundance during January 2013 compared with August 2010 and September 2012(Fig.5,Table 2).Similarly,H.sexlineatusandTrachurus novaezelandiae(Yellowtail Scad)recorded faster arrival times in 2013 compared with 2012,suggesting increased abundances during this period(Fig.6,Table 3).Across sampling periods,two elasmobranch species,Trygonorrhina fasciata(Eastern Fiddler Ray)andHeterodontus portusjacksoni(Port Jackson Shark),displayed consistently high mean abundances(TotalMax N)at several specific locations in both no-take marine reserves and fished areas,recording a significant effect for location,and location dependent on time,respectively(Fig.5,Table 2).In particular,high numbers ofH.portusjacksoniwere recorded at Murray's Beach,Orion's Beach,and Cabbage Tree Point,whilstT.fasciataappeared to be found in large numbers at Murray's Beach.BothH.portusjacksoniandT.fasciatarecorded their highest abundance at Orion's Beach and Murray's Beach,and this was reflected in the lowestT1stestimates for these species at the same locations(Fig.6,Table 3).
4.Discussion
The important role of no-take marine reserves in conserving fish abundance and diversity has been well documented within the literature(e.g.Francour,2000;Lester et al.,2009;Macpherson,Gordoa,&Garcia-Rubíes,2002).However,the vast majority of these studies have taken place in coral-or rocky-reef environments with few having examined fish assemblages in protected seagrass habitats (but see,Henderson et al.,2017;Chirico et al.,2017;Seytre&Francour,2014;Whitmarsh et al.,2014).The current study provides one of the few assessments of potential ecological changes to fish assemblages within protected seagrass beds and in particular within an Australian context.For Jervis Bay,we only identified limited changes in the fish assemblages related to reserve protection with onlyHaletta semifasciata(Blue Weed Whiting)showing higher relative abundances in reserve locations than in fished locations.This was surprising considering the international studies which have demonstrated substantial differences in the assemblages of fishes in seagrass within no-take areas compared to fished areas(Chirico et al.,2017;Macpherson et al.,2002;Seytre&Francour,2014).Conversely,the only other Australian studies found little or no differences between fished and no-take areas(Whitmarsh et al.,2014;Henderson et al.,2017)similarly to our study.
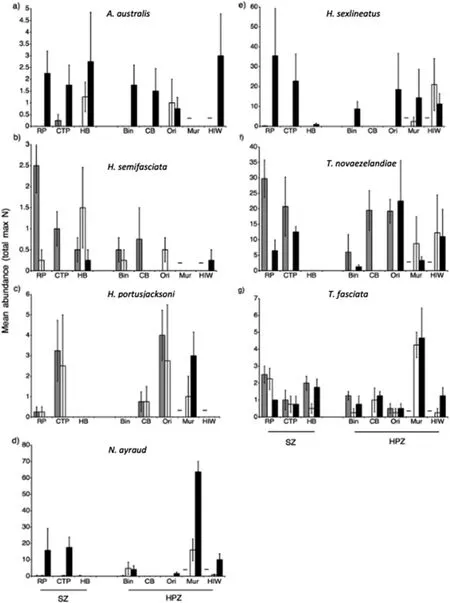
Fig.5.A comparison of mean(±s.e.m.)relative abundance(total max N)of fish species found in>20% of samples in seagrass in Sanctuary Zones and Habitat Protection Zones in Jervis Bay,Australia.a)Acanthopagrus australis,b)Haletta semifasciata,c)Heterodontus portusjacksoni,d)Nelusetta ayraud,e)Helotes sexlineatus,f)Trachurus novaezelandiae,and g)Trygonorrhina fasciata.Times and locations sampled as in Fig.4.
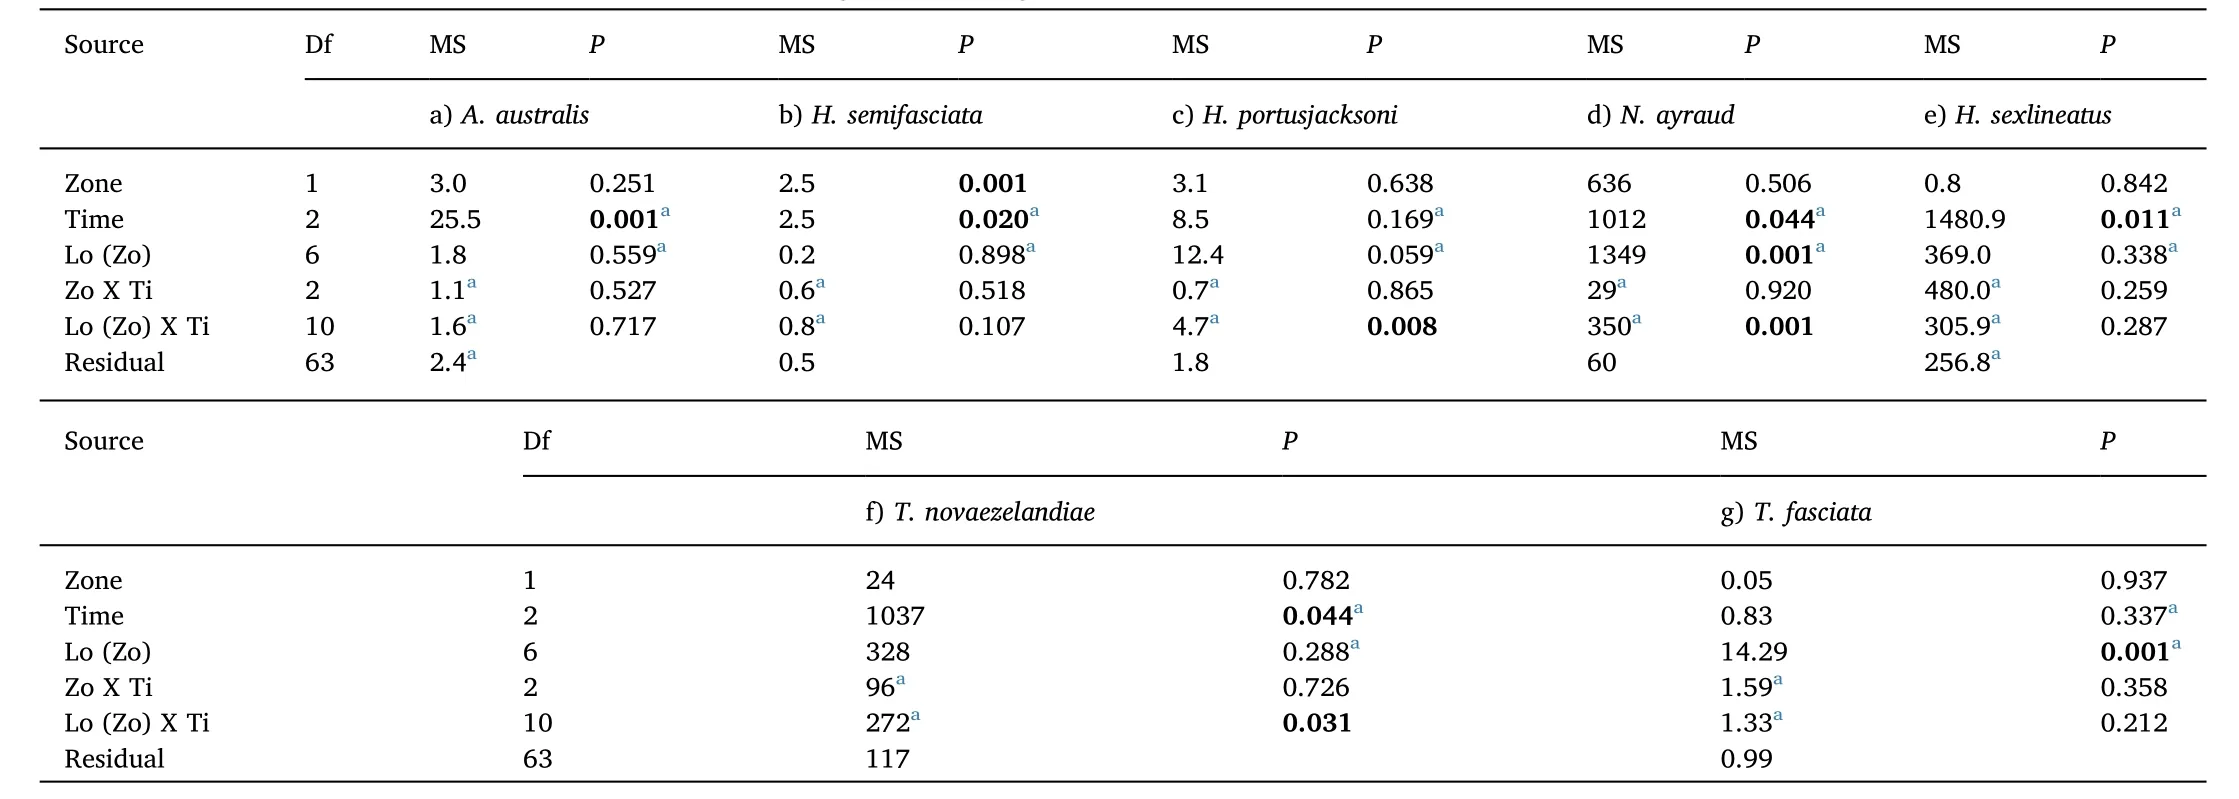
Table 2A comparison of the relative abundance of common fish species in seagrass in Sanctuary Zones and Habitat Protection Zones.Three-way asymmetrical Permanova results(using Euclidean Distance)for total abundance of a)Acanthopagrus australis,b)Haletta semifasciata,c)Heterodontus portusjacksoni,d)Nelusetta ayraud,e)Helotes sexlineatus,f)Trachurus novaezelandiae,and g)Trygonorrhina fasciata recorded in seagrass meadows located in Sanctuary Zones and Habitat Protection Zones(Zone,Fixed)across August 2010,September 2012,and January 2013(Time,Random)at 8 locations(Location,Random)in Jervis Bay,Australia.Data for all taxa are untransformed.P-values in bold writing represent significant tests.
Studies that have documented clear reserve effects for fish assemblages in seagrass have been located in areas with high levels of fishing pressure or habitat degradation(Nordlund et al.,2017;Rodriguez-Rodriguez et al.,2015).It is possible that the lack of effects within Australian marine reserves is because of the low fishing pressures in these areas and generally good condition of seagrass that have been studied.Seagrass beds,in particular,are less frequently fished compared with other habitat types in this region,and beach-hauling is prohibited over seagrass in NSW.For example,Lynch(2006)in Jervis Bay,reported consistently higher concentrations of recreational fishing in deep reef and creek habitats in JBMP while fishing in seagrass habitats was mostly associated with recreational fishers targeting squid(Sepioteuthis australis).Commercial haul net fishing is,however,relatively common in Jervis Bay and occurs frequently in areas directly adjacent to seagrass and at some locations over seagrass within Habitat Protection Zones within the marine park.
Previous studies that report no differences or variation between fish assemblages from no-take and fished areas across a wide range of habitats have attributed the lack of effects to various factors.In particular,marine reserve performance has been linked to rates of compliance(Claudet&Guidetti,2010;McLean,Harvey,Fairclough,&Newman,2010),design(Edgar et al.,2014;Malcolm et al.,2015),and the age of a marine park(Edgar et al.,2014;Malcolm et al.,2015).However,these factors are unlikely to explain the patterns observed in Jervis Bay.Both JBMP and BNP employ full-time marine park officers or rangers and compliance is strictly enforced via random and regular sea patrols throughout no-take marine reserves and fished waters.Similarly,poor design was not considered to be an issue,with Hare Bay SZ protecting some of the largest(and thus most ecologically valuable)seagrass meadows in Jervis Bay and the entire NSW coastline.Finally,zoning practices in JBMP had been in place for just eight years at the onset of this study which would seemingly provide adequate time for ecological differences to develop between reserve and non-reserve areas.Similarly,Whitmarsh et al.(2014)also found no significant differences in fish assemblages in seagrass beds in fished areas and Pelican Lagoon Aquatic Reserve in South Australia,despite its establishment in 1971.Alternatively,however,Henderson et al.(2017)found fish assemblages in seagrass in no-take reserves were different from those in fished seagrass beds.
Throughout our study,seagrass fish abundance and diversity estimates were highly variable across time and locations although several key patterns were observed.First,we recorded an increase in mean fish abundance(TotalMax N)and species richness in seagrass fish at all locations in January 2013(austral summer)compared with September 2012 (austral spring).Moreover,several individual species(i.e.Acanthopagrus australis,Nelusetta ayraud,andHelotes sexlineatus)were observed as having significantly higher numbers in January 2013 compared with August 2010(austral winter)and September 2012.Indeed,similar patterns have been found for other studies assessing short-term temporal changes and have been attributed to increased water temperatures and recruitment processes related to changes in season(Farrugia,Espinoza,&Lowe,2014;de Azevedo,da Cruz,&Araujo,2016).It is important to note,however,that whilst sampling occurred during the austral winter,spring,and summer,the lack of seasonal replication across multiple years meant that we could not attribute a significant result to change in season.Rather,this study demonstrated the occurrence of large temporal variation in seagrass fish assemblages across several months.Second,with the exception of Red Point in 2013,Callala Bay recorded the lowest abundance and diversity estimates of all locations in 2012 and 2013.In Jervis Bay,the vast majority of seagrass meadows are relatively intact with anchoring and mooring excluded from large parts of both Hare Bay and BNP.At Callala Bay,however,large-scale fragmentation has occurred in seagrass beds as a result of extensive mooring damage in this area(Fig.7,Demers,Davis,&Knott,2013).This may explain the low abundance and diversity of seagrass fish recorded at Callala Bay with previous studies highlighting a substantial link between reduced seagrass cover and declining fish populations(Kiggins,Knott,& Davis,2018;McCloskey&Unsworth,2015;Uhrin&Holmquist,2003).These findings lend support to continued sanctuary zone protection of seagrass meadows through a ‘no-anchoring/mooring’policy in no-take marine reserves in JBMP(NSW)and BNP(Commonwealth waters HPZ).
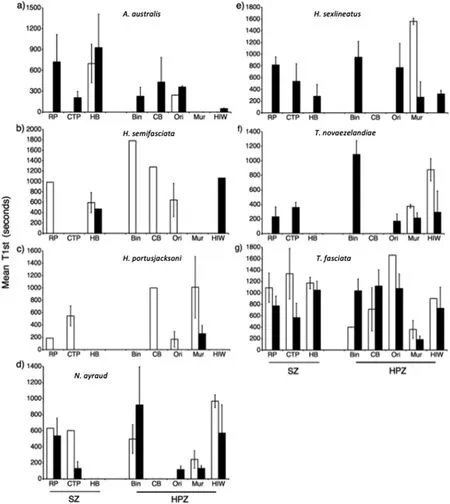
Fig.6.A comparison of mean(±s.e.m.)and time of first arrival(T1st)(seconds)of fish species found in>20% of samples in seagrass in Sanctuary Zones and Habitat Protection Zones in Jervis Bay,Australia.a)Acanthopagrus australis,b)Haletta semifasciata,c)Heterodontus portusjacksoni,d)Nelusetta ayraud,e)Helotes sexlineatus,f)Trachurus novaezelandiae,and g)Trygonorrhina fasciata.Times and locations sampled as in Fig.4.Graphs include only data for 2012 and 2013 as T1st data were not available for 2010.
Importantly,we detected a significant increase in mean abundance(Max N)ofHaletta semifasciata(Blue Weed Whiting)in no-take marine reserve locations compared with fished areas.H.semifasciatainhabits and forages in shallow seagrass environments(MacArthur&Hyndes,2007),and although not considered a key economic species in Australia,it is a valuable species for small-scale local commercial and recreational fisheries,particularly in Jervis Bay(Gomon,Bray,&Kuiter,2008;Russell et al.,2012).Whitmarsh et al.(2014)observed a similar pattern in whichH.semifasciatawas observed at higher numbers in no-take marine reserves compared with adjacent fished areas.Moreover,Edgar and Shaw(1995)demonstrated the importance of intact seagrass meadows for the abundance ofH.semifasciatawith individuals showing a preference towardsPosidoniaseagrasscharacterised by a dense canopy of foliage.As a targeted commercial and recreational species,together with its vulnerability to seagrass loss(Edgar&Shaw,1995),this has important implications for zoning plans in JBMP and BNP as it suggests no-take marine reserves provide an important protective measure for this species.
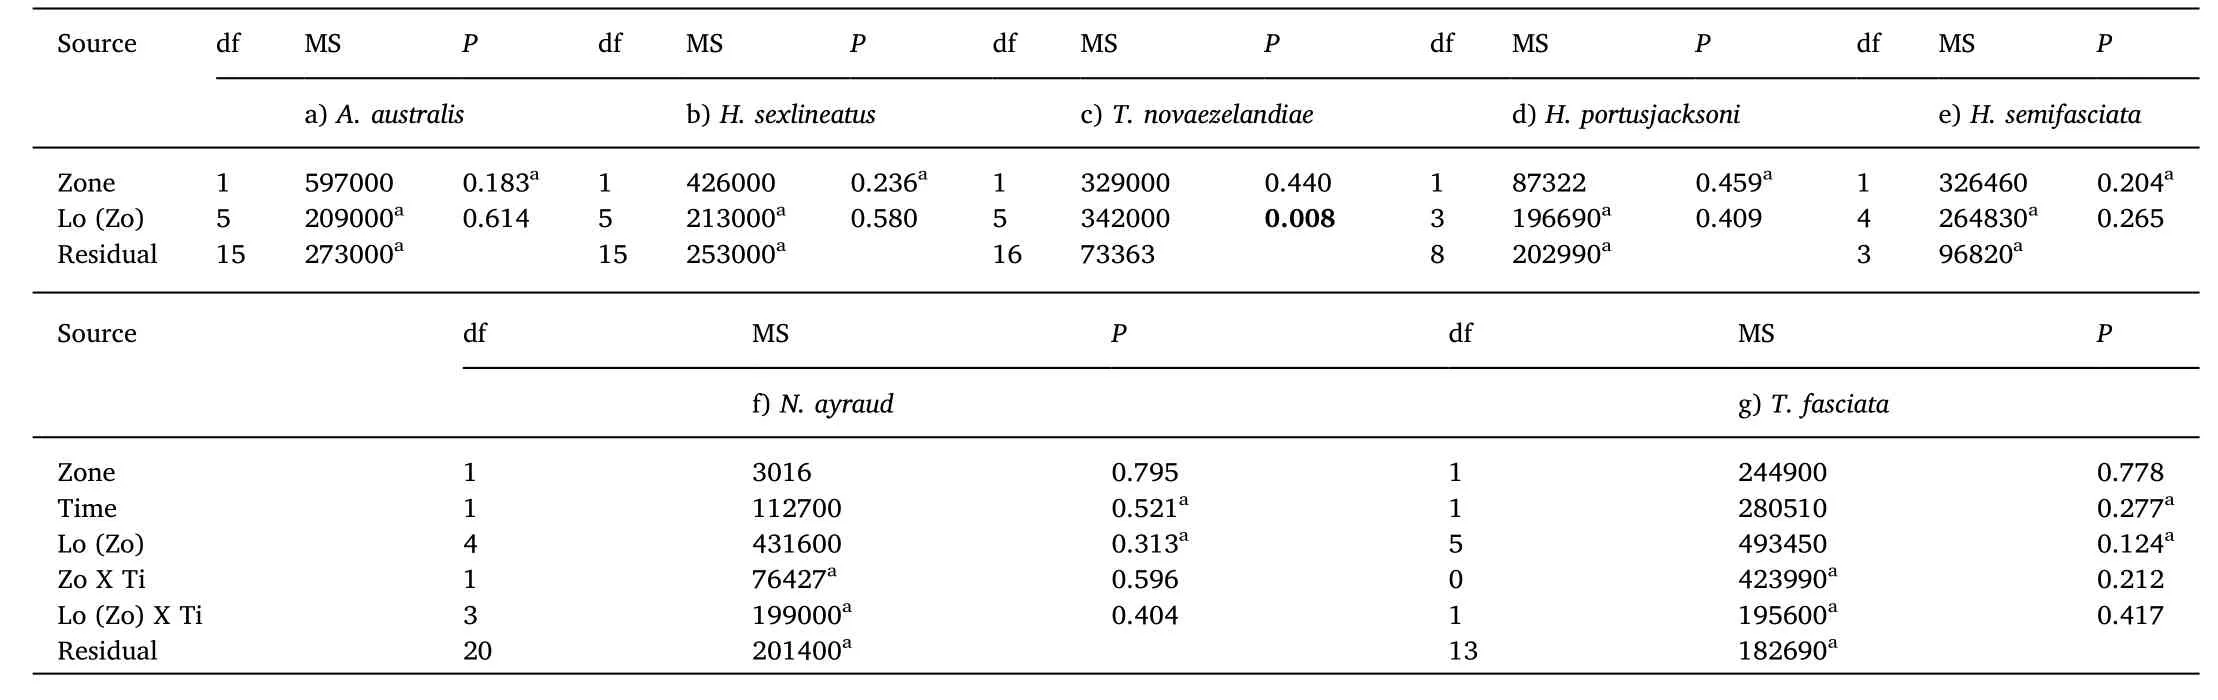
Table 3A comparison of the time of first arrival(T1st)of common fish species in seagrass in Sanctuary Zones and Habitat Protection Zones.Three-way asymmetrical Permanova results(using Euclidean Distance)for T1st of seagrass fish species found in>20% of samples:a)Acanthopagrus australis,b)Helotes sexlineatus,c)Trachurus novaezelandiae,d)Heterodontus portusjacksoni,e)Haletta semifasciata,f)Nelusetta ayraud,and g)Trygonorrhina fasciata during September 2012 and January 2013 across 8 locations in Jervis Bay,Australia.Data for all taxa are untransformed.P-values in bold writing represent significant tests.
Fig.7.Aerial photograph of the mooring area at Callala Bay(located within Jervis Bay)showing the extent of seagrass loss as a result of mooring damage.As part of the current study,fish assemblages were sampled here using BRUVs in August 2010,September 2012,and January 2013.Photograph by Mark Fackerell(NSW DPI 2019).
Our study revealed that several species may exhibit consistently higher abundances in certain seagrass beds in Jervis Bay through time.For example,the consistency in abundance estimates ofHeterodontus portusjacksoni(Port Jackson Shark)andTrygonorrhina fasciata(Eastern Fiddler Ray)at certain locations across sampling periods suggests that these locations may provide important habitat for food,shelter,breeding,or as nursery sites within Jervis Bay.Furthermore,these consistent patterns may indicate that there are potential seascape influences on these fish assemblages within seagrass;for example,the size of the seagrass patches,their continuity and shape,and their distance from rocky reefs.The current study was not designed to test hypotheses about seascape patterns,but this may be a valuable potential area of research(e.g.McNeill&Fairweather,1993)–as it has been for rocky reef fishes within the same embayment(Rees,Knott,&Davis,2018;Swadling,Knott,Rees,&Davis,2019).Also,the consistent presence of these taxa at specific locations suggests that they may be resident in these areas(i.e.are site attached)or show site fidelity(i.e.return regularly to these areas).In particular,H.portusjacksoniwere significantly and consistently more abundant at Cabbage Tree Point,Orion's Beach,and Murray's Beach.This corresponds with research carried out by Powter and Gladstone(2008a&2009)and Bass et al.(2017)in which seagrass meadows at Murray's Beach and Orion's Beach were recorded as an important breeding and nursery ground for Port Jackson Sharks in Jervis Bay;and also suggests that Cabbage Tree Point may also be important for this species.A notable reduction inH.portusjacksoniindividuals during January 2013 compared with August 2010 and September 2012 is in line with migratory patterns and usage of the Bay for breeding activities(Bass et al.,2017;Powter&Gladstone,2008b).Considering the low fecundity and late maturity of this species,these data provide valuable information for the future conservation and management ofH.portusjacksonipopulations in Jervis Bay and underscore the potential importance of seagrass habitats for this species(Powter&Gladstone,2008b).
We detected only small numbers of squid on BRUVs and thus we were unable to provide a reliable assessment of their abundance in notake marine reserves and fished areas.Similarly,Whitmarsh et al.(2014)observed very low numbers of squid whilst also using BRUVs in seagrass,indicating alternative sampling methods may be more suitable for this particular species.However,significant increases in squid abundance and recruitment have been detected between open and closed fishing areas elsewhere(Moltschaniwskyj,Pecl,&Lyle,2002;Pecl,Tracey,Semmens,&Jackson,2006),suggesting a worthwhile study for this region in future.
Importantly,no-take marine reserves provide significant protection for seagrass meadows where even small-scale development can cause irreparable damage(Fyfe&Davis,2007;Meehan&West,2000).With potential future increases in development and fishing pressure in Jervis Bay,our study provides important baseline data from which to monitor fish assemblages between no-take marine reserves and fished areas in seagrass,particularly as our oceans change.This will aid policy-makers by providing an indication of the ecological responses of fish populations to conservation and fisheries management strategies.
Acknowledgments
This work was supported by Jervis Bay Marine Park(JBMP)and the Centre for Sustainable Ecosystem Solutions,University of Wollongong.We thank Ian Osterloh,Adrian Ferguson,Mathew Rees,Lachlan Fetterplace,Allison Broad,and Mark Fackerell for their assistance in the field and with video analyses.We are also grateful for the ongoing support of Matt Carr(JBMP).All research carried out in this study was in accordance with ethics approval number UOW AE12/07r15 and the Australian Code of Practice for the Care and Use of Animals for Scientific Purposes(2004).This is contribution#321 from the Ecology and Genetics Group at the University of Wollongong.The authors declare no con flicts of interest.
Appendix A.Supplementary data
Supplementary data to this article can be found online at https://doi.org/10.1016/j.aaf.2019.10.004.
 Aquaculture and Fisheries2020年5期
- Aquaculture and Fisheries的其它文章
- Assessment of faunal communities and habitat use within a shallow water system using non-invasive BRUVs methodology
- Assessing potential protection effects on commercial fish species in a Cuban MPA
- Estimation of age and growth and mortality parameters of the sea cucumber Isostichopus fuscus(Ludwig,1875)and implications for the management of its fishery in the Galapagos Marine Reserve
- The role of marine protected areas in sustaining fisheries: The case of the National Park of Banc d’Arguin,Mauritania
- Mapping fisheries hot-spot and high-violated fishing areas in professional and recreational small-scale fisheries
- Fisher's perceptions about a marine protected area over time