
Variation characteristics of evaporation in the Gulang River Basin during 1959-2013
2020-09-24 05:53TingTingWangJianGuoLiZongXingLi
TingTing Wang,JianGuo Li,ZongXing Li
1.School of Economics and Management,Lanzhou Jiaotong University,Lanzhou,Gansu 730070,China
2.Northwest Institute of Eco-Environment and Resources,Chinese Academy of Sciences,Lanzhou,Gansu 730000,China
3.Key Laboratory of Ecohydrology of Inland River Basin,Chinese Academy of Sciences,Lanzhou,Gansu 730000,China
ABSTRACT
Keywords:Gulang River Basin;evaporation;abrupt changes;wavelet analysis
1 Introduction
Evaporation is an important part of the global hydrological cycle (Petersonet al., 1995; Rodericket al., 2007).The amount of evaporation directly affects surface heat and water balance.Meanwhile, evaporation can reduce the conversion of radiation to sensible heat, increase air humidity, raise the lowest temperature and decrease the highest temperature, all of which regulates regional climate.Thus, evaporation is of great significance to human activity and water resource management in arid regions (Wang and Qin,2017).Numerous observational studies have found that evaporation is mainly affected by temperature factors, followed by cloudiness, solar net radiation, wind speed and other factors(Liuet al.,2013).
Evapotranspiration in a river basin can represent the overall trend of water surface evaporation.Therefore,it is an important indicator of hydrology research and water resources planning.At present, numerous researchers have carried out extensive studies on river evaporation in China,mainly in the Yangtze River Basin (Zhanget al., 2005; Suet al., 2004; Luet al.,2019) and the Yellow River Basin (Qiuet al., 2003;Ren and Guo, 2006; Zenget al., 2007; Xuet al.,2018).However, climate change in inland river basins is always a research focus in the world.Various scholars have studied evaporation in the Tarim River Basin and Heihe River Basin (Huet al., 2005; Liaoet al.,2015).As the third largest inland river basin in China,Shiyang River is located in the hinterland of the mainland.It belongs to a continental temperate arid climate which has a short summer with high temperature and a long cold winter.It has large annual temperature differences,less precipitation and strong evaporation.The ecosystem of Shiyang River is fragile,which faces numerous social problems such as a dense population,the highest development and utilization of water resources and the prominent contradiction of water use, which aggravate the burden of the ecosystem.The Gulang River in this study is located in the eastern branch of the Shiyang River.In recent years,numerous researchers have reported the water resources and ecological environment of the Shiyang River Basin (Bai and Liu, 2005; Guo and Li, 2006;Ren and Yang, 2007; Yaoet al., 2009; Zhai and Feng,2011; Zhouet al., 2012; Zhang and Li, 2016; Qiet al.,2019), but little systematic study has been carried out on the Gulang River Basin.This basin is a typical semiarid alpine basin, and can represent the climate, soil and vegetation type of the upper reaches of the Shiyang River Basin.In addition, observation data in the Gulang River Basin are comprehensive,and the meteorological stations cover both higher and lower elevation zones.Thus,the Gulang River Basin is an ideal region for studying the variation characteristics of evaporation in the upper reaches of the Shiyang River Basin.
Variation of hydrometeorological series includes periodic, trend and random variations.(Liuet al.,2010).The longer time scale changes of hydrometeorological elements belongs to the category of gradual climate change, and humans need a certain amount of time to understand and respond to these changes.The shorter time scale changes of climatic factors is called abrupt climate change, usually characterized by sudden warming,cooling,wetting and drying trends at region or larger spatial scales (Wanget al., 2008), with often far-reaching impact on human life and production.In recent decades, precipitation, atmospheric temperature, surface runoff and glacier mass-balance have changed greatly in arid and semi-arid areas.Studies have shown that these changes are a signal for climate transition from warm-dry to warm-wet in Northwest China (Shiet al., 2007).Affected by geographical differences,the change characteristics of the situation may be different at different spatial and temporal scales (Liet al., 2011).Based on observational data of evaporation in the Gulang River Basin, this study used trend analysis, Mann-Kendall test and wavelet analysis to determine the change characteristics and trends of evaporation in the basin, and discuss the climatic characteristics such as periodic and abrupt changes.The aim of this study is to provide a reference for predicting future climate change in the study area, and give a suggestion to the rational utilization of water resources, and the protection and improvement of the ecological environment in the basin.
2 Materials and methods
2.1 Study area
Gulang River is located in the eastern branch of the upper reaches of Shiyang River, China, which is in the eastern part of Hexi Corridor, the northern slope of the Qinghai-Tibet Plateau and south by the Qilian Mountains (Hu, 2009).The elevation of the outlet of Gulang River is 2,030 m and the highest point in the basin is 4,300 m.It is a typical arid and semi-arid area,located inland far from the sea,and under the influence of terrain and elevation.The climate is characterized by long-term high temperature and extreme drought, scarce precipitation and large interannual and inter-decadal variations.The meteorological and hydrological stations in the Gulang River Basin are presented in Figure 1.We selected the Wushaoling Automatic Meteorological Station (Wushaoling AMS) as the upstream station and Gulang Automatic Meteorological Station (Gulang AMS) as the downstream station of the Gulang River Basin (Zhanget al.,2014;Wanget al.,2016).
2.2 Data and research methods
Meteorological data were collected from the monthly evaporation(i.e.,pan-evaporation from the Ф 20 small evaporation pan) of Wushaoling AMS and Gulang AMS from 1959 to 2013.Also,quality control and homogenization processing were carried out in order to ensure the comparability of evaporation data of the two stations(Li and Yan,2009).In this study,four seasons were divided as follows: spring in March to May, summer in June to August, autumn in September to November and winter in December to next February.Considering the characteristics of precipitation in the study area, June to September was defined as wet season, and other months as dry season (Menget al.,2012).
In this study,the linear regression method was used to analyze the trend of evaporation.When the slope of linear equation was greater than zero, it represented an upward trend and if the slope was less than zero, it was a downward trend (Yaoet al., 2009).The fluctuation of the anomaly curve was used to reflect the increase and decrease of evaporation in the basin,and the trend of the cumulative anomaly curve can reflect the increase and decrease of evaporation over time.
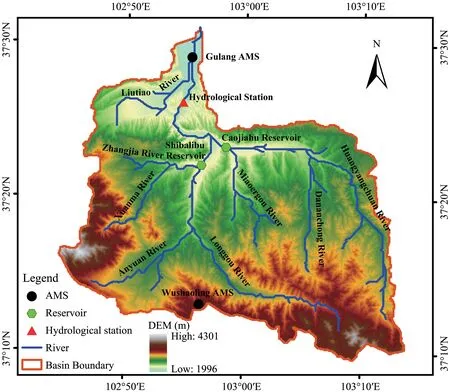
Figure 1 Meteorological and hydrological stations in the Gulang River Basin
The Mann-Kendall (M-K) test method is widely used to test the significance of trends and assess the monotonic trends in meteorological and hydrologic series over major rivers (Liet al., 2011; Shenget al.,2013;Cai,2018;Song,2018;Chenget al.,2019).For the time seriesxwithnsample, an order columnSkis built as follows:
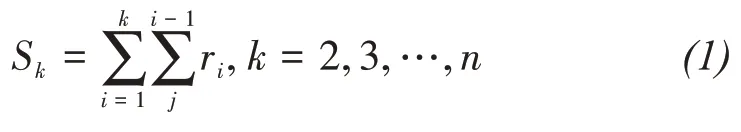
where
whereSkis the accumulated value when number in theimoment is greater than the value ofj,kis the order column number.
Satistics of the sequence are defined under the assumption of random independent time series:

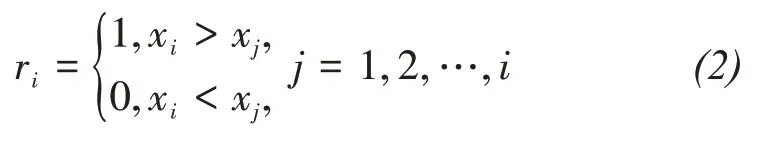
whereUF1=0, andE(Sk) and Var(Sk) presents the value of average and square deviation,respectively:
WhenUFiis positive, it indicates that the sequence is on the upward trend; otherwise, it shows a downward trend,and the larger the absolute value,the more significant the change trend of the sequence.
The process is repeated in reverse order of time seriesxsimultaneously.UFk= -UBk(k=n,n- 1…1),UB1=0.The intersection points ofUFandUBlocated between their confidence intervals could be considered as the occurrence time of mutations.
In addition, wavelet analysis was used to identify the periodic variation of evaporation sequence.
3 Results and Discussion
3.1 Interannual variation of evaporation
Annual evaporation in the Gulang River Basin ranged from 1,400 mm to 2,000 mm with an average of 1,760.78 mm in 1959-2013 (Figure 2).The maximum annual evaporation of 1,967.00 mm was in 1965 and the minimum of 1,402.60 mm in 1967.The interannual variation trend was fitted by the equation,y=0.426x+845.20, that means that annual evaporation increased with a rate of 4.26 mm/10a from 1959 to 2013.Average evaporation of the Gulanghe River Basin show a downward trend with a rate of -21.19 mm/a from 1959 to 1969,and then a downward trend,but the rate slowed down to -7.63 mm/a from 1970 to 1979.However,the evaporation increased from 1980 to 1989,but the rate was relatively small,which was 2.42 mm/a and the average annual value was 1,603.43 mm.Afterwards, the evaporation continued to increase,with a rate of 12.34 mm/a from 1990 to 1999 and an average evaporation of 1,720.93 mm.From 2000 to 2013, the rate changed to a decreasing trend, with a rate of -1.55 mm/a and an average evaporation of 1,732.73 mm.On the whole,annual evaporation experienced the trend of decrease-increase-decrease in the Gulang River Basin.
The cumulative anomaly curve reflected a longterm change trend of evaporation.From Figure 3 the annual evaporation anomaly was at a turning point in 1966 and 1997.Before 1966, the evaporation was at a high level, with more positive anomaly years, and the only negative anomaly occurred in 1964.The highest value appeared in 1965, with an evaporation amount of 1,967.00 mm and anomaly value of 276.22 mm.From 1967 to 1986, the negative anomaly was dominant.The maximum negative anomaly appeared in 1967, which was -288.18 mm.Positive and negative anomalies fluctuated from 1987 to 1996.After 1997,it turned to positive anomaly, and the maximum value appeared in 2001.The turning point of the cumulative anomaly appeared in 1979.Before that, the cumulative anomaly remained positive with the maximum of 1,063.67 mm appeared in 1966.Afterwards, it turned to negative anomaly, and approached zero anomaly again in 2013.From the analysis of Figures 2 and 3,we can see that evaporation show obvious fluctuation in the Gulang River Basin over the past half century.From 1960s to 1980s, evaporation shows a downward trend,and afterwards an upward trend.

Figure 2 The variation trend of evaporation in the Gulang River Basin during 1959-2013

Figure 3 Anomaly of evaporation in the Gulang River Basin
3.2 Seasonal variation of evaporation
There is a distinct difference among seasonal variation of evaporation in the Gulang River Basin(Figure 4).In spring and autumn,the evaporation tended to decrease, while in other seasons it shows an upward trend in varying degrees.The evaporation was downward in spring, in which the linear trend line equation wasy=-0.139x+797.55,suggesting that evaporation decreased by 1.39 mm/10a.The average evaporation was 498.02 mm from 1972 to 1994, which was 23.03 mm lower than the multi-year average.In the late 1990s,spring evaporation shows a general increase and a period of fluctuation, which indicates that spring evaporation experienced an "increase-decrease-increase"process (Figure 4a).The evaporation in autumn also shows a downward trend.The linear trend line equation wasy=-0.090x+515.63, and suggests that evaporation decreased by 0.9 mm/10a.The downward trend was not obvious in autumn compared to the spring,and the whole trend shows a fluctuation(Figure 4c).
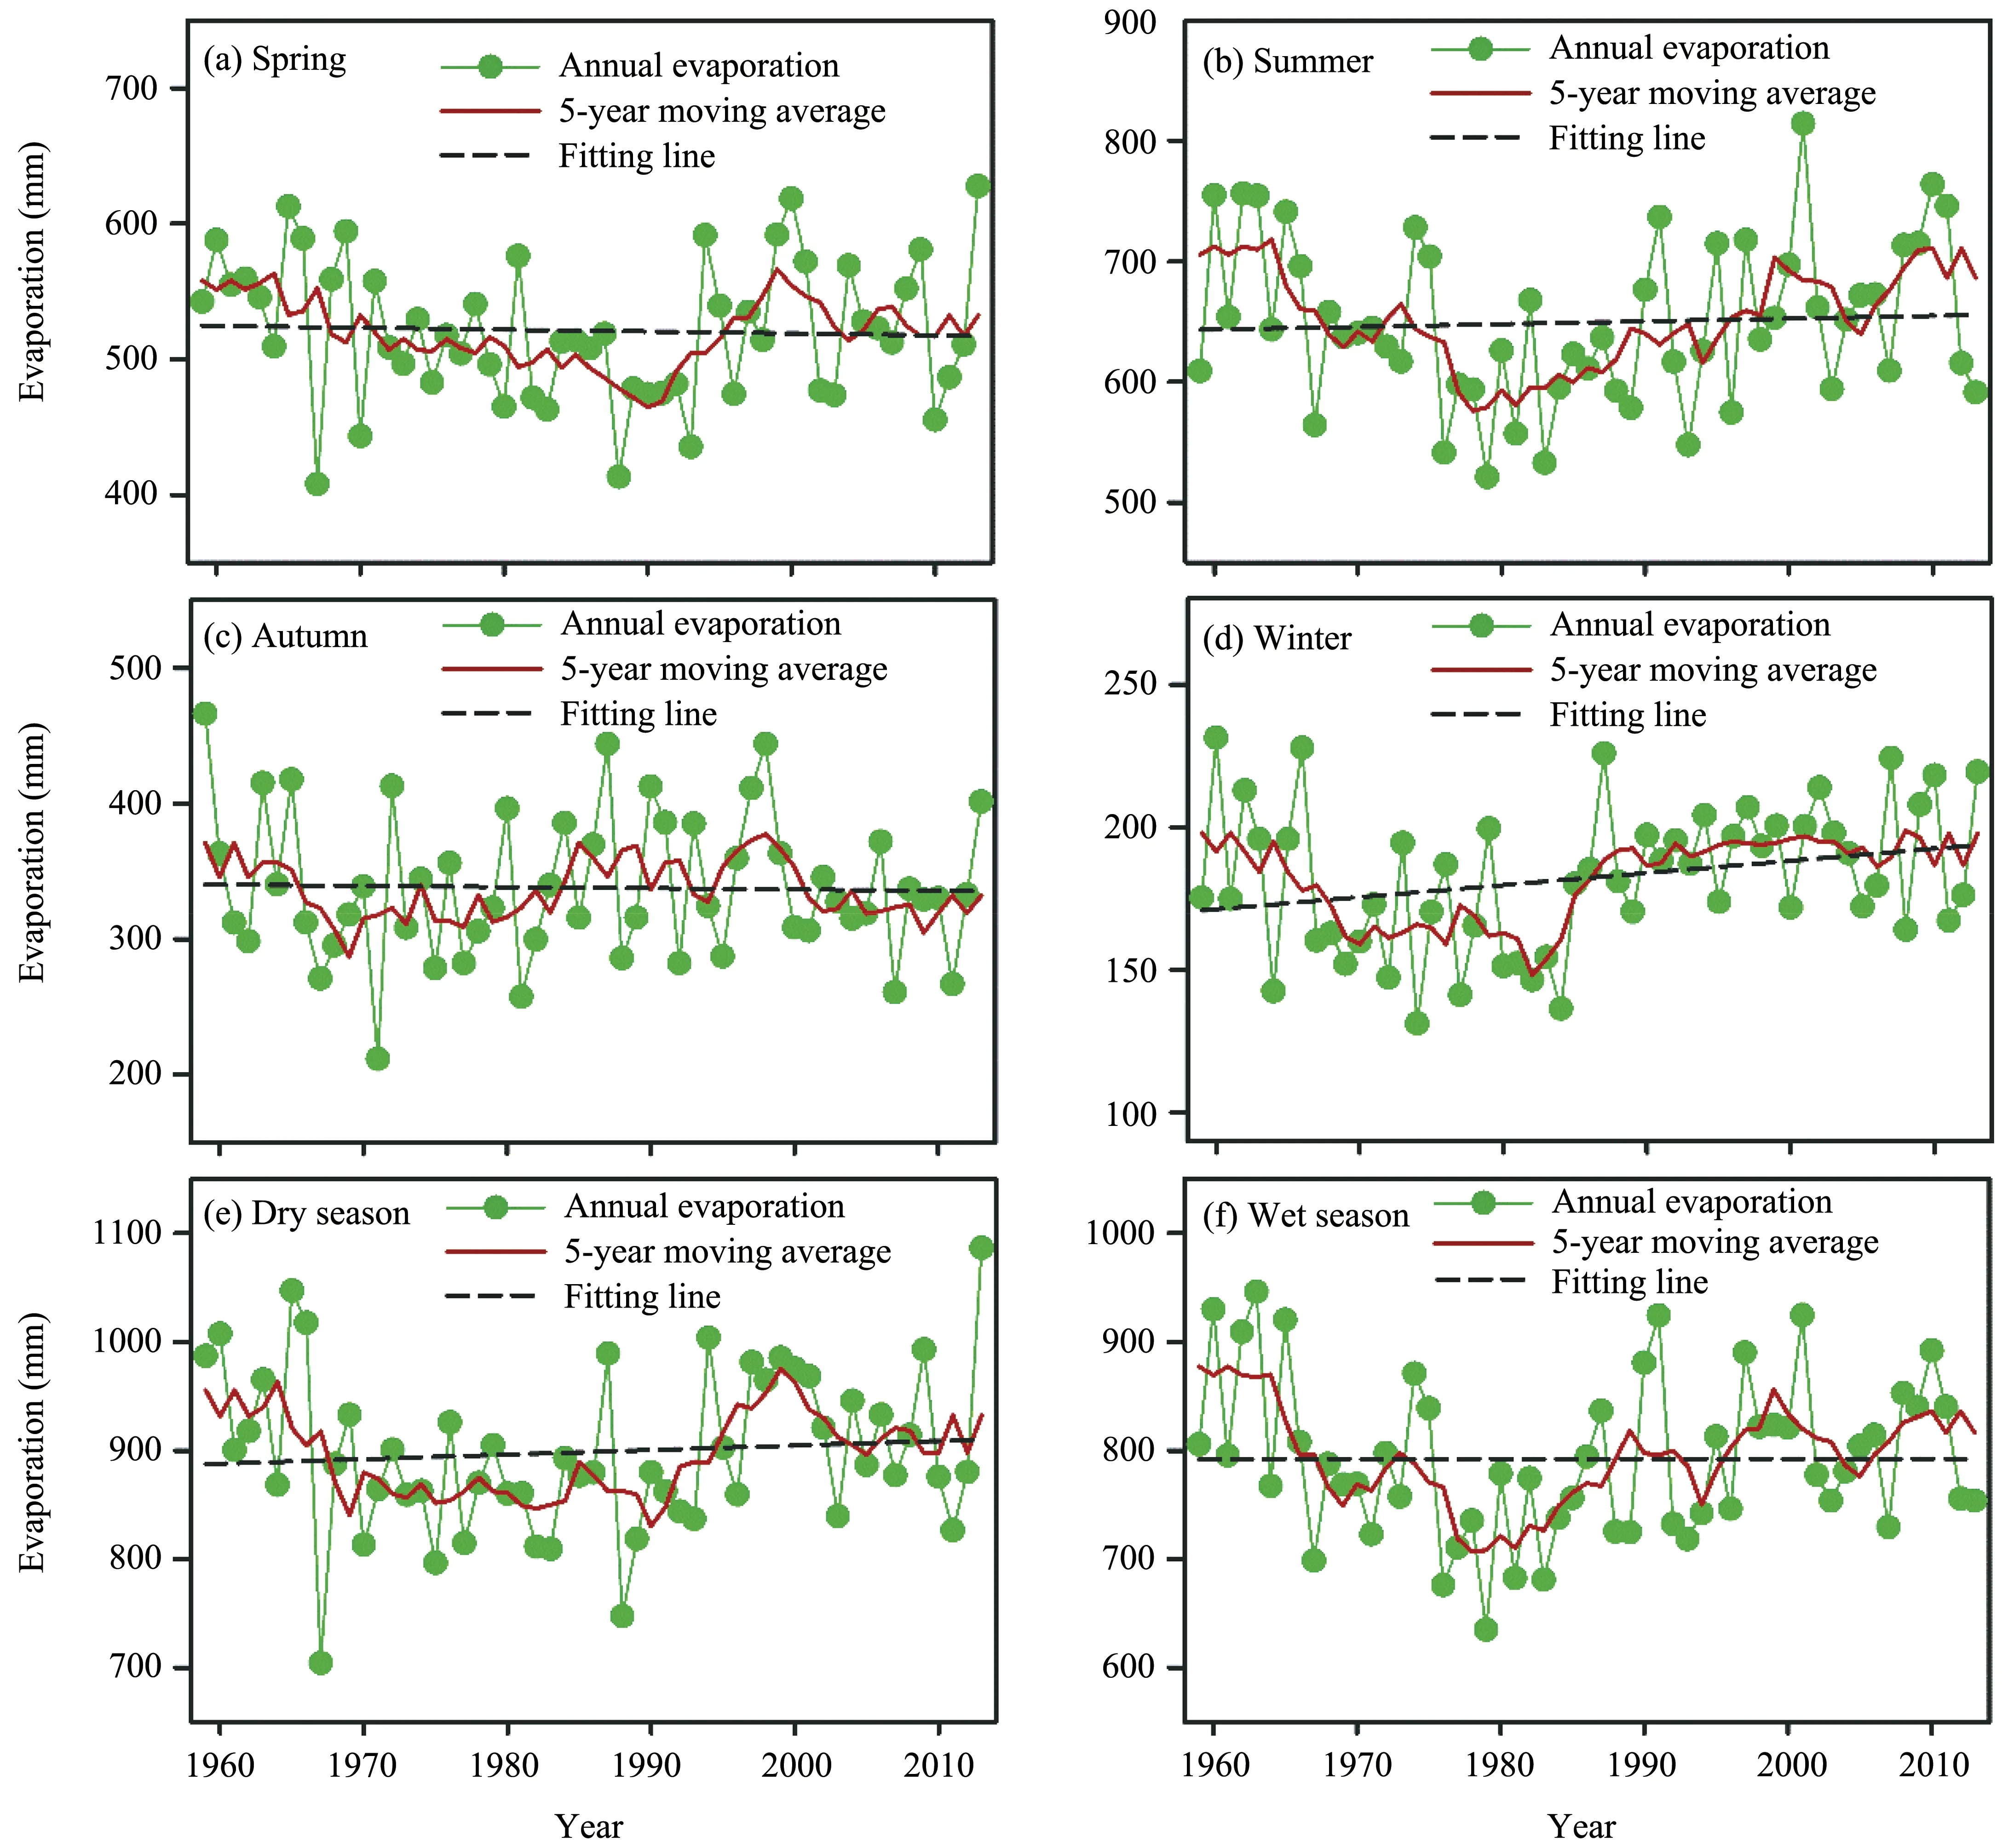
Figure 4 Seasonal variation of evaporation in the Gulang River Basin
Evaporation shows an upward trend in summer and winter, with linear regression equations ofy=0.230x+193.17 andy=0.425x-661.20,respectively.This suggests that evaporation increased by 2.3 and 4.25 mm/10a in summer and winter, respectively.Also, the average evaporation in summer was 590.96 mm from 1976 to 1989, which was 58.46 mm lower than the multi-year average.From Figure 4b, it can be seen that evaporation in summer has undergone a process of firstly decreased and then increased.The increased evaporation was more obvious in winter than in summer, especially after 1986, which was 11.17 mm higher than the multi-year average (Figure 4d).Evaporation also shows an increasing trend in dry season (Figure 4e)and wet season (Figure 4e).The linear regression equations werey=0.419x+66.34 andy=0.007x+778.81,respectively, suggesting that evaporation increased more obvious in dry season than wet season.
Based on the aforementioned analysis, we can conclude that increased evaporation in the Gulang River Basin is mainly induced by increase of evaporation in dry season, especially in winter.The main reason is that climate change in this region has led to an increase of temperature in dry season which is more obvious than that in wet season,especially in winter,where temperature increases several times as much as in summer.This leads to an increase in energy used to drive evaporation in the Gulang River Basin, making evaporation increase more evident in dry season than in wet season.
3.3 Abrupt analysis of evaporation
Abrupt climate change refers to the transformation of climate elements from one distribution state to another and the maintenance of lasting changes(Zhang and Shi, 2009).The Mann-Kendall test of evaporation in the Gulang River Basin in different seasons was carried out.UF was the M-K positive sequence characteristic curve of climatic elements sequence and UB was the reverse sequence characteristic curve, and the confidence interval was the critical line of significant levelp= 0.05.From Figure 5 we can see that the spring evaporation changed abruptly in 2008.Based on the confidence test of 0.05, evaporation increased by 16.26 mm after an abrupt change compared with before the change.Summer evaporation also changed abruptly in 2008.The evaporation before the abrupt change was 46.43 mm less than that after the abrupt change.In 1986 and 1999, there were two sudden changes in autumn evaporation.After the first mutation, evaporation decreased by 139.31 mm,and after the second mutation, evaporation increased by 134.98 mm.Winter evaporation changed abruptly in 1994.After the abrupt change, evaporation increased by 18.22 mm compared with before the abrupt change, which passed the 95% confidence test.Evaporation in the dry season changed abruptly in 2008 and passed the confidence test of 0.05.After the abrupt change, evaporation increased by 34.21 mm compared with before the abrupt change.The wet season evaporation changed abruptly in 2006 and passed the 95% confidence test.The evaporation before the abrupt change was 49.02 mm less than that after the abrupt change.
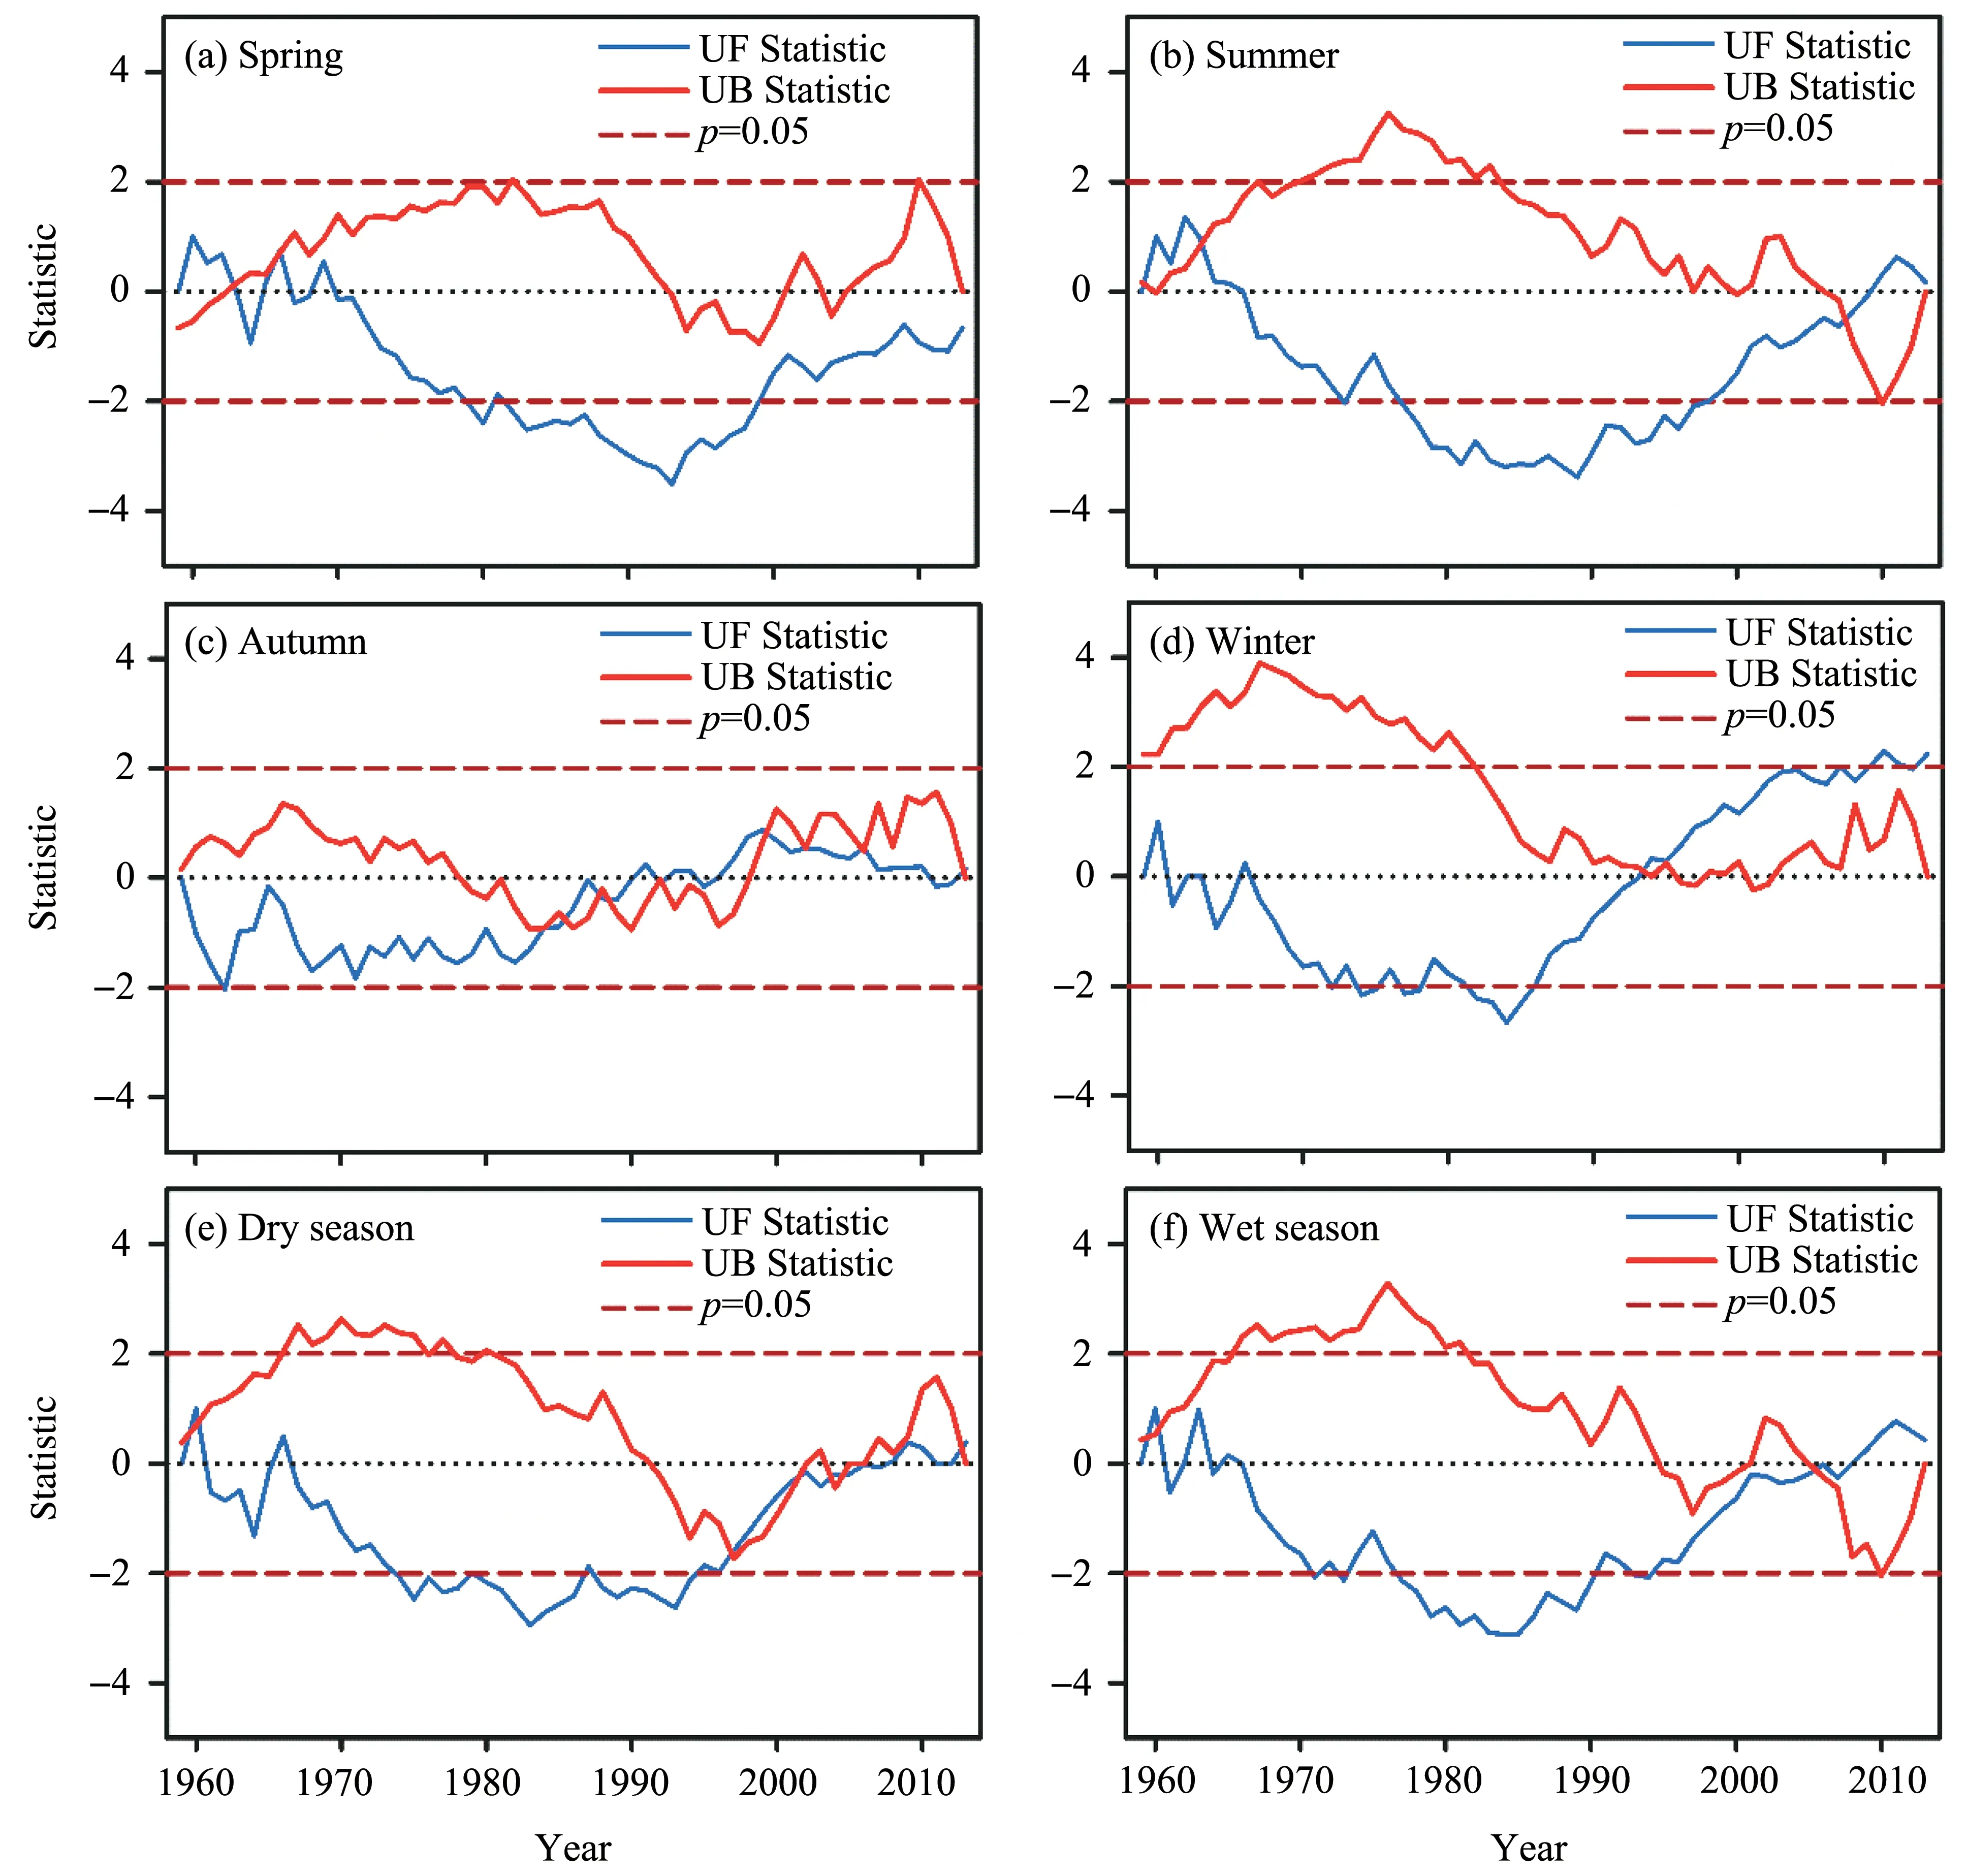
Figure 5 Abrupt change of evaporation from 1959 to 2013 in the Gulang River Basin
3.4 Periodic variation of evaporation
As presented in Figure 6, evaporation in spring varied with a short period of 4 to 8 years and a long period of about 25 years.From 1959 to 2013, spring evaporation changed from positive phase to negativephase in 1970, 1988 and 2005.In 1978, 1995 and 2012, spring evaporation changed from negative phase to positive phase (Figure 6a).It is speculated that spring evaporation will continue to increase in the next 7-10 years after 2012.During 1985-2013,the four-year and eight-year periods of spring evaporation changed significantly, and experienced multiple cycles with different phases.Summer evaporation shows periodic variations of about 5 and 12 years.From 1959 to 2013, there were 6.5 cycles in the phase of'+'and'-',in which the summer evaporation of 1961, 1973, 1982, 1991, 2000 and 2009 changed from relatively small to relatively large, and that of 1967, 1978, 1985, 1995, 2003 and 2012 changed from relatively variable to relatively small.However, summer evaporation in 1985-2013 changed significantly in five years, and experienced seven cycles in the phase of '-' and '+' (Figure 6b).From the five-year cycle and 12-year cycle, summer evaporation in the next 5-10 years was relatively small.Autumn evaporation varied periodically for about 3, 8,15 and 25 years.In 1957-1995, the cycle obviously changed in about three years, and in 1975-2000, the cycle obviously changed in about 15 years.The period of about 8 years show a good cycle change in the whole period of 1959-2013,which experienced 9 cycles of the phase of '+' and '-'.In terms of the 8-year cycle and 25-year cycle, autumn evaporation will be relatively large in the next 5-10 years (Figure 6c).There are periodic variations of evaporation in winter for about 3, 7, 15 and 20 years.From 1962 to 2005, the period of 15 years and 20 years obviously changed, and experienced three cycles of '+' and '-'phase, respectively.From the seven-year cycle, winter evaporation experienced nine cycles in the phase of '+' and '-' during 1959-2013, and the evaporation will show an increasing trend in the next 7-10 years(Figure 6d).
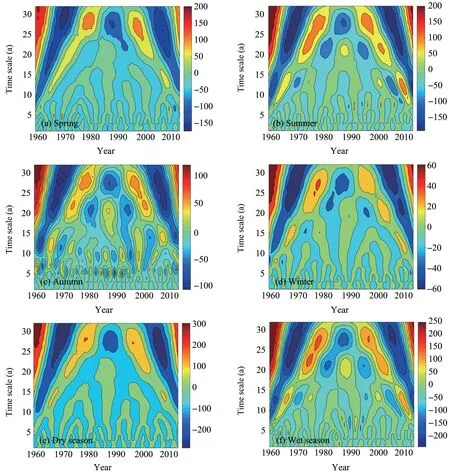
Figure 6 Cycle change of evaporation in the Gulang River Basin
As presented in Figure 6, evaporation in the dry season varies periodically for five, twelve and eighteen years.From 1959 to 2013, there were four cycles in the phase of '+' and '-'.Evaporation in the dry seasons of 1962,1975,1988 and 2005 changed from relatively large to relatively small, and in 1968, 1982,1995 and 2009, from relatively small to relatively large.There were 4.5 cycles in the phase of'-'and'+',which superimposed 12 years or so.Based on these results, it is speculated that evaporation in the dry season will increase relatively in the next 10 years (Figure 6e).Evaporation in the wet season varied over a long period of 18 years and 25 years,and the short period varied more frequently in about 5 years.From 1959 to 2013, wet season evaporation shows a cyclical change of about 18 years, and experienced 4.5 cycles in the phase of '+' and '-'.Evaporation in 1967,1977, 1990 and 2006 changed from relatively large to relatively small, and in 1973, 1988, 2000 and 2012 from relatively small to relatively large.It can be inferred from the aforementioned data that the wet season evaporation in the next 10 years is relatively small(Figure 6f).
4 Conclusions
The change of pan evaporation in the Gulang River Basin was analyzed in this study based on the linear trend estimation, anomaly and cumulative distance equality method.Also, using the M-K test and wavelet analysis, the periodicity and catastrophe characteristics of pan evaporation in the Gulang River Basin were analyzed.The conclusions are demonstrated as follows:
Evaporation of the Gulang River Basin increased in a fluctuating way, with an average increase rate of 4.26 mm/10a from 1959 to 2013.The overall trend was decrease-decrease-increase-increase-decrease.The trend of cumulative anomaly curve shows that the turning point of annual evaporation occurred in 1979, with an increase in the early stage and decrease in the later stage.The seasonal variation of evaporation in the Gulang River Basin shows a decrease trend only in spring and autumn, while in the other seasons shows an increased trend with varying degrees, especially in winter.
Using the M-K test,it was found that the evaporation in spring and summer changed abruptly in 2008.In winter, it changed abruptly in 1994 and the value increased after the abrupt change.In autumn, two abrupt changes were found in 1986 and 1999, showing a trend of increase-decrease-increase, an overall trend of which increased after the abrupt change.Wavelet analysis shows that evaporation will tend to decline over the next 10 years in summer and wet season, while increasing in other seasons.However, because evaporation is affected by numerous geographical and environmental factors,such as climate and hydrology, further research will be needed for an accurate prediction.
Acknowledgments:
The research was funded by the Youth Science Foundation of Lanzhou Jiaotong University (2018026) and the Key Research Program of Frontier Sciences, CAS(QYZDJ-SSW-DQC031).
 Sciences in Cold and Arid Regions2020年4期
- Sciences in Cold and Arid Regions的其它文章
- Dynamic behavior of the Qinghai-Tibetan railway embankment in permafrost regions under trained-induced vertical loads
- Comparison of sampling schemes for spatial prediction of soil organic carbon in Northern China
- Assessing spatial and temporal variability in water consumption and the maintainability oasis maximum area in an oasis region of Northwestern China
- Theoretical expressions for soil particle detachment rate due to saltation bombardment in wind erosion
- Validation of AIRS-Retrieved atmospheric temperature data over the Taklimakan Desert