
Dynamic behavior of the Qinghai-Tibetan railway embankment in permafrost regions under trained-induced vertical loads
2020-09-24 05:53TuoChenZhiJianWuYanHuMuWeiMaJianZhouWang
Tuo Chen,ZhiJian Wu,YanHu Mu,Wei Ma,JianZhou Wang
1.State Key Laboratory for Geomechanics and Deep Underground Engineering,China University of Mining and Technol‐ogy,Xuzhou,Jiangsu 221116,China
2.State Key Laboratory of Frozen Soil Engineering, Northwest Institute of Eco-environment and Resources, Chinese Academy of Sciences,Lanzhou,Gansu 730000,China
3.School of Transportation Engineering,Nanjing Tech University,Nanjing,Jiangsu 210009,China
ABSTRACT
Keywords:permafrost;railway embankment;numerical analysis;dynamic response
1 Introduction
The Qinghai-Tibet Plateau (QTP) is the highest and one of the most extensive ones in the world.With a high elevation, low latitude mountain environment,permafrost accounts for approximately 56% of the total area of the plateau, or 1.3×10⁶km2, easily making it the largest extent of mountain permafrost on earth(Chenget al., 2013).In permafrost regions, the construction and maintenance of infrastructure have traditionally been an engineering challenge (Harriset al.,2009).The Qinghai-Tibet Railway(QTR)is 1,142 km long, of which 546 km traverses through permafrost zones, 275 km is in warm permafrost (-1 to 0 °C in mean annual ground temperature), and 221 km is in ice-rich permafrost (Wuet al., 2006).The key to the successful construction of a railway in such a unique region is the embankment stability.Therefore permafrost protection becomes one of the essential engi-neering design and construction principles.
Permafrost is classified as a "special" soil, which is very sensitive to temperature changes (Arensonet al., 2005).As the unfrozen water content and ice content of frozen soil change continuously with varying temperature, its physical and mechanical properties are inherently unstable and depend on temperature (Liet al., 2008; Xuet al., 2017).Moreover, the fluctuation of dynamic loads,particularly those caused by repeated train loading, can aggravate the variation of permafrost properties (Aksenovet al., 2016).Thus the dynamic behavior of embankment in permafrost regions under train loading alters with seasons (Hazirbaba, 2016).And vibration response and dynamic stability of the embankment induced by train loading have become an increasingly important problem.
The study of dynamic response and the long term stability of railway embankment has been an issue of growing interest in recent years, and many resources have been devoted to explain the impacts of the dynamic loads on embankment stability.Some field experiments were implemented to study the dynamic response of the embankment.For example, Zhu (2009)examined the vibration attenuation of Harbin-Daqing Railway embankment by field measurements; Linget al.(2010) analyzed the dynamic response of track structure in the Beiluhe permafrost region along the QTR by field monitoring; Chenet al.(2014) investigated the vibration response of embankment under train loading in permafrost regions along the QTR via strong-motion recording equipment.Besides field experimental tests, some laboratory investigations were conducted.Shelmanet al.(2014) analyzed the effects of freezing temperatures on the mechanical properties of soil specimens subjected to monotonic and cyclic loading with varying strain rates at different temperatures.Zhuet al.(2011) studied the dynamic behavior of frozen clay through dynamic triaxial experiments in a cryo environment.Linet al.(2018) evaluated the long-term dynamic behaviors of thawed saturated clay by conducting a series of cyclic triaxial tests.Moreover, numerical simulation methods were utilized to study the dynamic responses of embankment in permafrost regions under train loading.Notably, Liet al.(2012) developed an indirect thermal dynamic coupled model and applied it to dynamic response simulations of a QTR embankment subjected to train loading in permafrost regions; Zhanget al.(2016)studied the dynamic stability of a high-speed railway in cold regions and evaluated and predicted the longterm dynamic stability of its embankment.
However, the vibration characteristics of the train itself and the attenuation effects were not entirely clarified in previous studies.Moreover, the vibration transfer process of and the dynamic behavior of the embankment under train loading, particularly their seasonal variations in permafrost regions, were not systematically studied.In this paper, a type of strongmotion equipment was used to record vibration sginals at a typical embankment along the QTR, and the dynamic characteristics of train loading were obtained to determine the in-situ train loading for use in the following simulation.Then nonlinear dynamic finite element analysis, considering the variation of the soil temperature in different seasons, was performed to reveal the dynamic behavior of embankment under the train loading.This study reveals the dynamic transfer characteristics and the influence depth of the dynamic train loading.Moreover, the quantitative effects of the train loading on the dynamic behavior of QTR embankment in permafrost regions are evaluated.
2 Strong-motion tests
2.1 Profile of test embankment
The mainline of the QTR at the Bailuhe River section were chosen as the field test embankments.The Beilu River section of 14 km long located between the Hoh Xil and Fenghuoshan mountains, was built on alluvium and diluvium high plains.It has an arid climate, where the freezing period lasts for seven to eight months, approximately from September to the following April.According to the meteorological data, the annual average temperature of this area is-5.2 °C,the extreme maximum temperature is 23.2 °C,and the extreme minimum temperature is -37.7 °C.Moreover, the permafrost has a mean annual ground temperature ranging from-3.0 °C to-0 °C with abundant thick ground ice near the permafrost table along the entire test section.
A series of strong-motion tests were carried out in the warm season in 2011 at the embankment segments with configurations typical for the QTR, including the traditional, ventilated, crushed/blocked rock embankment,etc.(Chenet al., 2011).For example, Figure 1 shows the configuration of a traditional embankment.This embankment is 3.7 m high and was constructed on a silt clay overelying brownish-red, completely weathered mudstone (Sunet al., 2008).The permafrost table of the field test embankment section was about 2.0 m deep from the ground surface,and the average permafrost temperature was-1.51°C.
2.2 Testing apparatus and observation method
The ETNA strong-motion accelerometers manufactured by Kinemetrics, Inc., Pasadena, California,were used to record the embankment vibraiton responses due to a passing train, as shown in Figure 2.This strong-motion observation instrument contains a digital recorder, a data storage unit, and a global positioning system receiver.The maximum sampling rateof the digitizer is 200 samples/s.Three channels,i.e.,two horizontal -CH1 and -CH2, and one vertical-CH3, were monitor for signals that equal or exceed a programmable trigger threshold.The nominal threshold was set to 0.05% of the full range of 2.0 g (g is the acceleration of gravity, 9.8 m/s2).The recorders were configured to store information for 10 seconds before the trigger threshold is exceeded and for 40 seconds after the trigger ceases to be exceeded.During in-situ strong-motion recording, the direction of-CH3 was perpendicular to the plane of the embankment.Besides, the trigger acceleration was set as 0.98 cm/s2, and the sampling frequency was 200 Hz(a time interval of 0.005 s).
Three instruments, as shown in Figure 1, were installed in different positions of the embankment to capture data for understanding the characteristics of the train-induced embankment vibration.Specifically,one was located on the edge of the ballast on the right shoulder to record the input vibration induced by a passing train, while the other two instruments were at the toes of the right and left embankment slopes to record the embankment responses.The horizontal distance from the shoulder observation point to the right slope toe observation point was 8.2 m, and 14.3 m to the left slope toe observation point.The acceleration waveforms were collected when trains were passing.And the vertical train loads and the vibration at the shoulder and slope toes were presented next.
2.3 Test results
Figure 3 shows the measured acceleration waveforms in a vertical direction at the shoulder of the embankment.The recorded waveform shows obvious rhythmicity,which reflects the features of the train loading,and the peak vertical acceleration was 204.3 cm/s2.
Figure 4a depicts the measured acceleration waveforms in a vertical direction at the slope toes of the embankment.There is an evident attenuation effect when the vibration propagates from the railway shoulder to slope toes.The vertical acceleration was 14.7 cm/s2at the right slope toe, and 10.7 cm/s2at the left slope toe.Figure 4b shows the attenuation rate of the vertical vibration at the slope toes compared with the railway shoulder.As shown in Figure 4b,the attenuation rate of vertical vibration at the right sloe toe is 7.2%,and 5.3%at the left slope,indicating smaller acceleration as well as the attenuation rate at a longer horizontal distance from the tracks.
This paper focuses on the vertical vibration generated by passing trains,as it has the highest peak acceleration.Additionally, the vertical vibration observed at the shoulder of the embankment was assumed to be the vibration of the train itself, which was further used as the input loading in the following numerical simulation for dynamic responses of the embankment.

Figure 3 The measured acceleration waveforms in the vertical direction at the shoulder of the embankment
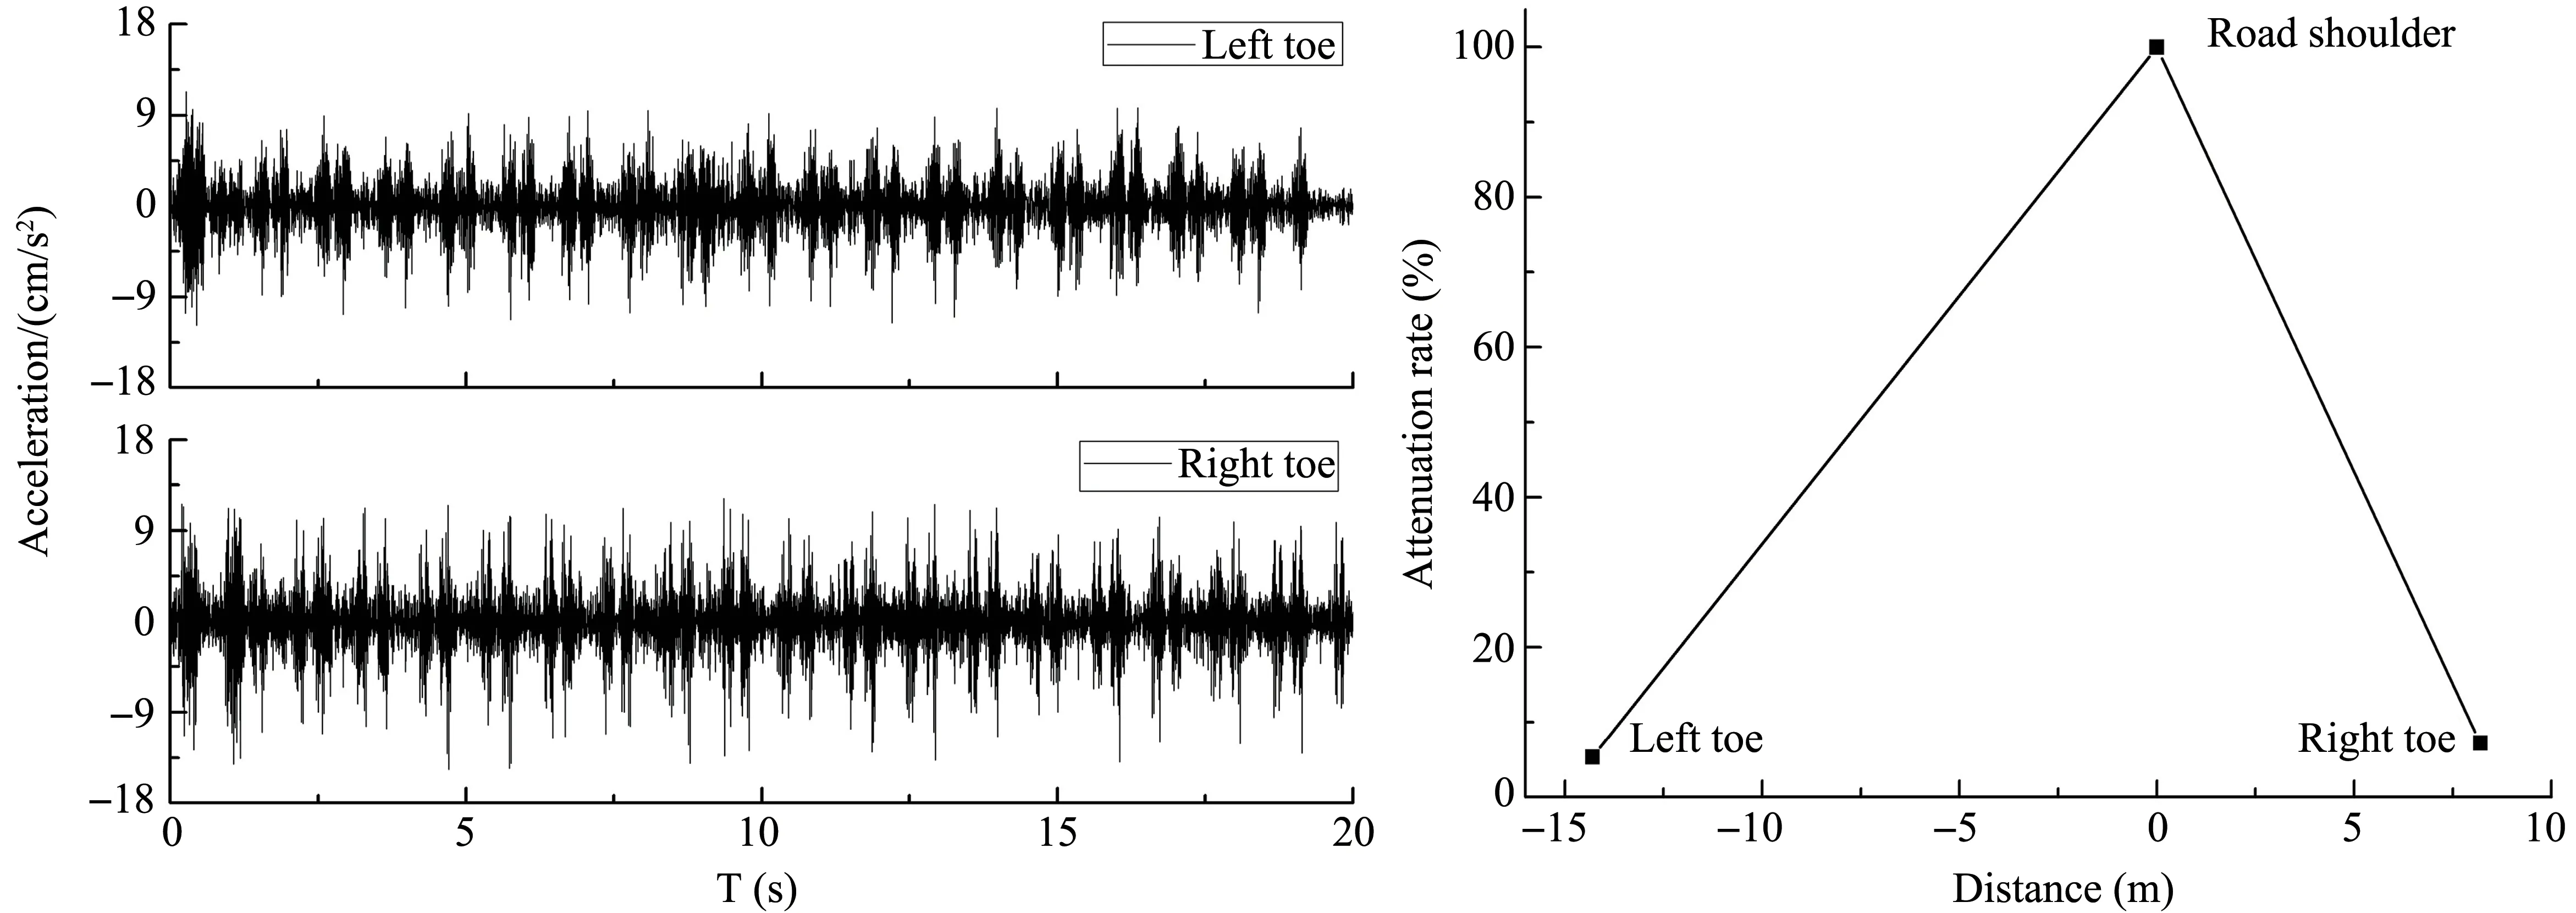
Figure 4 (a)The measured acceleration waveforms at the slope toes,and(b)attenuation of the vertical acceleration
3 Computational model and mechanical parameters
3.1 Kinetic equation
Based on the in-situ strong-motion data, the dynamic response of the embankment was further studied by applying the nonlinear dynamic finite element analysis, and the kinetic equation of the soil seismic response can be expressed as:

whereM,CandKare respectively the mass, stiffness and damping matrices.P(t) refers to external dynamic loading.
3.2 Constitutive equations
Before the soil enters into the plastic-yield state,its stress-strain relation meets Hook's law which can be described as:

where[DT]is the soil elastic matrix related to temperature and unfrozen water content,{ε}is the soil strain and the{σ}is the soil stress.
After the initial shear failure and yielding, the elasto-plastic behavior of the soil needs to be considered.As for any stress increment, the corresponding strain increment can be written as:

where {εe} is the elastic strain; {εp} is the plastic strain; dλis the plastic coefficient;Fis the plastic potential function.
In this paper, the Mohr-Coulomb elastic-plastic yield criterion was used to express the plastic potential function.This criterion assumes that failure occurs when the shear stress at any point in a material reaches a threshold that depends linearly on the normal stress in the same plane.The Mohr-Coulomb yield criterion can be expressed as:
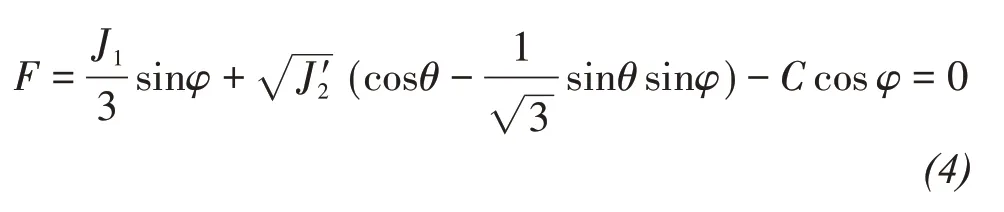
whereJ1is the first stress tensor invariant;J2' denotes the second deviatoric stress tensor invariant, andθis the lode angle.Cdenotes the cohesive strength, andφdenotes the internal friction angle, bothCandφare related to the temperature.
3.3 Numerical model and parameters
Figure 5 shows a two-dimensional finite element analysis model corresponding to the testing embankment,as shown in Figure 1.The average size of the element was about 1m×1m, with refinements within the embankment to minimize the mesh size effects on the numerical results.The soil profile was divided into three layers: the roadbed filling, silty clay layer and mudstone layer, according to the engineering geological conditions.Figure 6 shows the temperature distributions along with the depth of the testing embankment measured in different seasons in 2011.It indicates that the roadbed filling and silty clay layer were frozen in the cold season and then thawed in the warm season, while the mudstone remained frozen year round.To simplify the calculation, the extreme situation, including the warm and cold seasons, were considered.The roadbed filling and active layer were assumed thawed in the warm season but frozen during the cold season.The transient freezing and thawing conditions were not considered in this study.
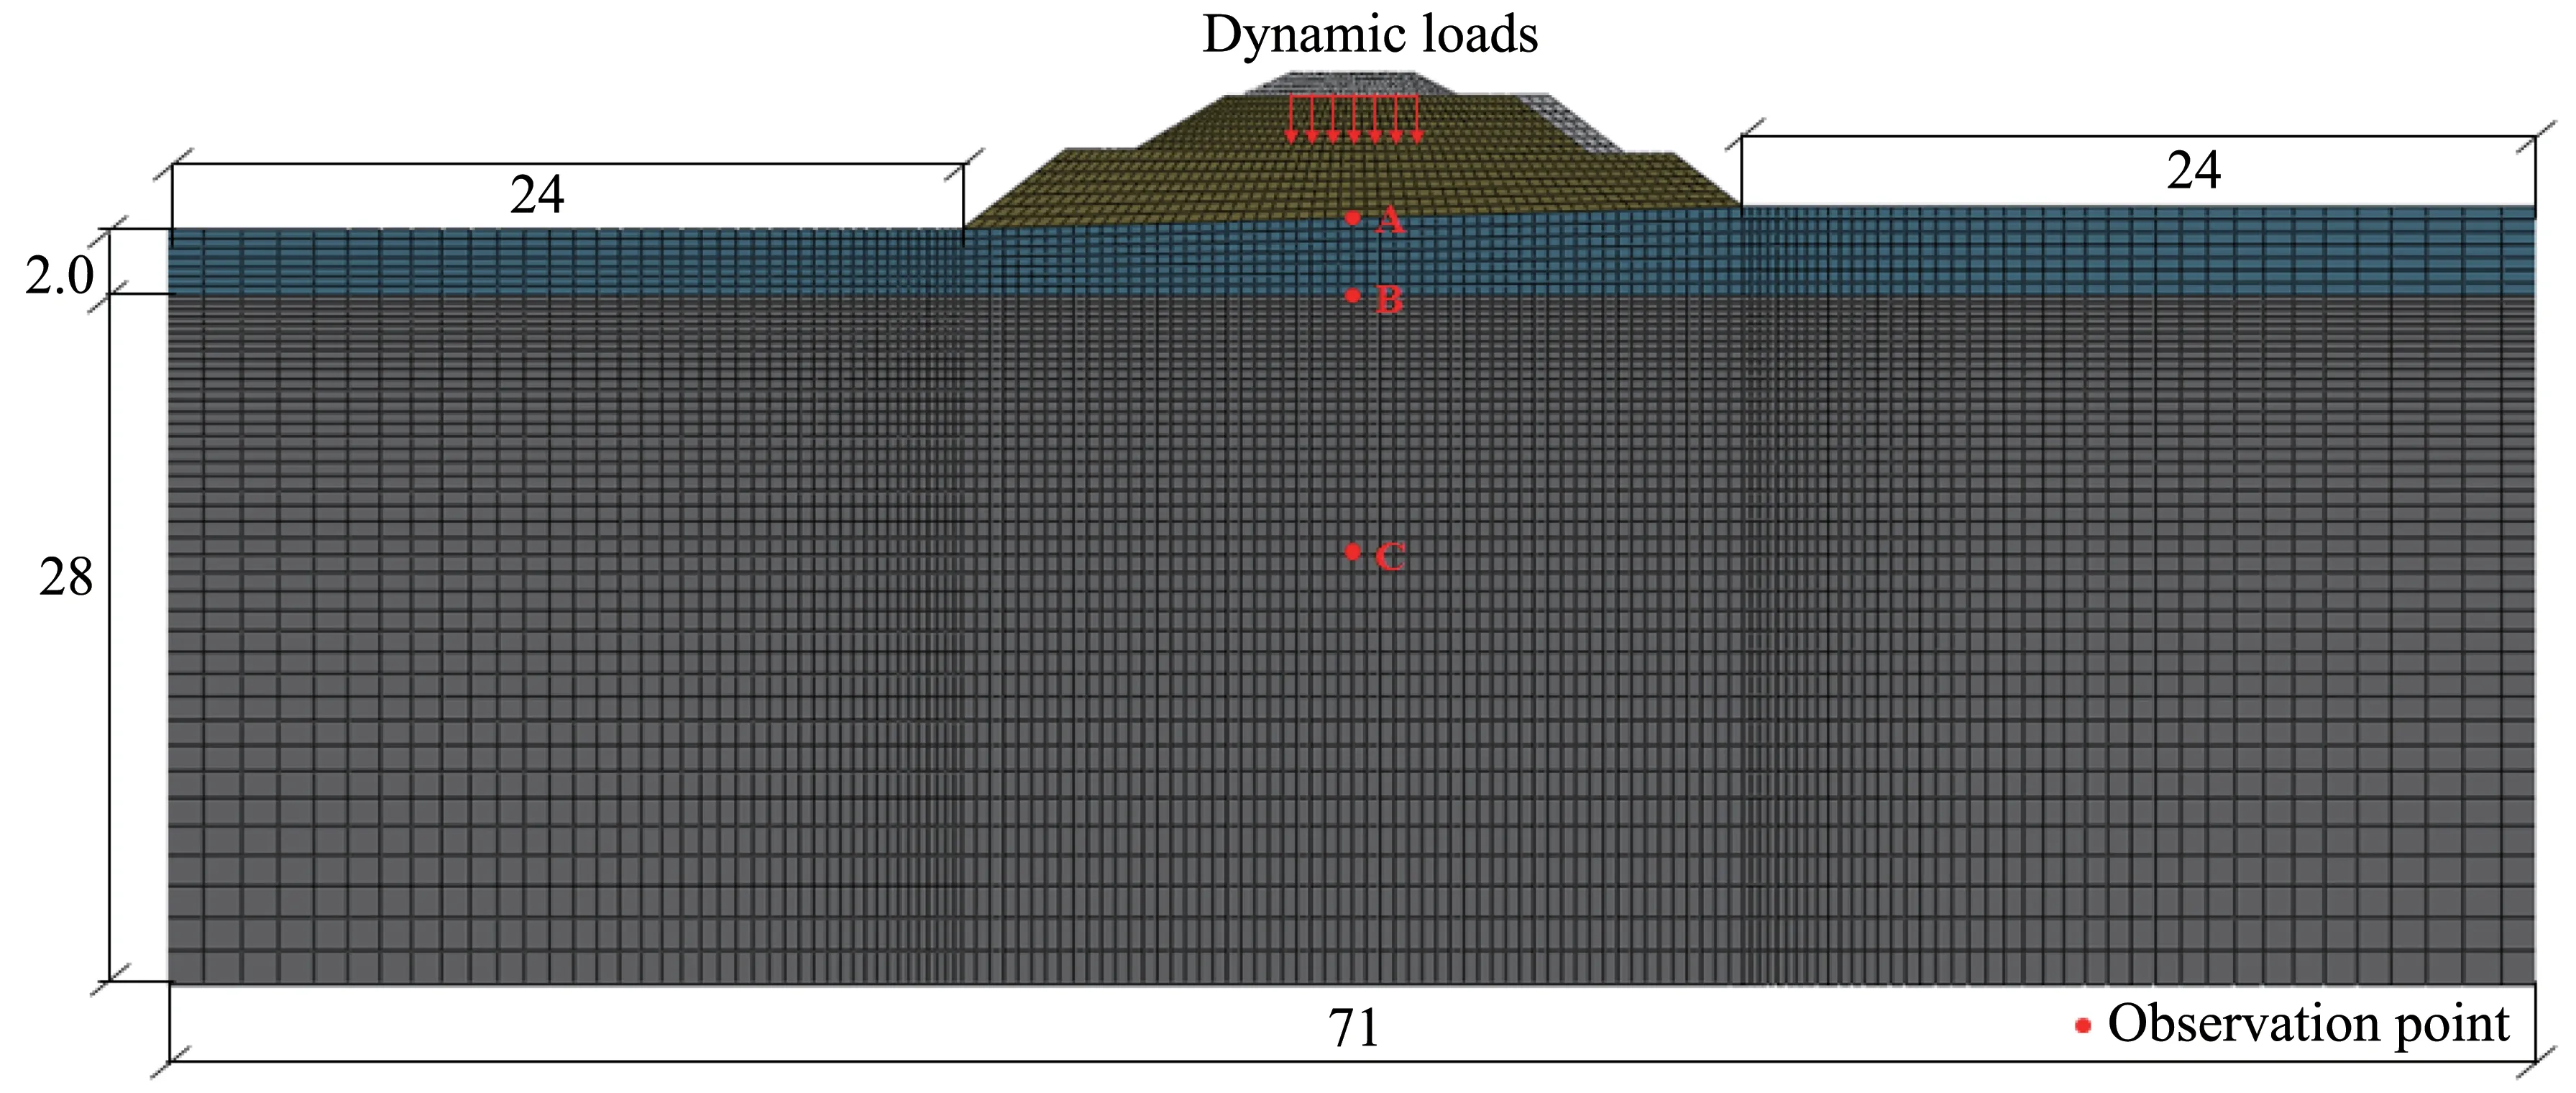
Figure 5 The finite element model of the testing embankment(unit:m)
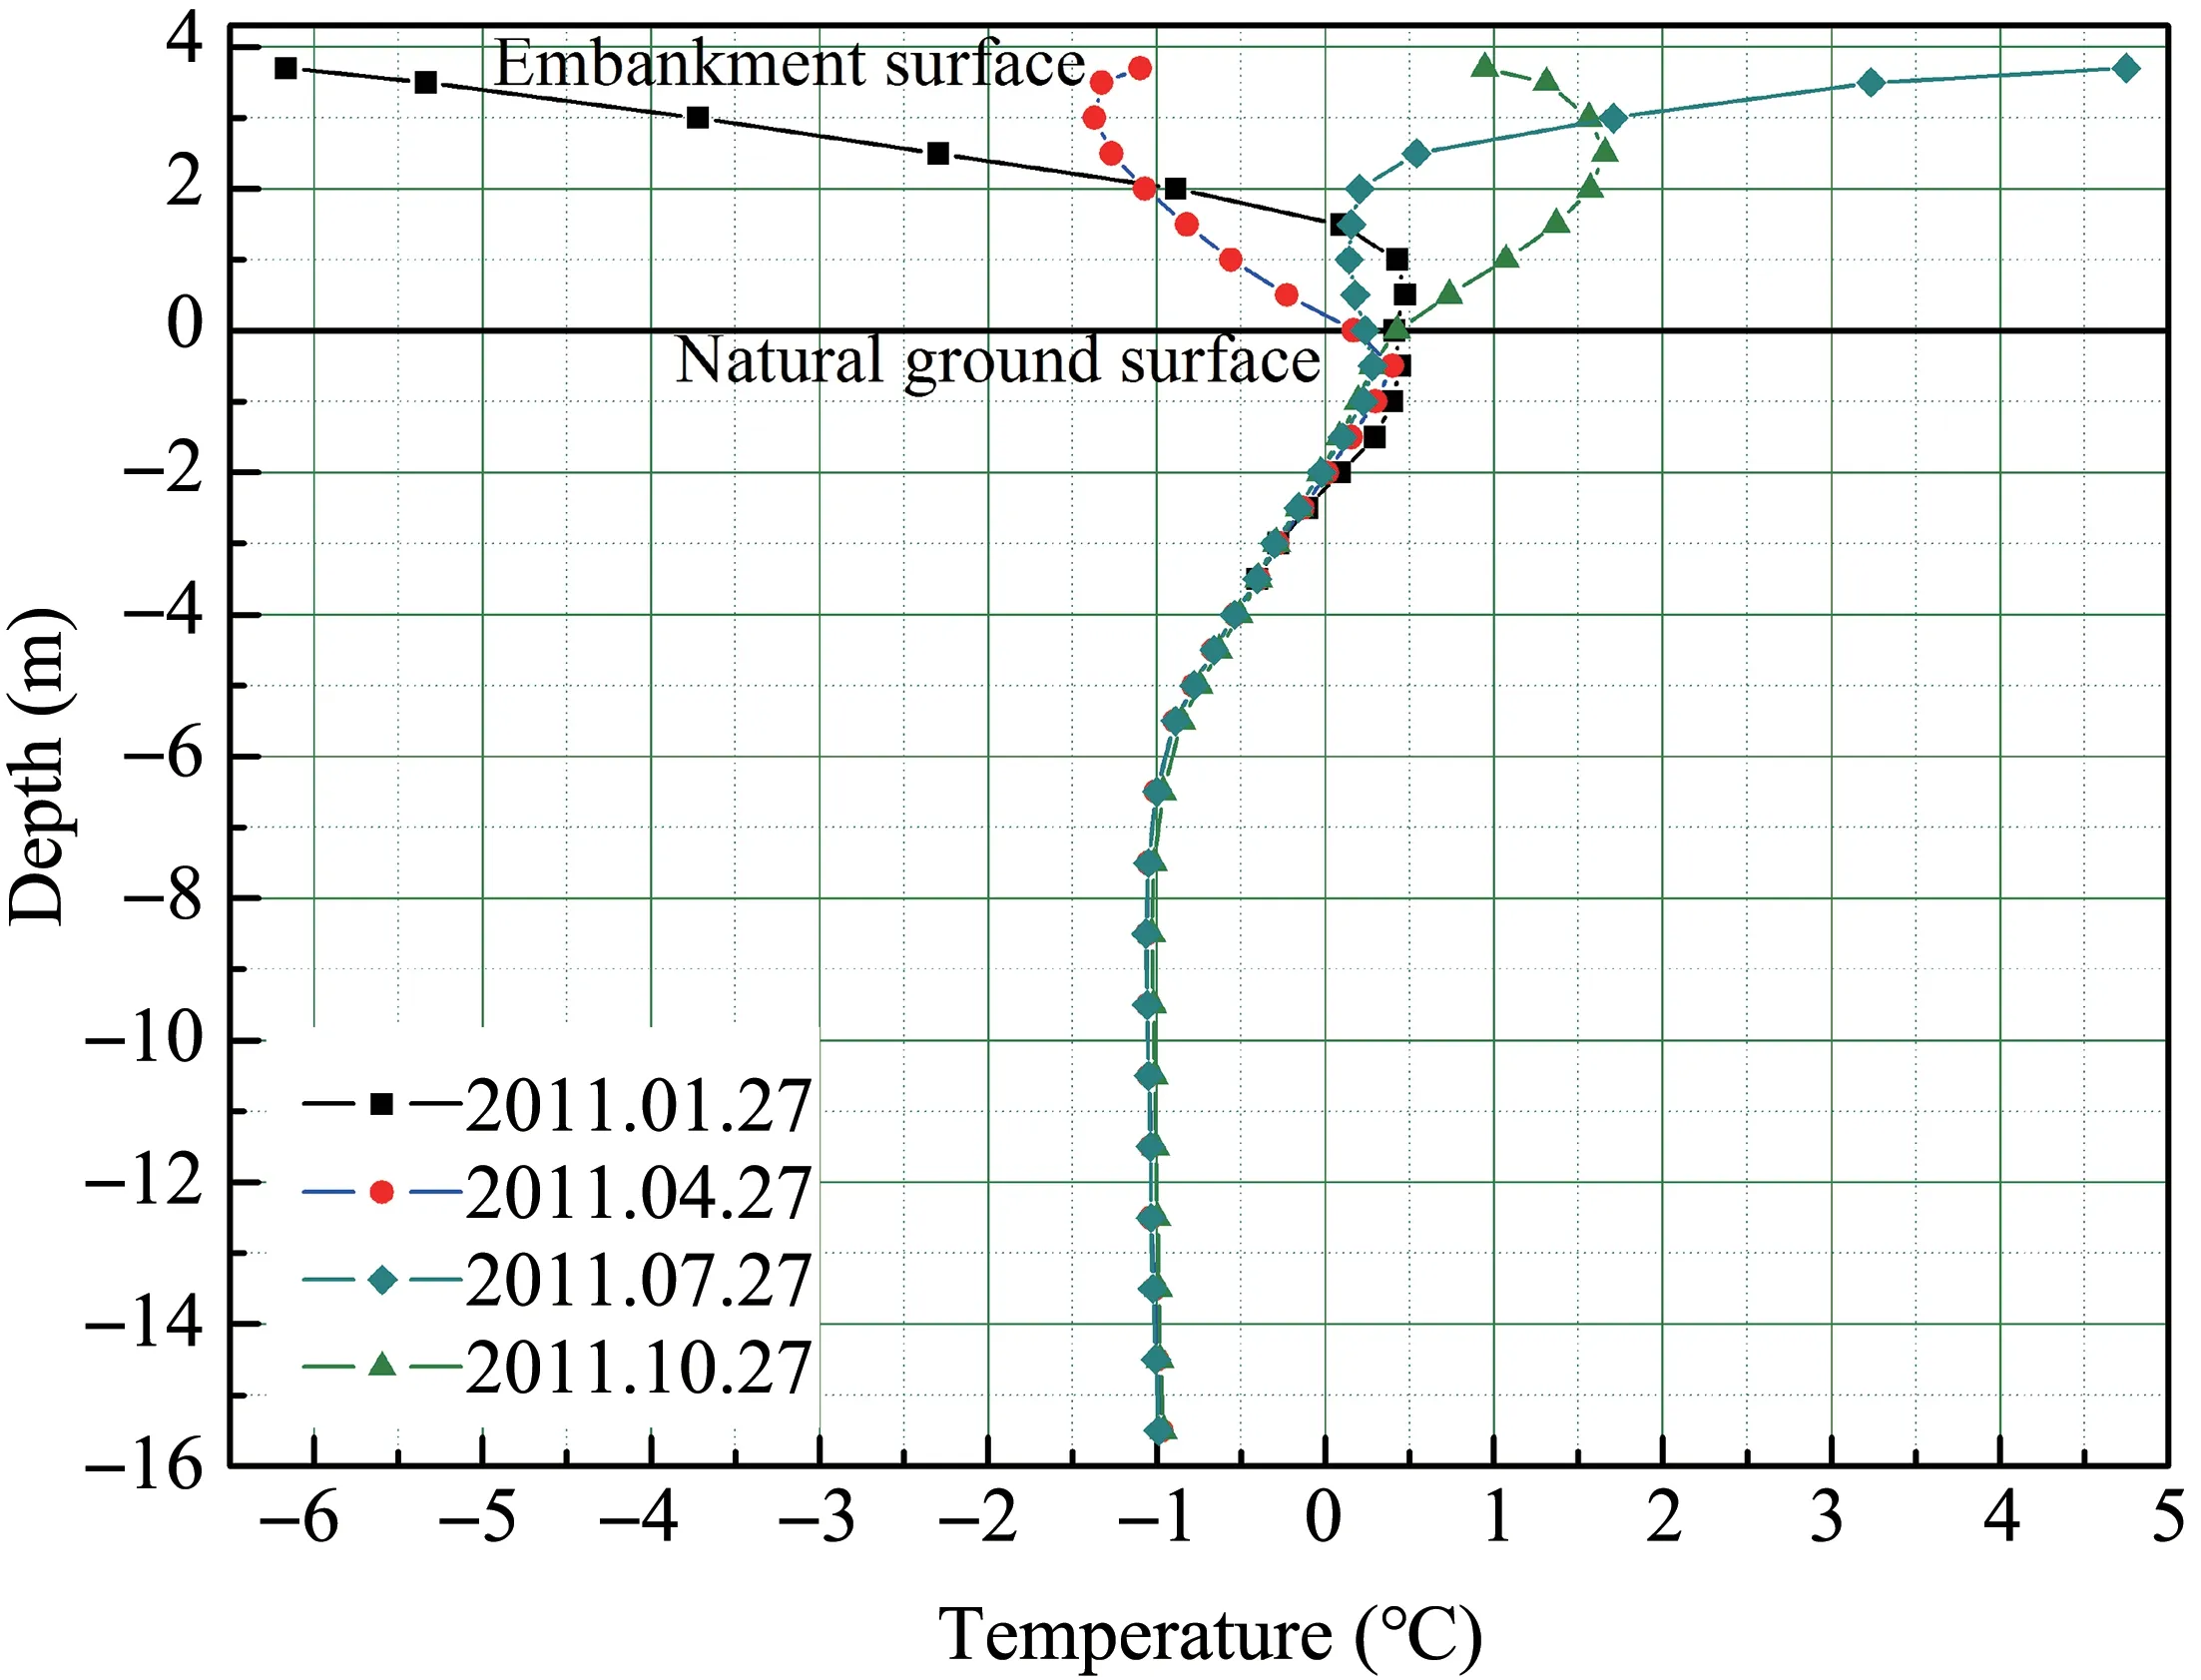
Figure 6 Temperature distributions of the testing embankment in different seasons in 2011
The simulation was performed based on the plane strain assumption.In the numerical model, two different boundary conditions were used.On the left and right boundaries of the model, the infinite element was used to simulate the wave propagation to prevent stress wave reflection.Meanwhile, the horizontal and vertical movements were restricted at the bottom of the model.In the numerical calculation, the vertical interaction between train and track was ignored.Instead, the vertical acceleration waveform recorded on the shoulder of the embankment was applied at the nodes along the bottom of the ballast layer (Figure 5)as the input train loading.In this way,the influence of the ballast on the train-induced vibration was ignored,and the numerical results could be directly compared with the test results.
A set of parameters, including the equivalent shear modulus and damping ratios, were used to describe the soil dynamic properties and their variations with seasons.In the calculation, the initial shear modulus and damping ratio are assumed to evaluate initial shear strain values in the first calculation.Then the new parameters are determined according to the shear strain values, and the next calculation is conducted subsequently.Finally, the dynamic shear modulus and damping ratio are determined by iterations until the calculation error is acceptable.
In the two-dimensional nonlinear finite element dynamic analysis, the soil was regarded as an elasticplastic material, and the Mohr-Coulomb yield criterion was adopted, and the ballast was assumed to be a linear elastic material(Cheet al.,2006).The embankment material shear strength parameters and physical and mechanical parameters for finite element analysis were determined based on a series of triaxial tests(Zhaoet al.,2003;Laiet al.,2008;Wanget al.,2009;Duet al.,2016)and listed in Table 1.
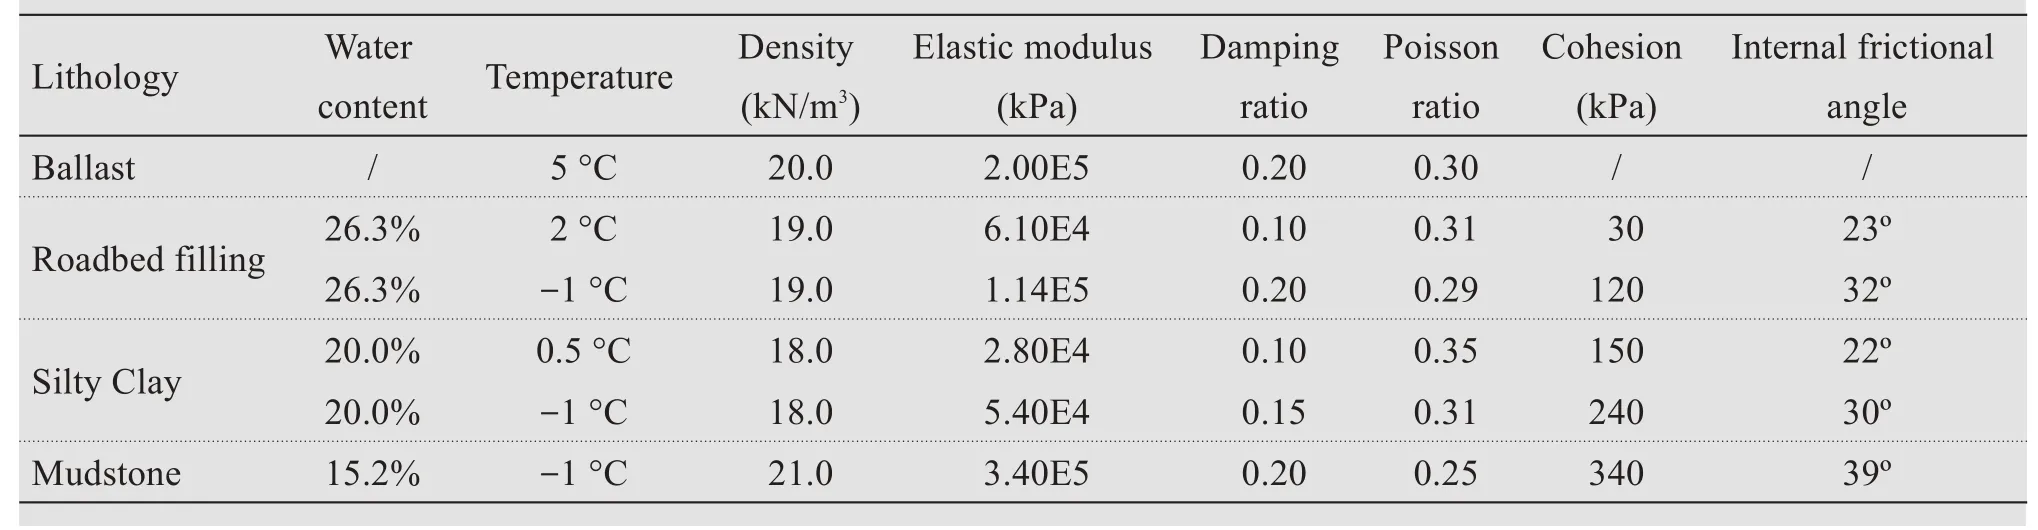
Table 1 Physical and mechanical parameters of the materials at the study site
4 Numerical results and analyses
4.1 Vibration propagation characteristics
Table 2 compares the maximum calculated acceleration values with the field test results at the right and left toes.In order to investigate the propagation characteristics of the train loading, the attenuation rate is defined as the ratio between the maximum acceleration at the slope toe and that at the shoulder of the embankment.The results from this study show that the maximum vibration acceleration at slope toes are consistent with those from the field test results.Moreover, the numerical simulation results also indicate that the vibration accelerations at slope toes are lower in the cold season than in the warm season.
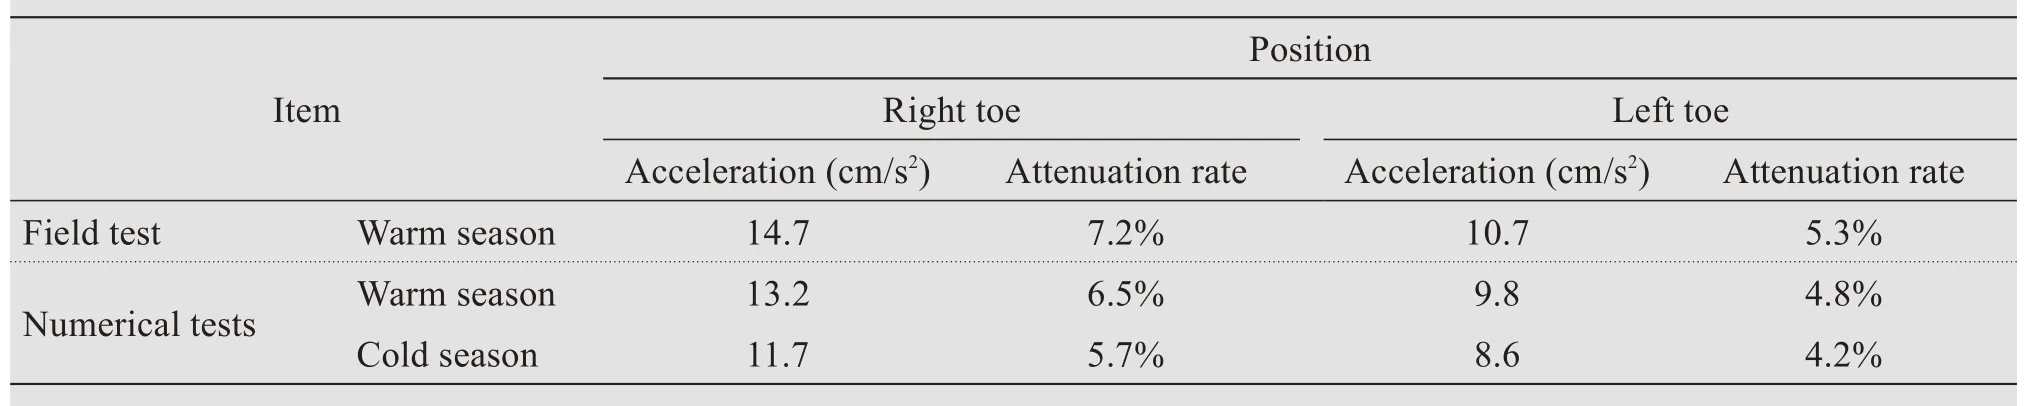
Table 2 Comparison of the numerical simulation and field test results
To analyze the dynamic behavior of the traditional embankment under train loading in different seasons,it is necessary to obtain the vibration propagation characteristics of the embankment under train loading.For this purpose, three observation points along the vertical central line,i.e.,A, B, and C as labeled in Figure 5, were chosen for analysis.As shown in Figure 5,point A is located on the natural ground surface,point B is on the permafrost table,and point C is within the permafrost layer and 8 m below the natural ground surface.
The acceleration time histories at the selected observation points in the warm season are illustrated in Figure 7a, and the spectrum characteristics of these waveforms are illustrated in Figure 7b.There is an evident attenuation effect of vibration propagation.The peak ground acceleration(PGA)value of the input train loading was 204 cm/s2, and it decreased to 38.3 cm/s2at point A, 14.5 cm/s2at point B and further down to 5.4 cm/s2at point C.Moreover, the maximum amplitude of the Fourier spectrum also exhibits an obvious attenuation effect.As the vibration propagates deeper into the ground, there was no significant change in the spectral characteristic,except that the energy of frequency components above 50 Hz were absorbed gradually.
Figure 8a and Figure 8b show the acceleration time histories and Fourier spectrum at the three observation points in the cold season.One can observe that the vibration attenuation effect also existed in the cold season.The PGA value decreased to 17.3 cm/s2at point A, 9.3 cm/s2at point B and further down to 3.3 cm/s2at point C.The maximum amplitude of theFourier spectrum also shows obvious attenuation effect, and the energy of frequency components above 50 Hz were gradually absorbed with the downward propagation of vertical vibrations.Moreover, the lower frequency components were also weakened or suppressed than that in the warm season.
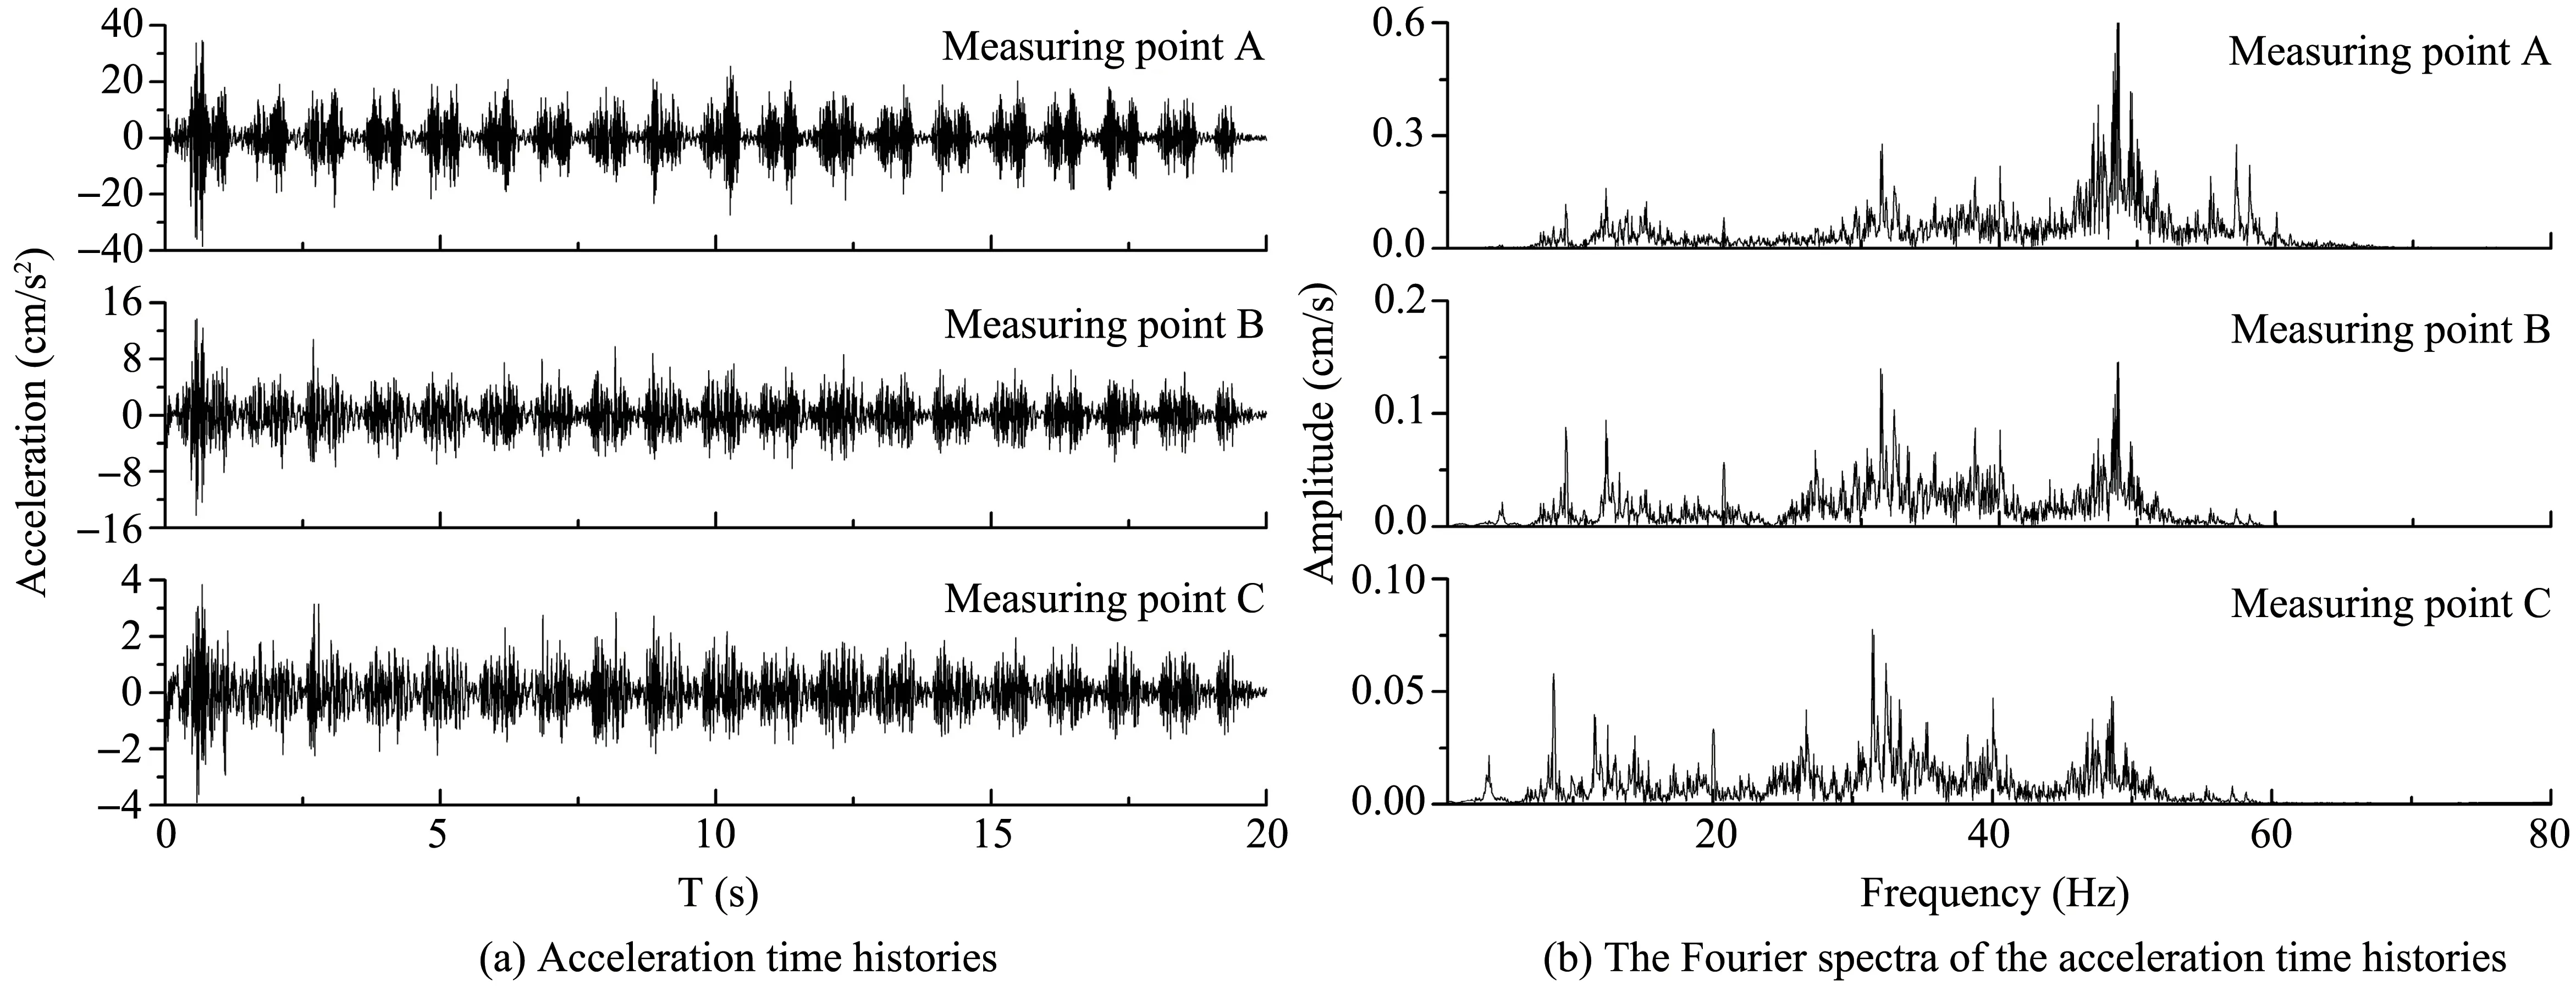
Figure 7 The Vibration propagation characteristics in the warm season
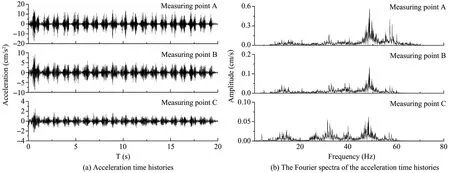
Figure 8 The Vibration propagation characteristics in the cold season
Figure 9 indicates a comparison of the PGA distribution along with the depth in different seasons, and the depth was measured downward from the top of the embankment.As shown in Figure 9,line A(PGA=20.4 cm/s2) corresponds to an attenuation of 10%,which separates the primary vibration attenuation stage from the secondary vibration attenuation stage.The primary stage occurs within the layers above the permafrost table in the warm season, whereas it occurs within the layers above the natural ground surface in the cold season.Moreover, the vibration attenuation in the cold season is greater than that in the warm season.The maximum acceleration of vibration drops to about 5%when the vibration of train load is transferred through the embankment into the permafrost.It indicates that the influence depth of dynamic train load was limited to the top of the permafrost table.
4.2 Dynamic Stress analysis of embankment
To evaluate the stability of the embankment under the vertical train loading and conduct a quantitative analysis of the deformation under long-term train load, it is necessary to understand the soil stress levels.Figure 10 illustrates the maximum von Mises stress distributions along with depth under the dynamic train loading in different seasons.It indicates that the Von Mises stress of the traditional embankment is greater in the cold season than that in the warm season.The von Mises stress decreases with an increas-ing depth exponentially.The maximum von Mises stress reaches 23 kPa on the top of the embankment and decreases to 7.5 kPa at a depth of 14.4 m in the cold season, while this value is 13 kPa on the top of the embankment and decreased to 3.9 kPa at a depth of 14.4 m in the warm season as well.Figure 11 indicates the maximum dynamic compressive stress S22 distributions along depth in different seasons.It shows the same variation characteristics as von Mises stress mentioned above.The S22 is greater than the von Mises stress located at the same depth.The maximum S22 reached 27 kPa and decreased to 9.4 kPa at a depth of 14.4 m in the cold season, while this value was 15 kPa and decreased to 4.8 kPa at a depth of 14.4 m in the warm season.
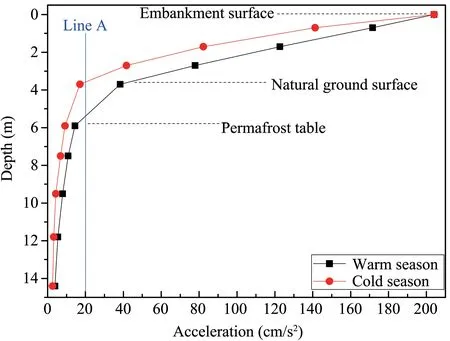
Figure 9 Comparison of the PGA distribution in different seasons
According to the numerical simulation results, an exponential fitting formula is proposed to evaluate the distribution of dynamic stress with depth in different seasons as follows:
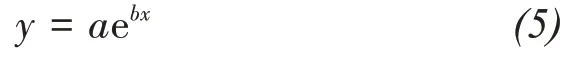
wherexis the depth (m), andyis the maximum dynamic stress (kPa),aandbare fitting parameters, and their values are listed in Table 3.The results indicate that the dynamic stresses of the embankment increase with the increase of the subgrade soil stiffness.

Figure 10 The maximum Von Mises stress distributions along with depth in different seasons
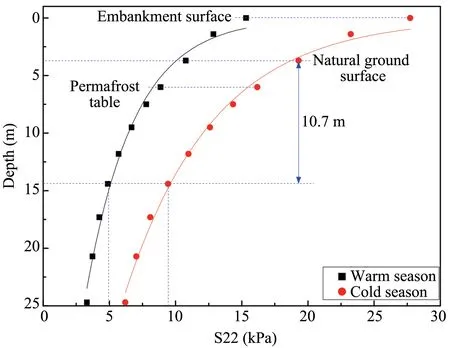
Figure 11 The maximum S22 distributions along with depth in different seasons
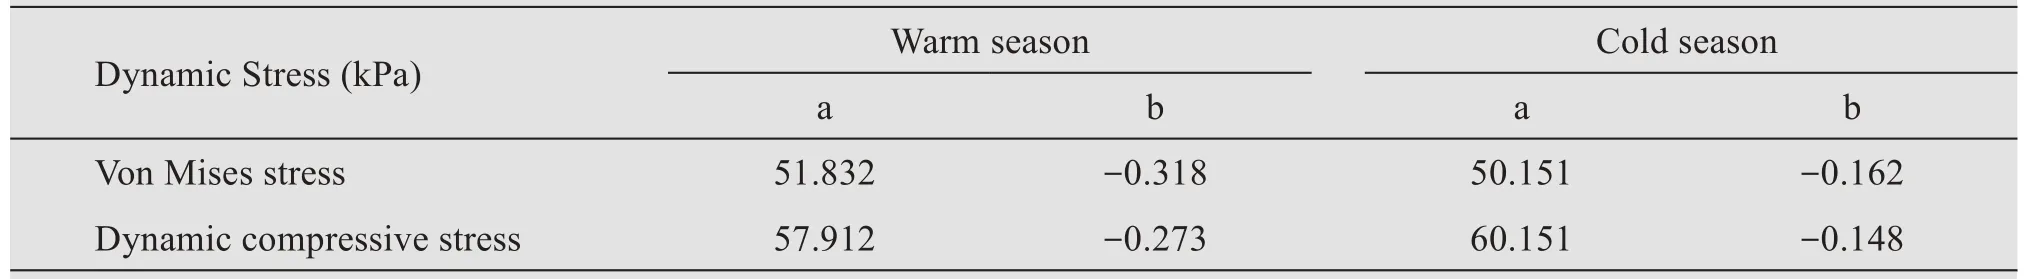
Table 3 The of fitting parameter values in different seasons
5 Discussions
Dynamic responses of railway embankment subjected to train loading in the permafrost and seasonally frozen regions have become an increasingly important issue.For example, Liet al.(2008) discussed the dynamic response of QTR embankment in permafrost regions under train load.Maet al.(2015) predicted permanent deformations of railway embankments under repeated vehicle loadings in permafrost regions.Wuet al.(2018) discussed the differences in the dynamic response characteristics between the traditional embankment and crushed-rock embankment.Tanget al.(2019) investigated the vibration mitigation technique for the high-speed railway in seasonally frozen regions.Yet, there have only been a few researchers concerning the influence of the seasons on the dynamic response under train loading.In this paper,the in-situ vibration induced by train loads was measured, and numerical simulations of the dynamic response of traditional embankment in different seasons were conducted.The results of this numerical study indicate that the characteristics of vibration propagation are different in different seasons,and the vibration attenuation in the cold season is greater than that in the warm season.The reason is that the soil in different seasons has significantly different mechanical properties.Firstly, the dynamic stiffness of the embankment is significantly smaller in the warm season than that in the cold season, the dynamic response of the embankment under the train loading is greater accordingly, which is reflected by the larger peak acceleration of the same location in the warm season.Secondly,the dynamic damping ratio of soil in the cold season is greater than in the warm season.Note that the dynamic damping ratio reflects the degree of energy dissipation within the soil skeletal structure under the dynamic loading.The larger the damping ratio of soil,the higher energy absorption capacity under dynamic loading.
Figure 12 indicates the deformation time histories measured on the embankment surface in different seasons.In the cold season,the maximum deformation of the embankment was 0.87 mm, while that reached to 1.90 mm in the warm season.This result shows that the instantaneous elastic deformation of the embankment under one-time train loading is minimal and has little influence on the stability of the embankment.Thus the cumulative plastic deformation of the embankment under repeated train loading should be paid special attention.At present, the strain accumulation model proposed by Monismith (1975) is widely used to predict the permanent deformation in the non-frozen zone.Presently, the model parameters for frozen soil can not be determined due to lack of reliable test results,and a systematic experimental study should be conducted on the frozen soil plastic deformation under repeated dynamic loading.
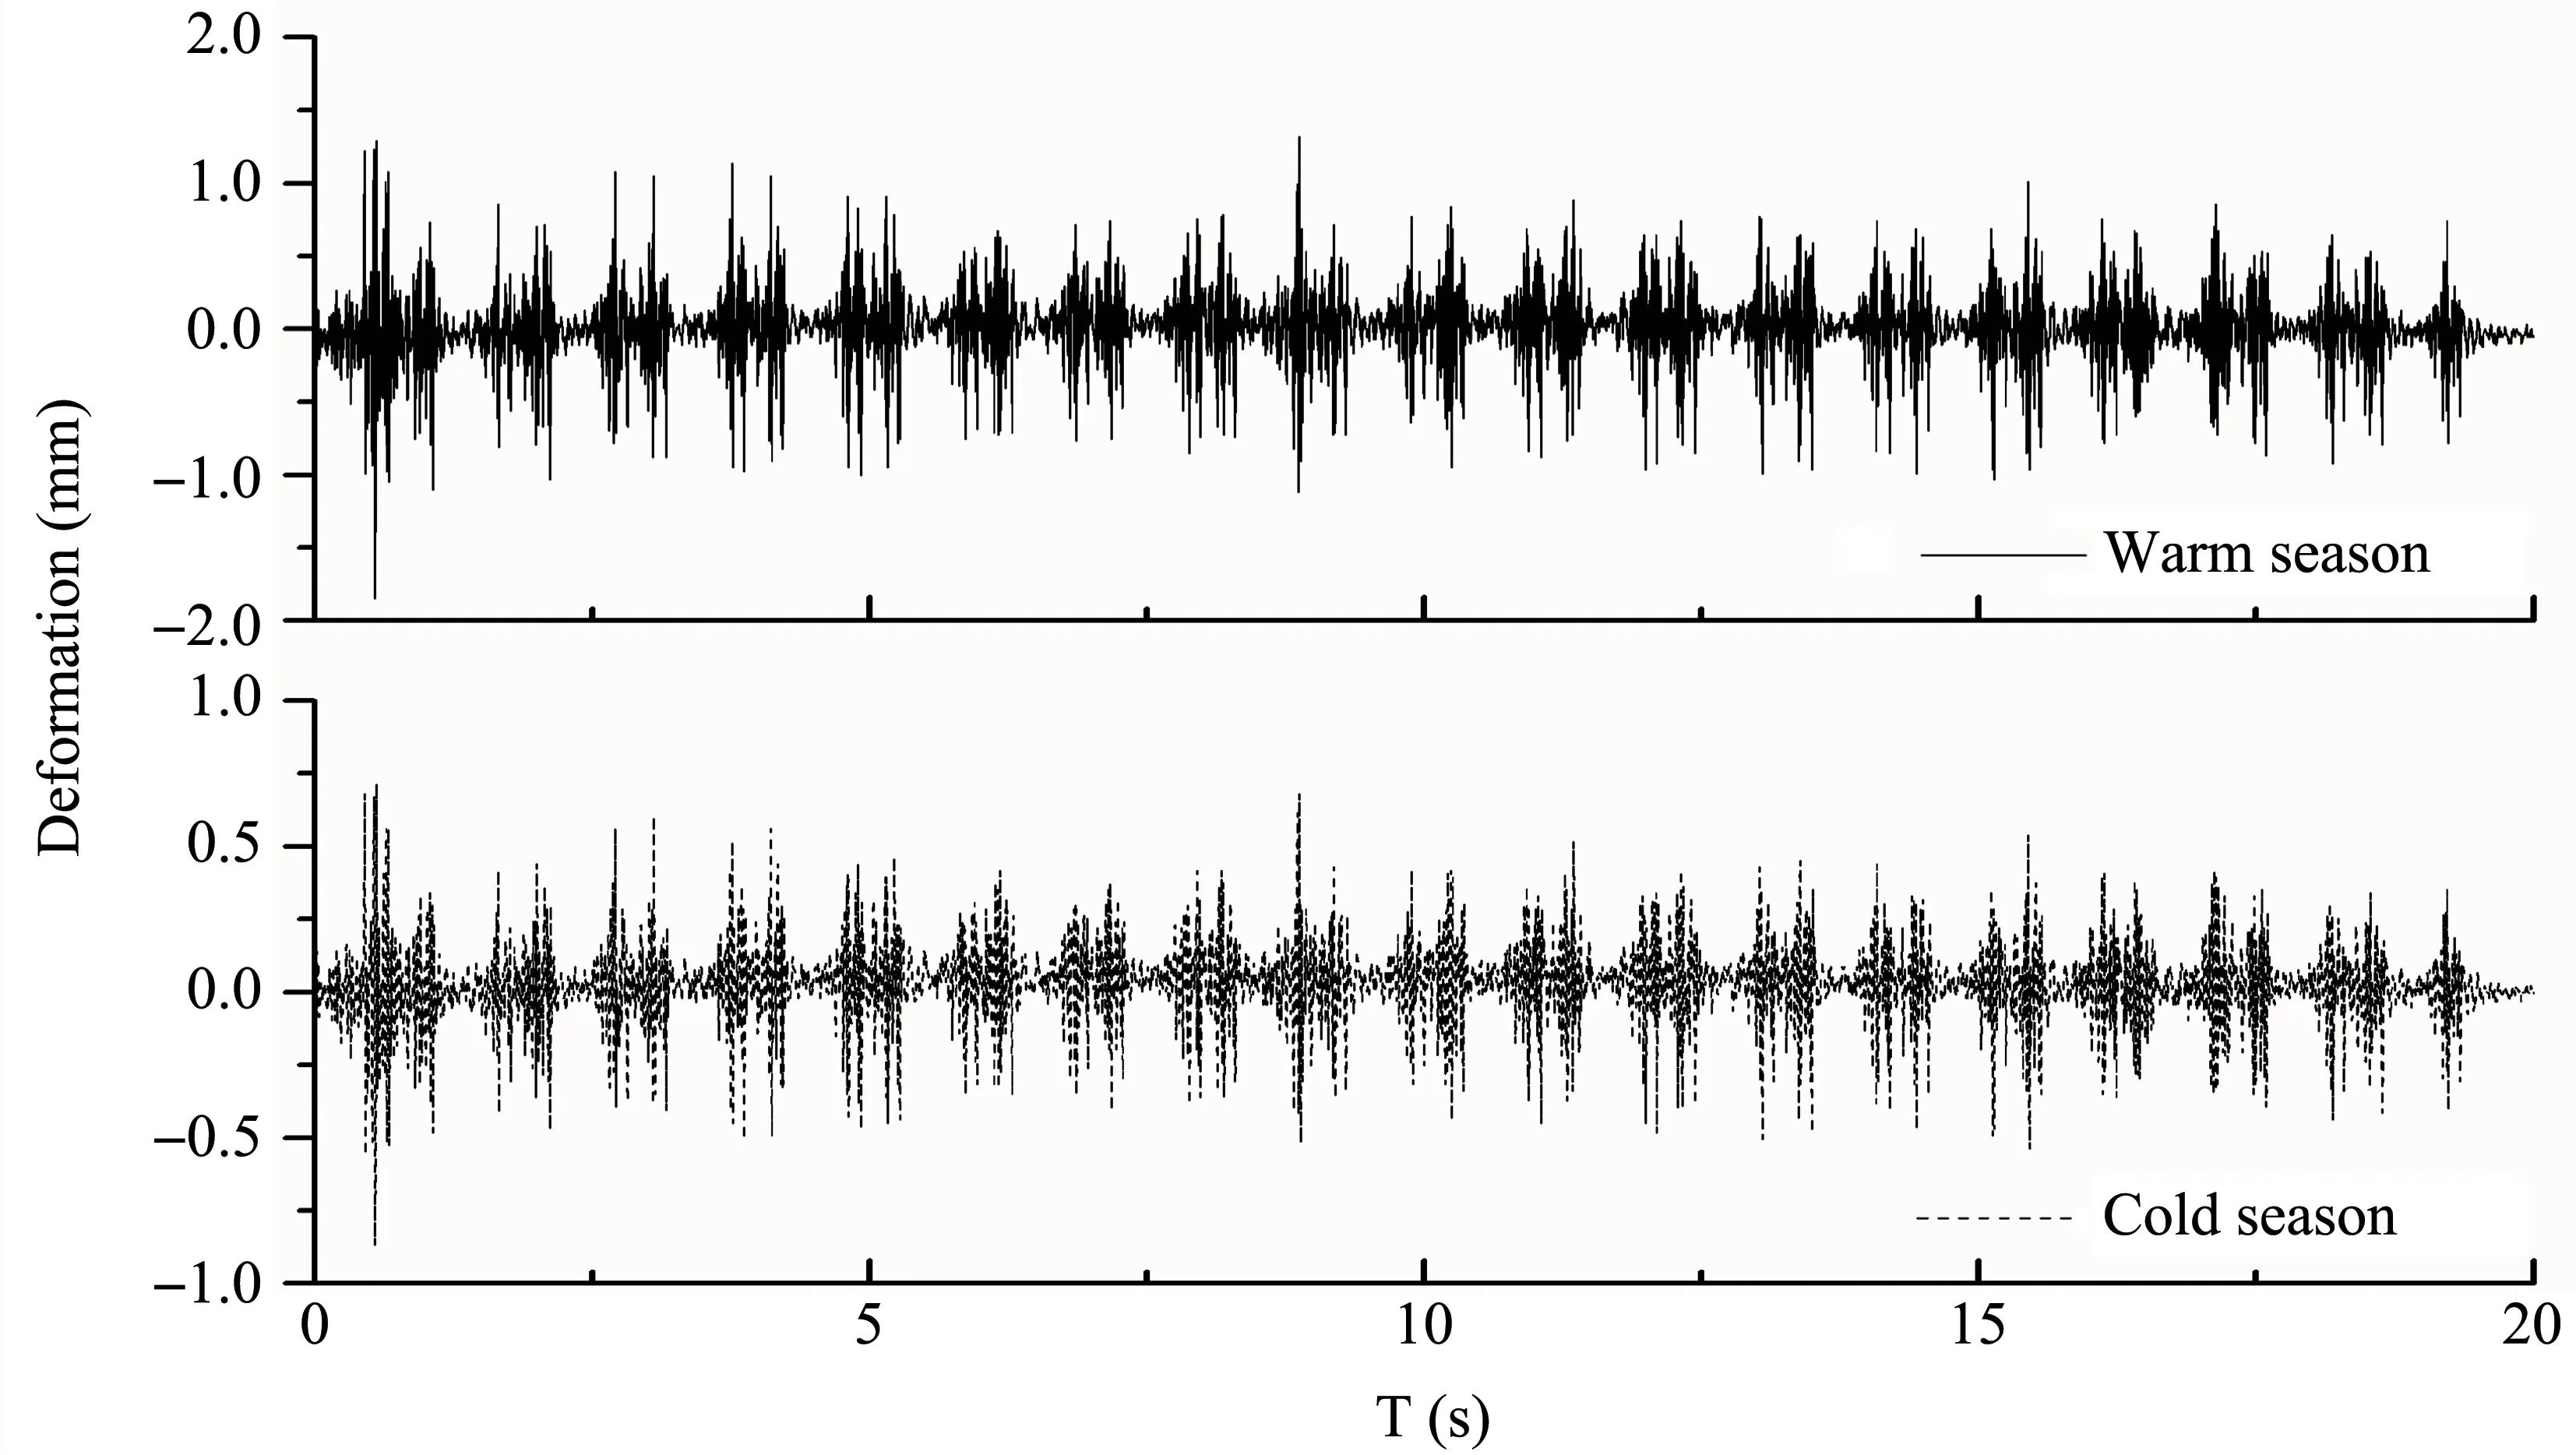
Figure 12 The deformation-time histories on the embankment surface in different seasons
6 Conclusions
A series of strong-motion tests were carried out on the traditional embankment of the QTR in permafrost regions.The field test results show a significant attenuation effect of the train loading from railway shoulder to slope toes.A numerical simulation of the embankment dynamic response was conducted, and the results were verified through comparison with the field test results.Furthermore, the seasonal difference in the dynamic behavior of the QTR embankment under vertical train loading was analyzed.The following conclusions can be made based on analyses of the results:
(1) There is an evident attenuation effect of the vertical train loading when the vibration propagates from the railway shoulder to slope toes.Peak acceleration and the attenuation rate are smaller at a longer horizontal distance.
(2) The vibration attenuation in the cold season is greater than that in the warm season.The energy of frequency components above 50 Hz are absorbed with downward propagation of vertical vibrations.More-over, the lower frequency components are weakened or suppressed than that in the warm season.
(3) The primary vibration attenuation stage occurs within the soil layer above the permafrost table in the warm season, whereas this stage occurs within the soil layer above the natural ground surface in the cold season.The influence depth of the dynamic train loading is approximately limited to the permafrost table.
(4) The dynamic stress decreases exponentially with an increasing depth in different seasons.
Acknowledgments:
This study was financially supported by the National Natural Science Foundation of China (No.41701058),the Second Tibetan Plateau Scientific Expedition and Research(STEP)Program(Grant No.2019QZKK0905),the Open Fund of State Key Laboratory of Frozen Soil Engineering(Grant No.SKLFSE201606),and the China Postdoctoral Science Foundation (Grant No.2015M570490).We would like to express our sincere thanks to the anonymous reviewers for their valuable suggestions and constructive comments,which significantly improved the presentation of this paper.
 Sciences in Cold and Arid Regions2020年4期
- Sciences in Cold and Arid Regions的其它文章
- Comparison of sampling schemes for spatial prediction of soil organic carbon in Northern China
- Assessing spatial and temporal variability in water consumption and the maintainability oasis maximum area in an oasis region of Northwestern China
- Theoretical expressions for soil particle detachment rate due to saltation bombardment in wind erosion
- Validation of AIRS-Retrieved atmospheric temperature data over the Taklimakan Desert
- Variation characteristics of evaporation in the Gulang River Basin during 1959-2013