
随机网络中三种渗流相变的交叉
2020-09-23 07:04:06王睿婕
四川大学学报(自然科学版) 2020年5期
贾 啸,王睿婕,张 田
(1.四川师范大学物理与电子工程学院,成都 610101; 2. 阿坝师范学院,阿坝 623002)
1 Introduction
Percolation,describing the onset of large-scale connectivity of networks as edges are added,is one of most studied problems in statistical physics and has been widely applied in various systems[1-6]. As one of the most classical percolation models,the Erdös-Rényi (ER) random graph[7]chooses one edge uniformly and randomly at each time step and the resulting phase transition is continuous. Instead of selecting one edge at each time step,a competitive percolation process with a given number of candidate edges can lead to so-called explosive percolation[8]where the order parameter is seemingly discontinuous in a relatively large system size. Stimulated by this work,various competition rules[9-18]are proposed,and some authors introduced weighted rules[19-24]where the edges are added with a certain probability. Later,it is shown that the phase transition induced by Achlioptas process is continuous in the thermodynamical limit[25]. Moreover,they have made clear that the percolation phase transition can be discontinuous if the number of the competition edges grows with the system size[25].
Although any rule based on picking a fixed number of random nodes would lead to a continuous phase transition[25],the authors also pointed out that there are Achlioptas processes whose order parameter has random fluctuations even in the thermodynamic limit[26]. Nagleretal. analyzed a devil’s staircase model,in which the order parameter generates a multiple discontinuous phase transition accompanied by an infinite number of discontinuous jumps in the supercritical region[27]. After that,Schröderetal. studied a fractional growth percolation model[28]that generates a multiple discontinuous phase transition where the locations and sizes of the jumps are randomly distributed in the supercritical region. Moreover,in the supercritical region the relative variance of the order parameter is tending to a nonzero constant in the thermodynamical limit,implying non-self-averaging effect[28]. It is also reported that the relative variance of the order parameter oscillates with amplitudes even in the thermodynamical limit,both in the subcritical and supercritical region[29].
Recently,continuous and multiple discontinuous and discontinuous phase transitions are observed in one model with a parameterα. In the model[30]with appropriate value ofα,due to a decreasing edge on the interval (Nα,N) the clusters with linear size are suppressed to grow in the supercritical region and the mergence between them leads to a multiple discontinuous phase transition. In this paper,we consider a percolation model based on a rather simple piecewise linear weighted function with a rising edge on the interval [1,Nα] and a lever edge on the interval (Nα,N),in which the percolation phase transition can change from continuous to multiple discontinuous to discontinuous as the value ofαis tuned from 1 to 0. Distinctly different from the physical mechanism in the paper [30],in this work the selected probability of each cluster with size on the interval (Nα,N) is equal due to a lever edge,which provides insights into understanding the crossover behaviors of multiple phase transitions.
2 Model
The network starts withNisolated nodes,and at each time step add an edge between two different nodes,and in the adding-edges process the intracluster edges are excluded. In order to add an edge to the network,two nodes without having been connected in the present network are sequentially selected with a certain probability,which depends on the size and the corresponding number of the cluster containing the node. If a cluster containsinodes,this cluster is named asi-node cluster,and the number of thei-node clusters is written asni. Thus the selected probability of the node belonging to thei-node clusters can be expressed asnif(i)/∑inif(i),in whichf(i) is called the weighted function and defined as
(1)
whereαis a continuously tunable parameter on the interval [0,1]. In the percolation process,the occupied edge density is defined ast=L/NwhereLindicates the number of the occupied edges,and the order parameter is written asc1=C1/NwhereC1represents the size of the largest cluster at each time step.
3 Results and analysis
Typical evolution of the order parameterc1is plotted in Fig. 1 with the system sizeN=220. Atα=1,the percolation model becomes the classical ER random graph model that leads to a continuous phase transition[22]. Whenα=0.6 (the red point in Fig.1),the order parameter exhibits some jumps in the supercritical region,but the phase transition is fact continuous in the thermodynamic limit,as will be explained in the later paragraph. Whenα=0.5 (the blue point in Fig.1) andα=0.4 (the purple point in Fig.1),due to the distinctly multiple jumps of the order parameter in the supercritical region,they are considered as multiple discontinuous phase transitions,which will be explained in detail later.
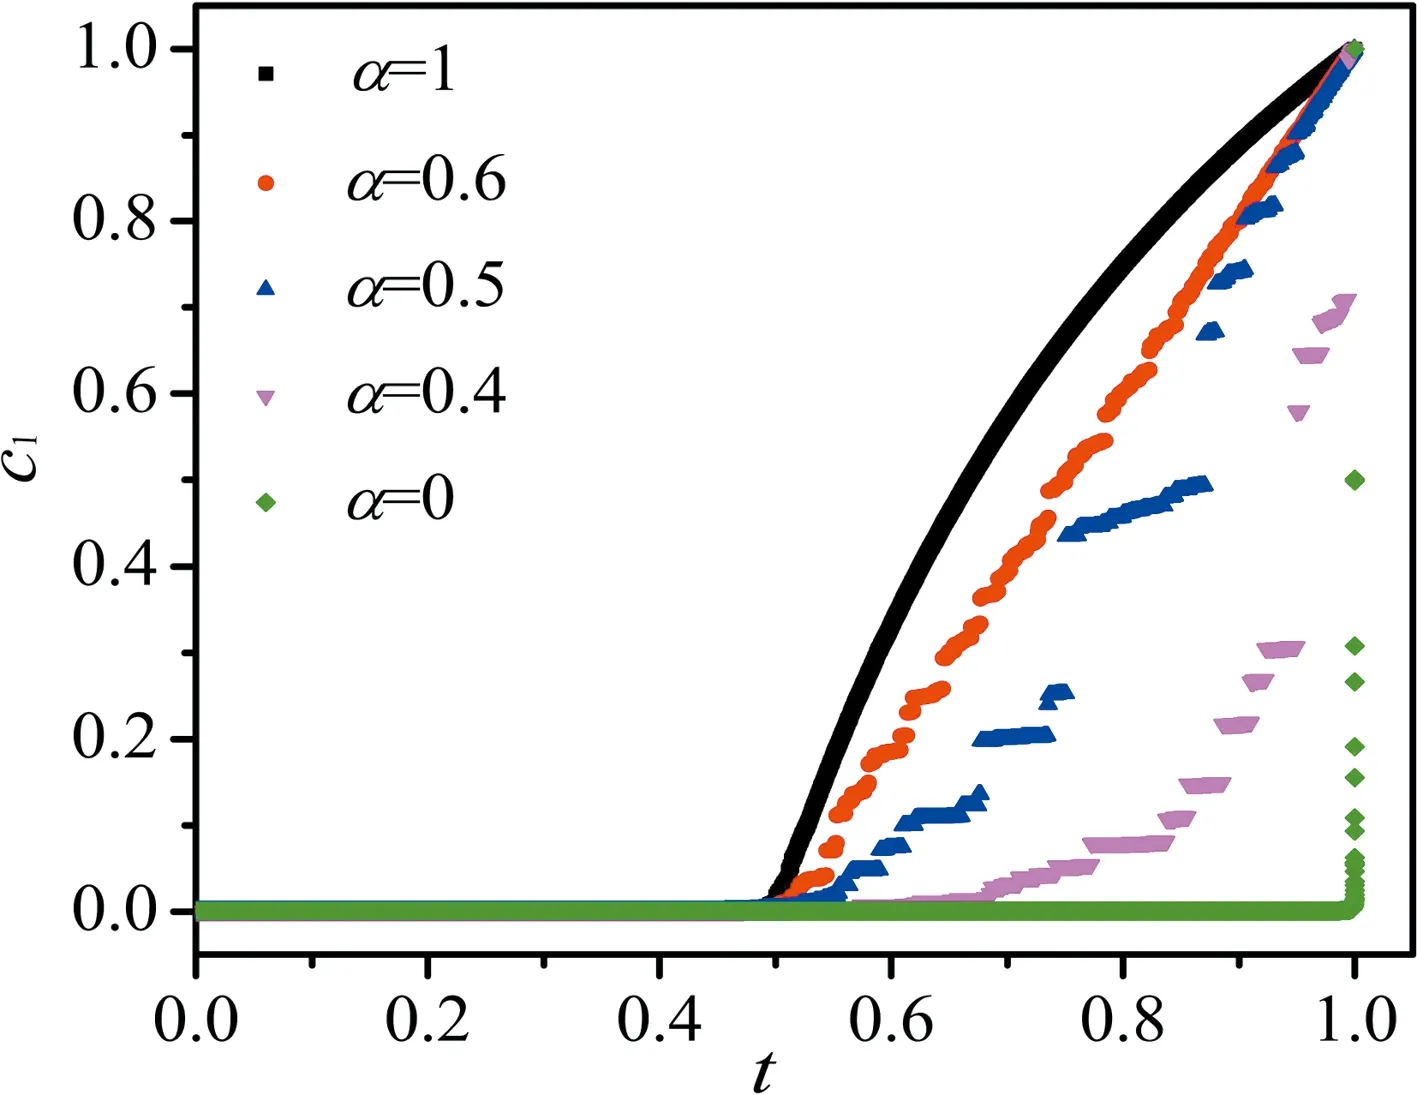
Fig.1 Typical evolution of the order parameter c1 with different α under N=220
We first show that the phase transition ofα=0 (the green point in Fig. 1) is discontinuous at the very end of the adding-edges process. Astincreases from 0,the cluster size heterogeneity[31](the number of distinct cluster sizes) increases till the lower pseudotransition pointtl(N) when it becomes maximum and just aftertl(N) many clusters with different sizes merge into one giant cluster with linear size. Fig. 2 shows the log-binned cluster size distribution with an average over 100 times attl(N) and the corresponding fitting curves of different system sizesN. It is clear that the cluster size obeys the exponential distribution by the fitting curve equations,indicating a first order phase transition. On the other hand,according to the fitting curve equations with different system sizesNin Fig. 2,it is reasonable to conclude thatni~4exp(-βi),in whichβdepends on the system sizeN. Due to the fact that ∑iini=N,we immediately have ∑i4exp(-βi)i~N. By changing the summation symbol into integral in the above equation,one can getβ~2N-0.5. Furthermore,letnsum(tl(N)) denote the total number of the clusters attl(N),and thusnsum(tl(N))=∑ini~2N0.5. Note that with one edge added to the network the total number of the clusters accordingly reduces one,thus it is easy to obtain thattl(N)=1-nsum(tl(N))/N. Combining withnsum(tl(N))~2N0.5,we find that the lower pseudotransition pointtl(N) is converging to 1 in the thermodynamical limit. It is also worth noting that the percolation model with initiallyNisolated nodes becomes connected att=(N-1)/Nconverging to 1 in the thermodynamical limit. Therefore the percolation process atα= 0 leads to a first order phase transition at the very end of the adding-edges process in the thermodynamical limit.

Fig.2 For α=0 log-binned cluster size distribution at the lower pseudotransition point and the corresponding fitting curves of different system sizes
According to the weighted function in equation (1) with appropriate value ofα,two clusters with sizeiandj(j>i>Nα) are generated at a certain occupied edge densityt. Fromtit might be equal probability fori-node cluster andj-node cluster to be chosen in the subsequent adding-edges process,implying that the order parameter might be non-self-averaging even in the thermodynamical limit. Non-self-averaging is an important concept due to its applications in a broad range of real systems,ranging from spin grasses and neural networks to polymers and population biology[28]. In network percolation,non-self-averaging describes the phenomenon where the order parameter does not converge to a defined function of the occupied edge densitytin the thermodynamical limit. Instead in the supercritical region,the order parameter has randomuctuations even in the thermodynamical limit[26-29]. Fig. 3 depicts several distinct realizations of the order parameter withα=0.5 andα=0.4. It is clear that the order parameter has tremendous variation from one realization to another in the supercritical region,indicating non-self-averaging phenomenon. Also note that the tail of the order parameter presents the shape of the continuous curve. The reason is,according to equation (1),f(j)≫f(1) ifj>Nα,and thus the largest cluster continuously absorbs small clusters with size approaching to one when the occupied edge densitytis approaching to 1.

Fig.3 For N=223six simulations of the order parameter c1 as a function of t for α=0.5(a) and α=0.4 (b)
Non-self-averaging is previously reported in some percolation models[26-29],where the relative variance of the order parameter is larger than zero in the supercritical region when the system sizeNis tending to infinite. To clearly illustrate the non-self-averaging effect in our model,we investigate the relative variance of the order parameterc1,defined as
(2)
where the brackets denote ensemble averaging.With an ensemble of 500 realizations Fig. 4 presents the relative varianceRvof the order parameter in dependence on the occupied edge densitytatα=0.6,0.5 and 0.4. In Fig. 4(a) withα=0.6,Rvis converging to zero in the supercritical region when the system sizeNbecomes large. In Fig. 4(b) withα=0.5,althoughRvis rapidly converging to zero at the end of the occupied edge density when the system sizeNbecomes large,but there exists a supercritical interval whereRv(≠0) of different system sizes interlaces together,indicating the non-self-averaging effect. In Fig. 4(c) withα=0.4,with increasing system sizeRvbecomes larger on an extended interval indicating non-self-averaging effect. For continuous phase transition,it is universally known that largeuctuations in the relative varianceRvare observed only in the critical window,and at the critical point they collapse to a singular peak in the thermodynamical limit[5]. From the distinctly different supercritical behaviors ofRvin Figs 4(a) and 4(b) and 4(c),it is indicated that the tricritical value ofαis between 0.6 and 0.5 for the phase transition from continuous to multiple discontinuous. Also note that the phase transition atα=0 is discontinuous,thus the tricritical value ofαis between 0.4 and 0 for the phase transition from multiple discontinuous to discontinuous.

Fig.4 The relative variance Rv of the order parameter in dependence on the occupied edge density t at α=0.6 (a),α=0.5 (b) and α =0.4 (c)
4 Conclusions
In conclusion,based on a rather simple piecewise linear weighted functioncontinuous and multiple discontinuous and discontinuous phase transitions are unified into one percolation model with parameterα. Atα=0,we obtain an empirical formula of the cluster size distribution at the lower pseudotransition point,and based on the formula we show that the percolation process atα=0 leads to a discontinuous phase transition at the very end of the adding-edges process in the thermodynamical limit. To understand how the phase transition changes from continuous to multiple discontinuous to discontinuous,we further calculate the relative variance of the order parameter with different system sizes. The results show that it collapses to a singular peak at the critical point in thermodynamical limit atα=0.6,and interlaces together on a supercritical interval atα=0.5,and becomes larger on an extended interval atα=0.4 with increasing system size,respectively. Therefore it shows that the tricritical value ofαis between 0.6 and 0.5 for the phase transition from continuous to multiple discontinuous,and that for the phase transition from multiple discontinuous to discontinuous the tricritical value ofαis between 0.4 and 0.
猜你喜欢
中国机械工程(2022年22期)2022-11-25 08:24:30
中国机械工程(2022年7期)2022-04-20 03:25:38
作文小学高年级(2021年9期)2021-12-25 22:03:27
黄河之声(2021年12期)2021-10-25 01:51:04
流行色(2020年3期)2021-01-04 08:32:36
音乐天地(音乐创作版)(2020年2期)2020-04-18 06:41:58
中国机械工程(2019年17期)2019-09-19 07:43:32
南方周末(2019-08-22)2019-08-22 11:17:41
水动力学研究与进展 B辑(2018年4期)2018-09-28 05:34:44
中国机械工程(2018年4期)2018-03-06 05:34:58
