Acoustic Analysis of Mandarin Chinese Vowels Produced by Young Adults
2020-07-10 07:44WANGZhenniCHENYangNGManwaYAOLiqunZHANGWeiming
康复学报 2020年3期
WANG Zhenni,CHEN Yang,NG Manwa L.,YAO Liqun,ZHANG Weiming
1Shanghai Ruijin Rehabilitation Hospital,Shanghai 200125,China;2Duquesne University,Pittsburgh,Pennsylvania PA15282,USA;3Faculty of Education,University of Hong Kong,Hong Kong 999077,China;4Nursing College,Fujian University of Traditional Chinese Medicine,Fuzhou,Fujian 350122,China;5Ruijin Hospital,Shanghai Jiaotong University School of Medicine,Shanghai 200025,China*Correspondence:YAO Liqun,E-mail:yaoliqunpt@163.com;ZHANG Weiming,E-mail:zwm40397@rjh.com.cn
ABSTRACT Objectives:Acoustic analysis is a kind of objective assessment of speech-sound which can offer a relatively simple and visual way to examine production of a vowel.Mandarin Chinese is a tone language in which the same phonetic segment carries a different meaning when produced at different lexical tones.Previous studies have examined American English vowels produced by native adult speakers.The aim of the present study was to establish the vowel formant space by examining the formant frequencies associated with Mandarin vowels produced by Chinese young adults aged 23 to 33 years old and identify the characteristics of vowels in Mandarin Chinese at 4 different lexical tones.Methods:Acoustic signals of the six Mandarin vowels(/a/,/ɔ/,/e/,/i/,/u/,/y/)produced by native young adult speakers of Mandarin Chinese(n=11)were recorded,and the participants were instructed to produce all the speech samples using a comfortable loudness level and speech rate.The speech samples were produced was randomly.The first two formants were analyzed by using a professional acoustic measurement system(Multi-Speech,KayPentax,USA).Multi-Speech provides a time-domain waveform and a frequency-domain wide-band spectrogram(filter bandwidth=300 Hz).Results:The results showed that,generally speaking,the vowel/a/exhibited the highest mean F1 value whereas vowel/i/had the lowest F1.The vowel/i/showed the highest F2 while/u/showed the lowest F2 value.The vowel of/ɔ/and/e/with different four tones in F1 and F2 had significant differences(P<0.05).However,no significant differences(P>0.05)in F1 and F2 were observed in the other vowels across tones,like/a/,/i/,/u/,/y/.Conclusion:An acoustic vowel space was established in which/i/,/u/,and/a/were corner vowels,and/ɔ/and/e/were found centrally,contributing to the generally triangular vowel space associated with these six core vowels of Mandarin Chinese.The investigation of the first two formant frequencies of vowels across tones shows significant differences were found in the vowels/ɔ/and/e/with different tones in F1 and F2.When/ɔ/was produced with level tone,the tongue was more advanced and depressed than with other three tones.For/e/with rising tone the tongue was more retracted,compared to the tongue for/e/with dipping tone.
KEY WORDS Chinese Mandarin vowel;formant frequency;vowel space;acoustic analysis;young adults.
1 Introduction
Acoustic analysis offers a relatively simple and objective way to visualize and examine production of a vowel(monophthong or diphthong),often by means of a waveform and a spectrogram.While the former depicts the changes of sound pressure in the time domain,the latter allows examination of the related formant(frequency)characteristics of the speech sound[1].A vowel produced in a carrier phrase can be examined in detail based on a wide-band spectrogram derived using the well-known Fourier transformation,as well as through the use of Linear Prediction Coding(LPC).A major advantage associated with formant or spectral analysis is it allows to better understand the frequency content and thus resonance characteristics of the vocal tract during production of a particular speech sound.As such,information obtained from spectrally analyzing a speech sound provides insight into the articulation of that sound.Articulation refers to the physical relationship among articulators during production of speech sound.Speech articulators include tip,blade and dorsum of the tongue,jaw,lips,soft palate,as well as pharyngeal cavity during speech production.All of them play a significant role in determining the resonance characteristics of the vocal tract.Simply put,knowledge of formant frequencies allows us to understand articulation during production of the sound and it allows us to know the details of vocal tract configuration,including positioning of the tongue,lips,jaw,etc.duringsound production.This is achieved bymerely acoustically analyzing the acoustic signal of the sound,which is considered a non-invasive and simple analytic method.
Formant measurement can be used to quantify production of speech sounds in connected speech,as an attempt to better understand articulation of speech sounds,especiallyforvowels.Accordingtobasicspeech acoustics,formant frequencies are generally inversely proportional to vocal tract length,and can be derived from a signal spectral cross section through the steadystate portion of the acoustic signal[2-4].The first two formants are frequently said to correspond to the high/low and front/back dimensions respectively,which have traditionally,though not entirely accurately,been associated with the contraction and position of the tongue[5].Thus,the first formant(F1)is high for a low vowel(such as/a/)and low for a high vowel(such as/i/or/u/).For the second formant(F2),it is high for a front vowel(such as/i/)and low for a back vowel(such as/u/)[6].
Previous studies have acoustically examined American English vowels produced by native adult speakers[7-9].The most widely referred study relating to the American English vowels was reported by Peterson and Barney that dated back to 1952[2].Based on ten English vowels produced by 61 adult males and females and 15 children,they reported the average F0 and formants values.The study was later replicated and extended by Hillenbrand and colleagues[7],in which two more vowels and a fourth formant were included in the analyses of data obtained from 45 men,48 women,and 46 children.Both studies revealed that articulation of vowels can easily be indexed acoustically by the first three formant frequencies(F1,F2,&F3),although some researchers suggested that F1 and F2 are sufficient for vowel classification.According to Raphael,Borden,and Harris[10],F1 and F2 are sufficient in distinguishing English vowels,and F3 can be used to reflect tongue tip configuration.Generally speaking,a lower F3 is associated with a retroflexed tongue,while a higher F3 reflects a flat tongue tip configuration.In other words,knowledge of F0 or higher formants probably adds no additional information to vowel articulation[11-14].
In a recent study of how body position may affect production of quadrilateral point vowels of English produced by 27 male and female native English speakers,Vorperian and colleagues[15]correlated fundamental frequency(F0),the first four formant frequencies(F1-F4)and a number of volumetric measures derived byusingacoustic pharyngometry.Theyfound that body posture did not seem to affect major vowel formants.
More recently,F0 and formant frequencies have been used in studies of speech production by children and adults across different languages,including Japanese[16],Russian[17],Swedish[18],Korean[19],Arabic[20],Mandarin[21],and Cantonese[22].In an Arabic study[20]participants sustained the six steady-state Arabic vowels(/i:/,/e:/,/a:/,/o:/,and/u:/).In the Swedish study by White[18],the subjects were asked to sustain the vowels/e:/,/u:/,/i:/and/ɔ/.As mentioned,most researchers[14-15,21]focused on sustained vowels and syllables,instead of sentences.There is a paucity of information on formant frequencies of vowels produced in sentences.In addition,these studies failed to report significant differences in formant frequencies across different vowels.Ting and Zourmand[23]obtained F0 and the first two formant frequencies of vowels produced by 360 Malay children aged between 7 and 12 years.Their results showed a nonsystematic decrement in formant frequencies with age,implying a lengthening of resonating cavity,or the vocal tract.There was a significant difference in the first three formants between different races reported by Mayo and Grant[24].
Mandarin Chinese is a tone language in which,unlike a non-tonal language such as English,the same phonetic segment carries a different meaning when produced at different lexical tones.There are four lexical tones in Mandarin Chinese:level tone(Tone 1),rising tone(Tone 2),dipping tone(Tone 3),and falling tone(Tone 4)[25].Tones of Mandarin Chinese have been studied by many researchers.For example,Duanmu[26]reported that Tone 1 was associated with a flat F0 contour,and Tone 2 with a rising F0 contour.
For example,F1 acoustic parameters have developmental and gender changes in vowel production in Mandarin-speaking children as found by Chen et al.[21].Formant frequency analysis of Chinese vowels were compared between tongue carcinoma patients(before surgery and 3 months,9 months,and 2 years after surgery)and a control group in Liang[27].However,a few studies have established vowel space and analyzed the position of articulators in Chinese Mandarin vowels across tones.Unfortunately,so far,there is no documented formant frequency of Chinese Mandarin vowels across tones for Chinese young adults.
The present study was a preliminary investigation of the six Mandarin Chinese monophthong vowels produced by native young adult speakers of Mandarin Chinese.The first two formant frequencies were obtained from the vowels,based on which by formant space associated with Mandarin vowels was established.The Chinese Mandarin vowels consist of six monophthongs:/a/,/ɔ/,/e/,/i/,/u/,and/y/.In addition,F1 and F2 values associated with all six Chinese vowels were compared across the four lexical tones of Mandarin.
2 Methods
2.1 Participants
A total of 11 native speakers of Mandarin Chinese(five males,six females)who were international students at Duquesne University participated in the study.They were aged between 23 and 34 years(M=25.64 years,SD=3.67 years).They were included only when all the inclusion criteria were met:(1)they were born in and brought up in the mainland China,and had lived in the mainland China until at least 20 years of age,and(2)they were holders of the Certificate of Putonghua Proficiency Test.The last criterion ensured that all participants spoke native standard Mandarin Chinese.All participants with a history of speech,language,or hearing problem were excluded.Informed consent was obtained from each participant prior to the experiment.
2.2 Data collection
Following a similar research protocol as Hillenbrand et al.[7],the six Mandarin vowels/a/,/ɔ/,/e/,/i/,/u/,/y/produced in a consonant-vowel(CV)syllable were examined.Each of the syllables was produced using four different tones(T1:level tone,T2:rising tone,T3:dipping tone and T4:falling tone),yielding 24 distinctive yet meaningful Chinese words.During the recording,each CV syllable was embedded in a carrier phrase/ðISIZ__/(“这是 __”)(meaning “This is___.”),in order to maintain naturalness of productions.To eliminate possible order effect,the order at which the stimuli were produced was randomized.The participants were instructed to produce all the speech samples using a comfortable loudness level and speech rate.Upon completion of recording,a total of 264(11 participants×6 phrases×4 tones)speech samples were recorded.
Before the formal recording took place,each participant was provided with a brief practice period in order to familiarize themselves with the recording materials and recording environment,as well as to warm up their voices.If an error occurred during recording,the stimulus was produced and recorded again.This process was repeated until an accurate and precise pronunciation was achieved.The recording took place in a sound attenuated room located in the Speech Perception/Production&Innovative Technology Lab(SPPIT)of Duquesne University with the background noise controlled below 20 dB.Audio recording was done using a high-quality condenser microphone which was placed approximately 10 cm in front of participant's mouth[28]via a professional-grade external sound card(PreUSB,M-Audio,USA).Each recorded speech sample was digitized and stored on a Lenovo E450 laptop computer for later analyses.
2.3 Acoustic analysis
Measurement of F0,F1 and F2 was obtained by using a professional acoustic measurement system(Multi-Speech,KayPentax,USA).Multi-Speech provides a time-domain waveform and a frequency-domain wideband spectrogram(filter bandwidth=300 Hz).F0 was determined by counting the number of single vertical lines per time unit(i.e.,cycles per second).Also,the frequencies and relative distinctions of the first two formants(F1 and F2)were darker,rather than dim concentrations of energy.The cursor indicating F1 and F2 was cross-checked on the LPC algorithm,which found two peak points on the waveform that were equivalent to the first two formats.
2.4 Statistical analysis
Microsoft Excel was used to collect all data.All statistical analyses were performed using SPSS 16.0,by Descriptive Statistics,to get the mean and standard deviation of F1 and F2 of Mandarin vowels.The inter-rater and intra-rater reliability measurements from the speech samples were examined by aPearsoncorrelation test.A preset value ofP=0.05 was used to determine for statistically significance.
2.5 Reliability
As human judgment is involved in the extraction of formant frequencies,human bias may exist.To ensure minimum human bias and measurement validity,speech samples of F1 and F2 values were re-analyzed by another investigator to obtain inter-rater reliability.The first and second authors calculated the two measurements using spectrograms and the LPC algorithm.The average absolute error for F1 and F2 inter-rater measurements were 12.59 Hz and 15.68 Hz,respectively.Results of thePearsoncorrelation tests for F1 and F2 were 0.99(P<0.01)and 0.99(P<0.01),respectively,which indicated significantly high inter-judge reliability of the two measurements by the two authors.
In addition,all speech samples of F1 and F2 values were obtained a second time by the first author in or-der to obtain intra-rater reliability.The first author calculated the first and second measurements,which were then used to calculate intra-rater reliability.The average absolute error for F1 and F2 intra-rater measurements were 7.83 Hz and 29.11 Hz,respectively.Results ofPearsonproduct moment correlation tests for F1 and F2 were 0.88(P<0.01)and 0.90(P<0.01),respectively,indicating significantly high inter-judge reliability of the two measurements by the first author.Both inter-and intra-rater reliability indicated that the measurements obtained were reliable and consistent,thus high reliability.
3 Results
3.1 F1 and F2 of the six vowels across all subjects
Average F1 and F2 values associated with different vowels produced by all participants are shown in Figure 1.Each data point represents the F1 and F2 values of each vowel across different tones.It can be observed from Figure 1 that the vowel space of the Mandarin Chinese resembles a triangle,which is distinctive from the quadrilateral shape of English vowels'formant frequencies.Figure 1 indicates that/i/,/u/,and/a/were corner vowels.
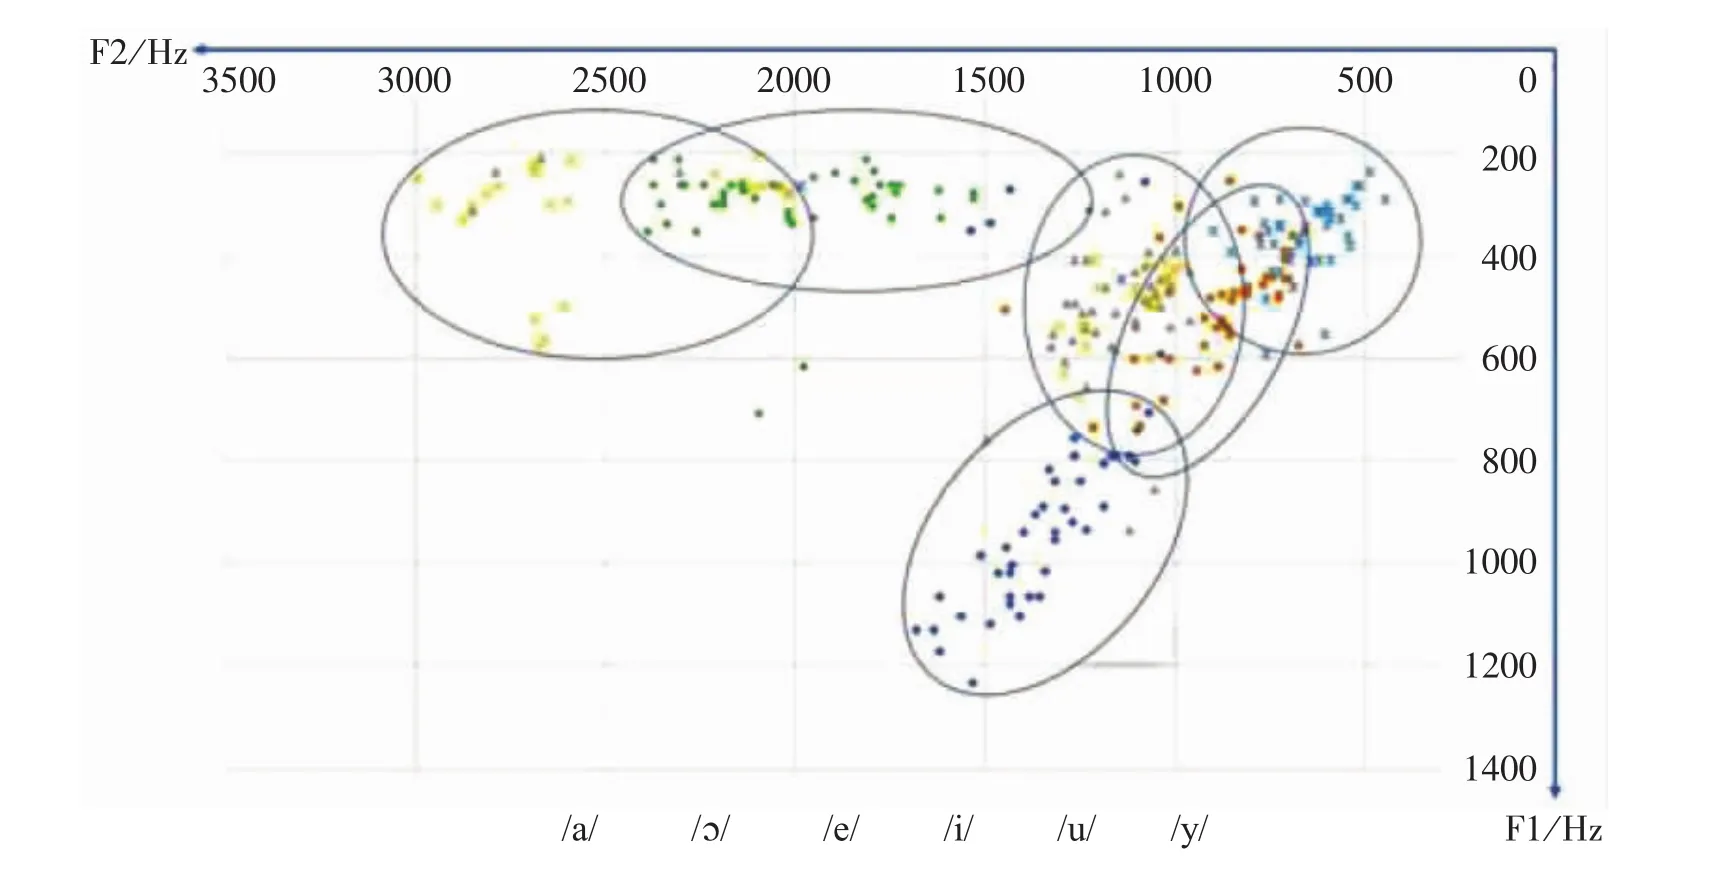
Figure 1 The F2-F1 vowel space containing the vowels across tones produced by all participants was plotted based on the value of F1 and F2 frequencies
3.2 Acoustic analysis of six vowels produced by male speakers
The mean,standard deviation,and range of F1 and F2 values for the six main vowels of Mandarin are showed in Table 1,which are produced by male speakers.It can be seen in Table 1 that the maximum value of F1 was/a/[F1=(828.55±90.65)Hz],whereas the minimum was/i/[F1=(248.30±28.15)Hz).Similarly,/i/was the maximum F2,and/u/was the minimum.As illustrated previously,these three special vowel sounds are found in the corners of the Mandarin triangle(Figure 2).Furthermore,the median values of both F1 and F2 belonged to the sounds/ɔ/and/e/,which are the central part of the triangle(Figure 2).
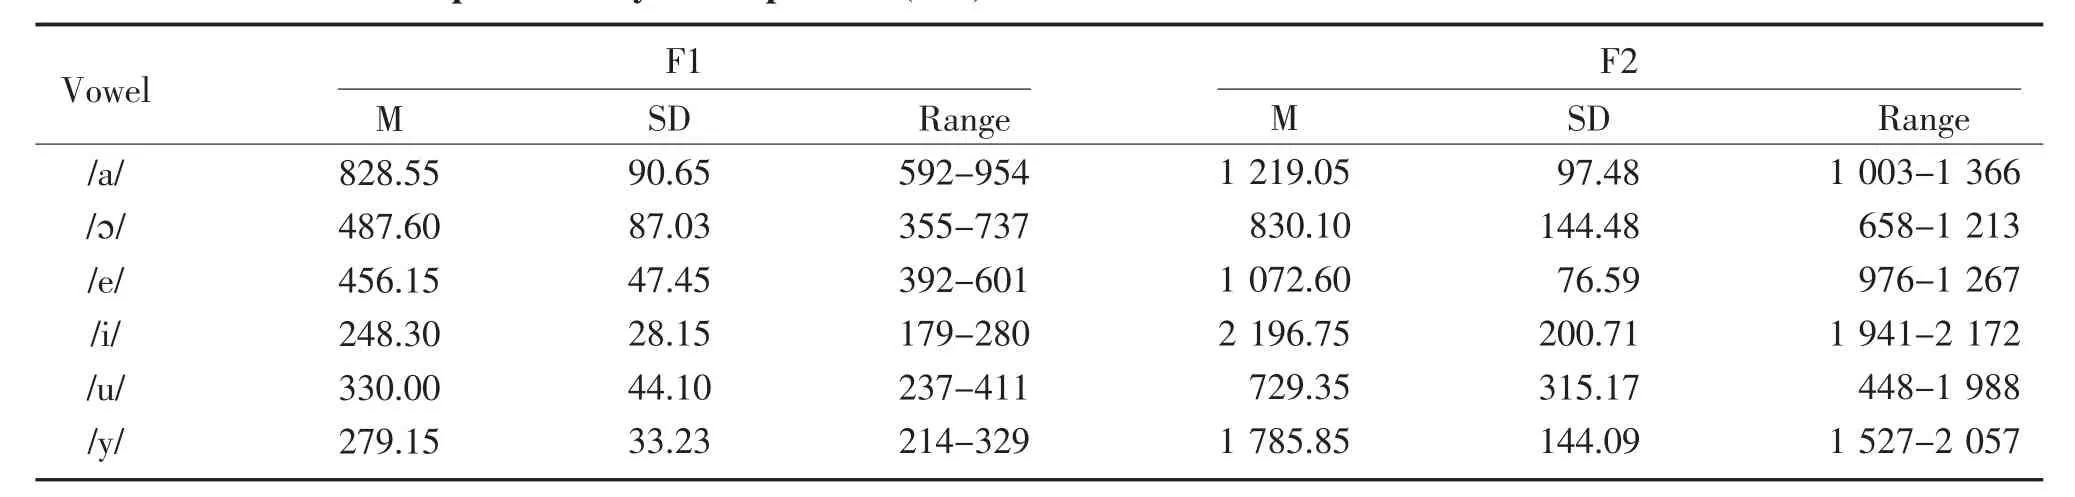
Table 1 Mean and standard deviation values of F1 and F2 formant frequencies of Mandarin Chinese vowels produced by male speakers(n=5)Hz
3.3 Acoustic analysis of six vowels produced by female speakers
Table 2 demonstrated the mean,standard deviation,and range of F1 and F2 values for the six main vowels of Mandarin,which are produced by six female speakers.From Table 1,the maximum value of F1 was/a/[F1=(1 034.75±96.89)Hz],whereas the minimum was/y/[F1=(195.08±41.95)Hz].Similarly,/i/was the maximum F2,and/u/was the minimum.As illustrated previously,these three special vowel sounds are found in the corners of the Mandarin triangle(Figure 2).Furthermore,the median values of both F1 and F2 belonged to the sounds/ɔ/and/e/,which are the central part of the triangle(Figure 2).
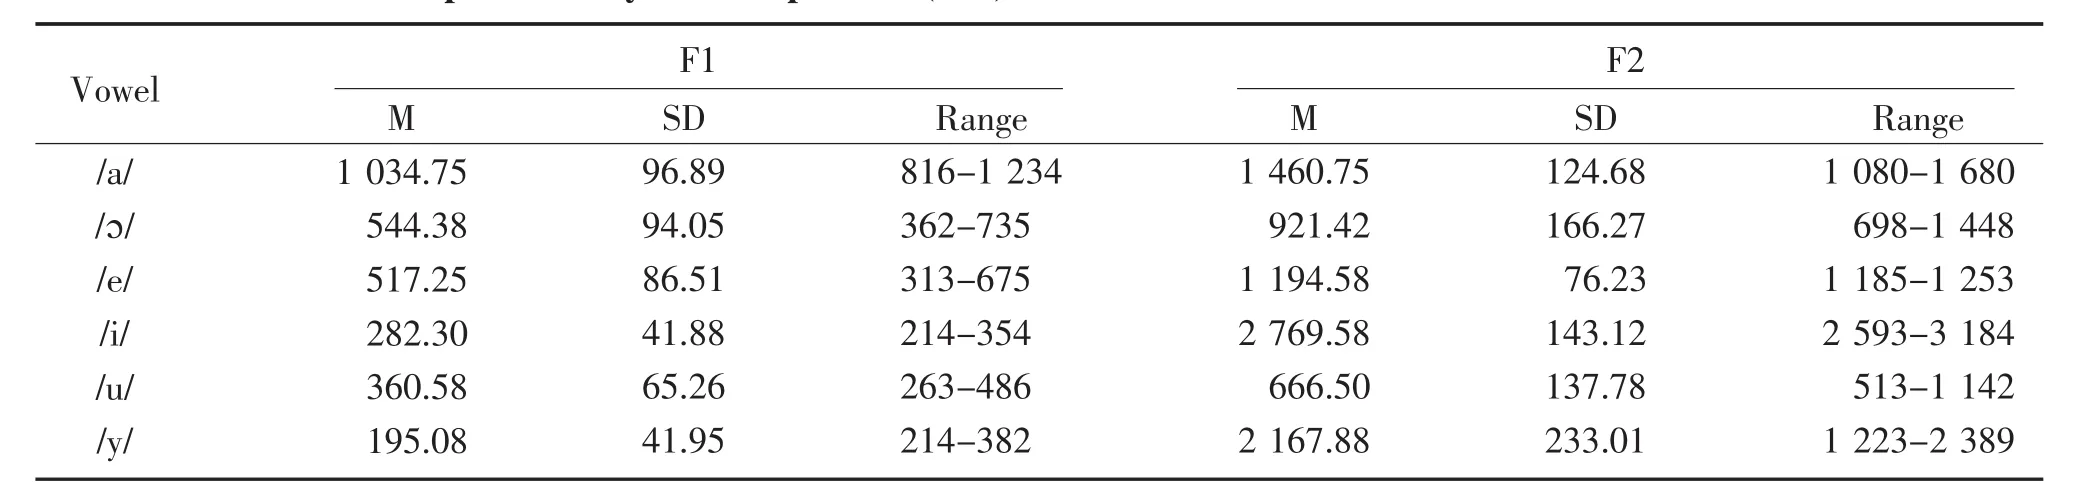
Table 2 Mean and standard deviation values of F1 and F2 formant frequencies of Mandarin Chinese vowels produced by female speakers(n=6)Hz
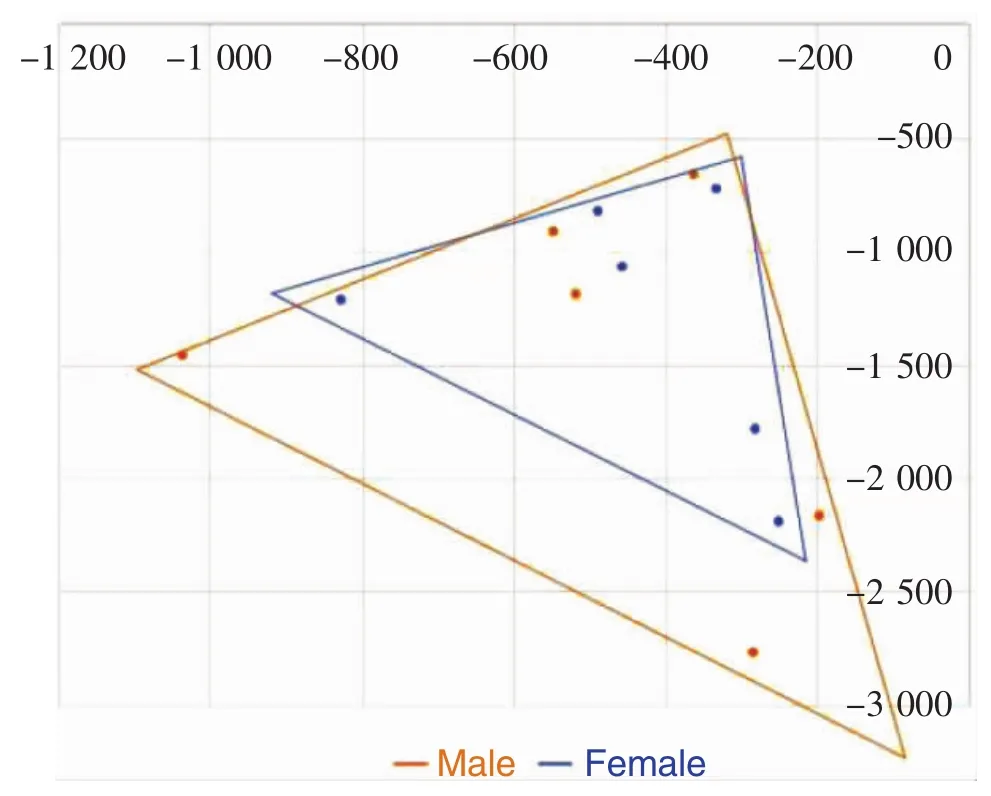
Figure 2 The F2-F1 vowel space was plotted based on the mean F1 and F2 formants frequencies of both male and female vowels
3.4 Acoustic analysis of the vowel/a/across tones
The mean,standard deviation,and range of F1 and F2 formant frequencies for/a/in different tones,produced by all participants,are showed in Table 3 below.Two two-way repeated-measures analyses of variance(ANOVA)were carried out,one for males and one for females,with both vowels and tones being the within measures.For both genders,results indicated a significant interaction effect for tones/a/vowels(P<0.01).Subsequently,several one-wayANOVAwere carried out.A one-wayANOVAtest was used to identify the effect of different tones(Tone 1vs.Tone 2vs.Tone 3vs.Tone 4)on the spectral features of F1 and F2 frequencies.The result of the one-wayANOVAtest displayed no significant difference of the values of F1 and F2 for different tones of the vowel/a/(F1:P=0.125,F2:P=0.989).However,results indicated in Table 2 show that the vowel/a/for level tone(Tone 1)has the lowest mean value of F1 and F2,while T4 for falling tone(Tone 4)has the highest mean value of F1and F2.
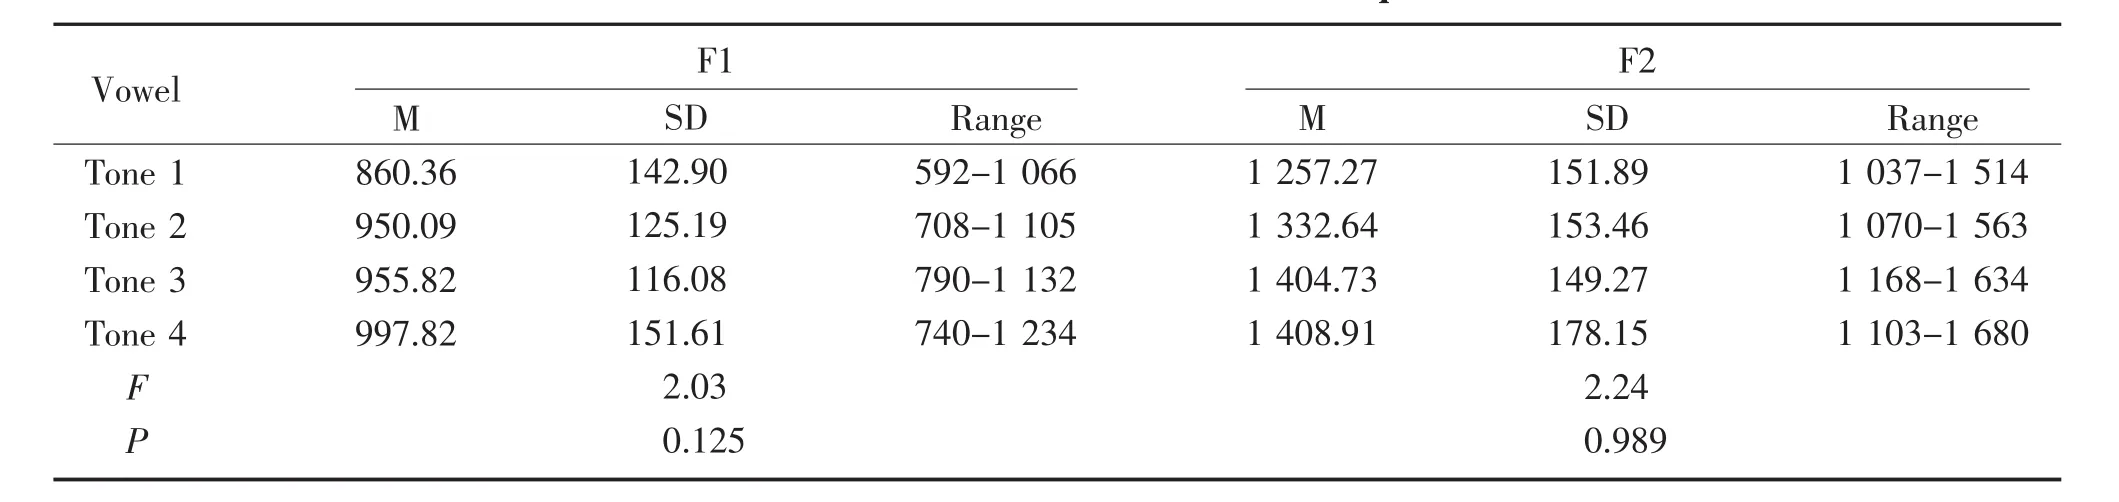
Table 3 Mean and standard deviation values of F1 and F2 formant frequencies of/a/in different tones Hz
3.5 Acoustic analysis of the vowel/ɔ/across tones
Table 4 indicates the mean,standard deviation,and range of F1 and F2 formant frequencies for/ɔ/in different tones produced by all participants.The effect of different tones(Tone 1vs.Tone 2vs.Tone 3vs.Tone 4)on the F1 and F2 frequencies was assessed by a one-wayANOVAtest,which demonstrated that the values of F1 and F2 of different tones for the vowel/ɔ/were significantly different(F1:P=0.004<0.01,F2:P=0.007<0.01).The effect ofanytwo different tone groups(Tone 1vs.Tone 2,Tone 1vs.Tone 3,Tone 1vs.Tone 4,Tone 2vs.Tone 3,Tone 2vs.Tone 4,Tone 3vs.Tone 4)on the F1 and F2 frequencies was tested by the post hoc multiple comparisons(LSD)that showed that the mean value of F1 was significantly higher in the vowel/ɔ/for level tone(Tone 1)rather than for rising tone(Tone 2)and dipping tone(Tone 3)(Tone 1vs.Tone 2:P=0.001<0.01,Tone 1vs.Tone 3:P=0.003<0.01).The mean value of F2 was significantly higher in level tone than in the other tones of the vowel/ɔ/(Tone 1vs.Tone 2:P<0.001,Tone 1vs.Tone 3:P=0.001<0.01,Tone 1vs.Tone 4:P=0.006<0.01).
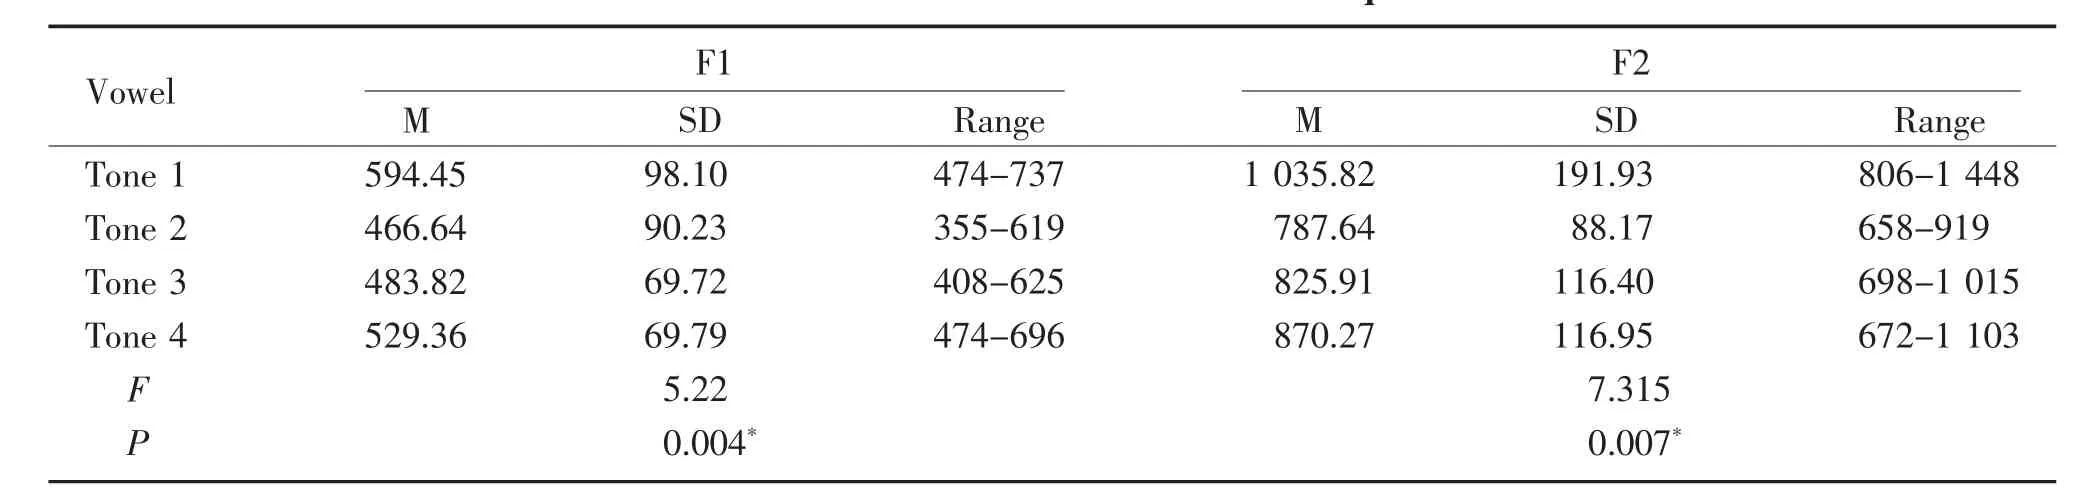
Table 4 Mean and standard deviation values of F1 and F2 formant frequencies of/ɔ/in different tones Hz
3.6 Acoustic analysis of the vowel/e/across tones
The mean,standard deviation,and range of the F1 and F2 formant frequencies for/e/in different tones produced by all participants are shown in Table 5 below.A one-wayANOVAtest was used to determine the effect of different tones(Tone 1vs.Tone 2vs.Tone 3vs.Tone 4)on the spectral features of F1 and F2 frequencies.The result of the one-wayANOVAtest indicated that the value of F1 for different tones for the vowel/e/were significantly different(F1:P=0.016<0.05).However,no significant difference of F2 among different tones of the vowel/e/(F2:P=0.721)was noticed.The effect of anytwo different tone groups(Tone 1vs.Tone 2,Tone 1vs.Tone 3,Tone 1vs.Tone 4,Tone 2vs.Tone 3,Tone 2vs.Tone 4,Tone 3vs.Tone 4)on the F1 frequencies was tested by the post hoc multiple comparisons(LSD),which demonstrated the value of F1 was significantly higher in the vowel/e/for rising tone rather than dipping tone(Tone 2vs.Tone 3:P=0.005<0.01).
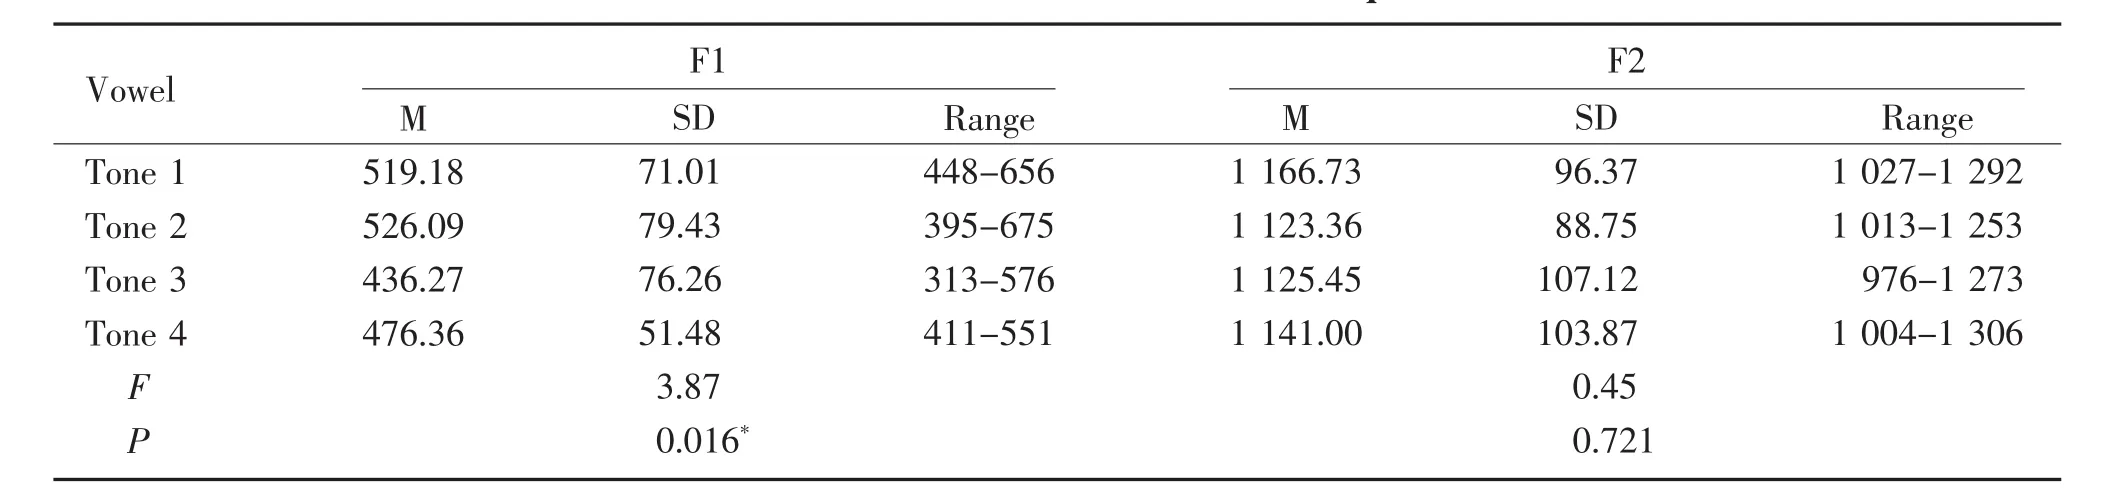
Table 5 Mean and standard deviation values of F1 and F2 formant frequencies of/e/in different tones Hz
3.7 Acoustic analysis of the vowel/i/across tones
Table 5 shows the mean,standard deviation,and range of F1 and F2 formant frequencies for/i/in different tones produced by all participants.A one-wayANOVAtest was used to determine the effect of different tones(Tone 1vs.Tone 2vs.Tone 3vs.Tone 4)on the F1 and F2 frequencies.The result of the one-wayANOVAtest showed that there was no significant difference of the values of F1 and F2 for different tones of the vowel/i/(F1:P=0.895,F2:P=0.936).However,the vowel/i/with level tone had the lowest mean value of F1,while it also has the highest mean value of F2.The vowel/i/with rising tone had the highest mean value for F1,while the lowest mean value for F2(Table 6).
3.8 Acoustic analysis of the vowel/u/across tones
The mean,standard deviation,and range of the F1 and F2 formant frequencies for/u/in different tones produced by all participants are shown in Table 7.The effect of different tones(Tone 1vs.Tone 2vs.Tone 3vs.Tone 4)on the values of F1 and F2 frequencies was analyzed by a one-wayANOVAtest.The result of theANOVAtest demonstrated that there was no significant difference between the values of F1 and F2 for different tones of the vowel/u/(F1:P=0.921,F2:P=0.9081).However,results in Table 7 indicated that the vowel/u/,for dripping tone,has the highest mean value for F1,while it has the lowest mean value for F2.
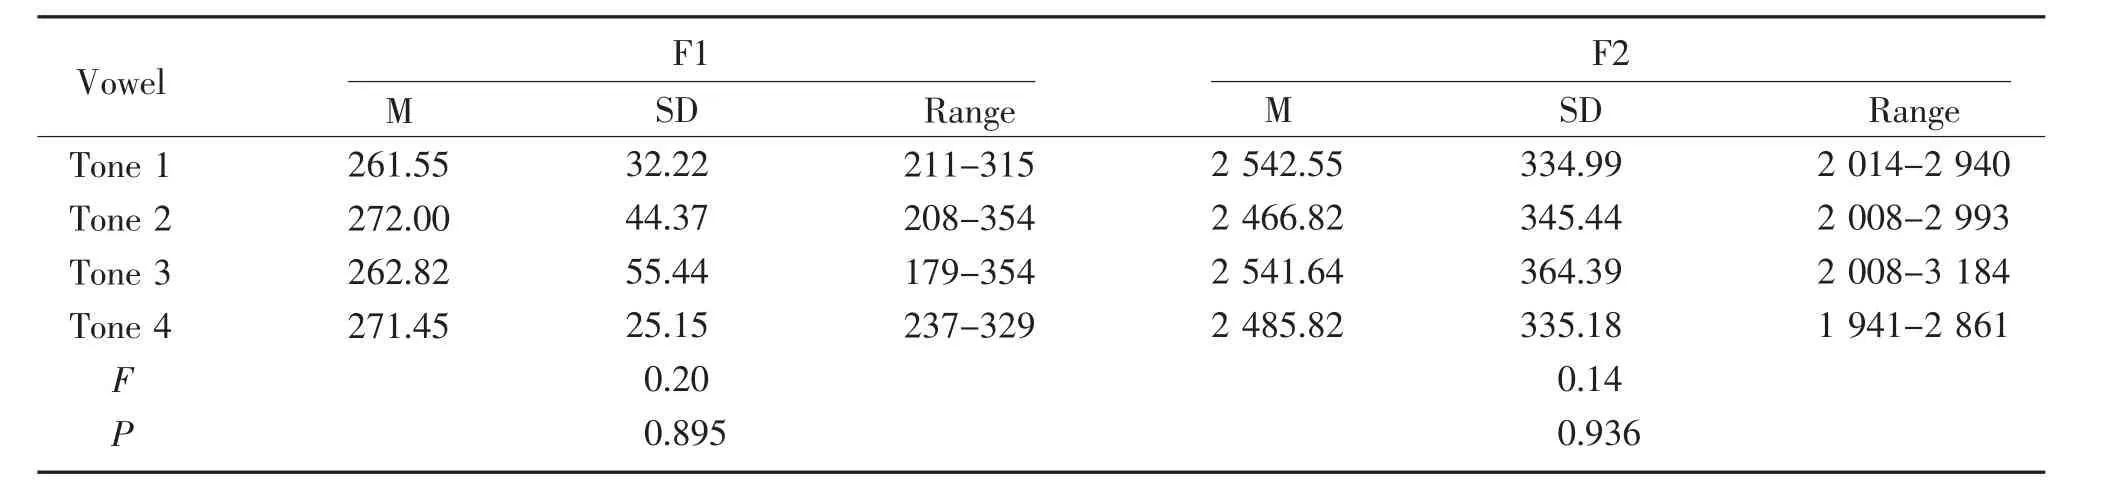
Table 6 Mean and standard deviation values of F1 and F2 formant frequencies of/i/in different tones Hz
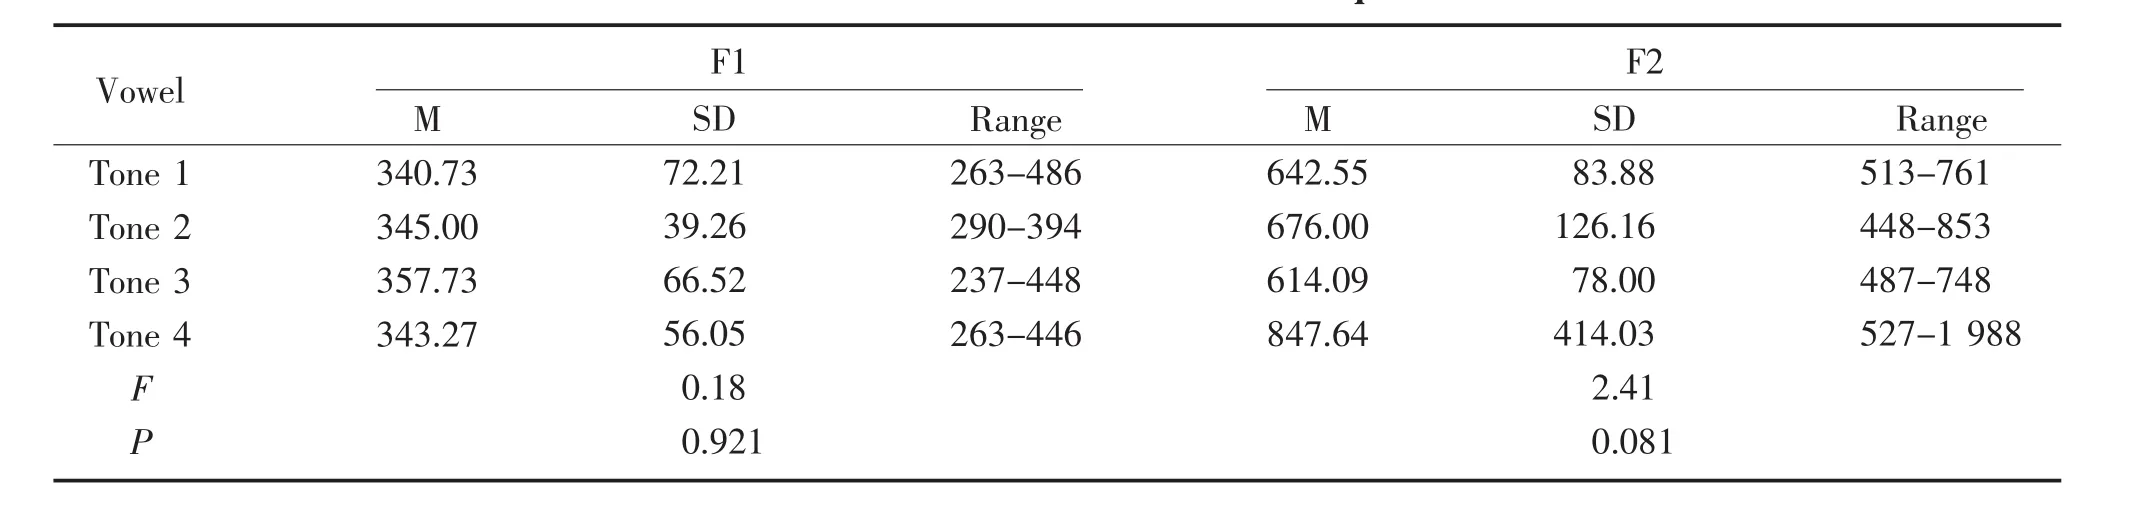
Table 7 Mean and standard deviation values of F1 and F2 formant frequencies of/u/in different tones Hz
3.9 Acoustic analysis of the vowel/y/across tones
The mean,standard deviation,and range of F1 and F2 formant frequencies for/y/in different tones produced by all participants are shown in Table 8 below.A one-wayANOVAtest was used to assess the effect of different tones(Tone 1vs.Tone 2vs.Tone 3vs.Tone 4)on the spectral features of F1 and F2 frequencies.The result of a one-wayANOVAtest indicated that there was no significant difference with the values of F1 and F2 for different tones of the vowel/y/(F1:P=0.114,F2:P=0.754).
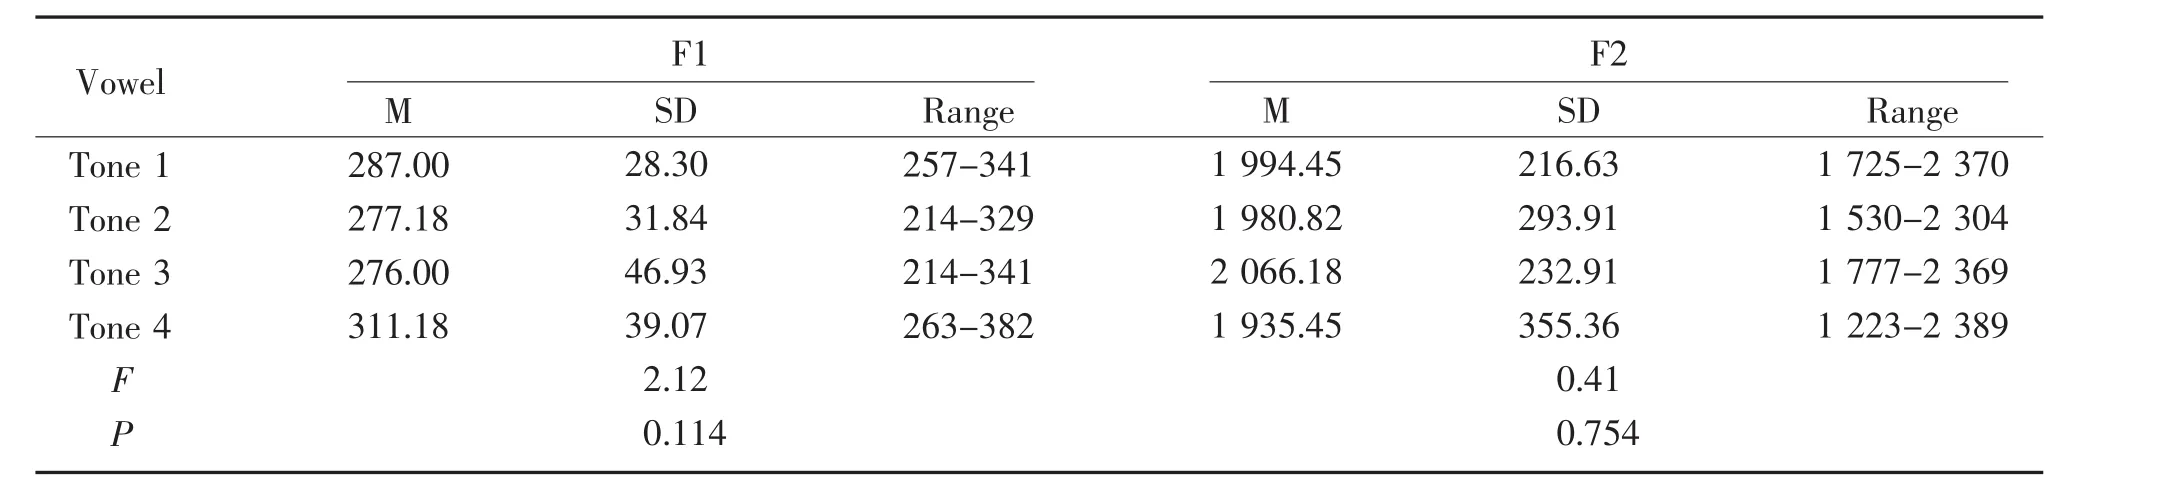
Table 8 Mean and standard deviation values of F1 and F2 formant frequencies of/y/in different tones Hz
4 Discussion
One aim of the study was to identify the characteristics of vowels in Mandarin Chinese.Based on the average format frequencies of F1 and F2 from the 11 subjects,it can be hypothesized that the six main vowels of mandarin form a trilateral on the acoustic vowel diagrams intuitively.The three vowels(/i,u,a/)with extreme values can be located in Figure 2,and are found at the three angles of the triangle,which are distinctive from the quadrilateral formation of English vowels.
The various points of each sound in the diagrams represent the different length of the subjects'vocal tracts,which was determined by tongue contraction and jaw height.According to the findings of other studies,we can primarily conclude that the larger the value of F1,the lower the jaw.Similarly,the larger the value of F2,the less contractive the muscles of the tongue,which means the tongue position is relatively in the front of the oral cavity.If the height of the diagram is divided into partitions corresponding to F1 and F2,the high vowels are/i,u,y/,the mid vowels are/o,e/,and the low vowel is/a/.In the same way,the front vowel is/i/,the central vowels are/y,a,e/,but the/y/is quite close to the front,whereas/e/is near the back,and the back vowels are/o,u/.
The results of the one-wayANOVAtests identified that F1 and F2 did not show a significant difference in the vowels/a/,/i/,/u/or/y/across tones(Tables 3,6,7,&8).These results are in agreement with the study of Shaw[25],who found that some aspects of lingual articulation were stable across tones.In this study,both/a/and/u/were produced at T4(/a/and/y/),and they showed the highest mean for F1 and lowest mean for F2,in contrast to T1,T2,and T3.This indicated when producing/a/with falling tone and/y/with falling tone,the anterior oral cavity became longer,and the posterior oropharyngeal space was much shorter than other tones,as the tongue retracted and the tongue root depressed.However,/i/produced with level tone has the lowest mean for F1 and the highest mean for F2,when compared to the other tones.This indicated that when producing/i/with level tone,the anterior oral cavity was shorter,and the posterior oropharyngeal space was much longer than other tones,as the tongue advances and the tongue root elevated[10,29-30].When the vowel/u/was articulated for dripping tone with the tongue was more elevated and retracted than other tones.This indicated the oral cavity was lengthened,and the posterior oropharyngeal cavity shortened[10,29-30].These results were in agreement with the study of Erickson[31]who reported that when producing the Tone 3 compared to the Tone 1,the tongue and jaw are more retracted.This can be explained by a general rule in acoustic-articulatory relationship,that the F1 frequency varies inversely with tongue height,and F2 varies inversely with tongue advancement[29].
Statistical analyses showed that there were significant differences between the vowels of/ɔ/and/e/across tones for F1 and F2(Table 4 and 5).These findings suggest that production of/ɔ/and/e/across tones was much different in the anterior oral cavity and posterior oropharyngeal placement.For/ɔ/produced with level tone,the anterior oral cavity became shorter,and the posterior oropharyngeal space was much smaller than with other tones,as the tongue blade was advanced and the tongue root was depressed.For/e/,the only significant effect of F1 was found between rising tone and dripping tone.It demonstrated that when producing/e/with rising tone,the posterior oropharyngeal space was much smaller than in other tones,as the tongue retracted and the tongue root depressed more than when producing/e/with dripping tone.
5 Conclusion
This study established a vowel formant space and investigated the first two formant frequencies of vowels across tones in 11 healthy young adult Chinese between 23 and 33 years old.An acoustic vowel space diagram was created showing that/i/,/u/,and/a/are corner vowels,/ɔ/and/e/are in the central part.The six main vowels of Mandarin Chinese are shaped as a trilateral.Statistical analyses showed that there were significant differences in vowels of/ɔ/and/e/across tones in F1 and F2.When/o/with level tone is produced,the tongue could both advance and depress more than with other tones.For/e/with rising tone,the tongue was more retracted than/e/with dripping tone.
The present study is a preliminary acoustic analysis in Mandarin-speaking young adults.Further studies should investigate a larger sample of Mandarin-speaking young adults.The clinicians may obtain references for acoustic assessment of Mandarin-speakers from the data provided in this study.
Acknowledgements
Sincerely gratitude is extended to our eleven Mandarin participants from Duquesne University of Pittsburgh,USA.We are also very grateful to Sarah Leech for her valuable inputs to this manuscript.