Improvement of the ANFIS-based wave predictor models by the Particle Swarm Optimization
Morteza Zanganeh
Department of Civil Engineering, Faculty of Engineering, Golestan University, Golestan, Aliabad Katoul, Iran
Abstract
Keywords: FIS; PSO; Prediction of wave parameters; Lake Michigan.
1.Introduction
Prediction of wind wave parameters such as significant wave height and peak spectral period plays an important role in ocean activities.In that regard, several methods have been presented so far.The first method is empirical formulas suf- fering from some shortcomings for accurately prediction of the wave parameters [1,2].
Due to the complexity of codding and variety of input pa- rameters in numerical models scientists motivated to apply soft computing-based tools to predict wave parameters.The soft computing-based models are types of the tools by which the outputs of a complex system are approximated by finding a relationship between effective input variables involved in the system and the outputs in a black box form.These tools have been implemented by numerous researchers in the field of wave prediction.Artificial Neural Networks (ANNs) as the first soft computing-based tool have been used by many scien- tists to predict wave parameters [3–7].Fuzzy Inference Sys- tems (FISs) as another soft computing-based tools have been employed in prediction of different phenomena in engineering events [8–19].Most of the above studies prove the FISs su- periority to the nonlinear regression approach.Kazeminezhad et al.(2005) employed Adaptive Network -based Fuzzy In- ference System (ANFIS) model for the prediction of wave parameters at Lake Ontario [1].Their obtained results proved the ANFIS model superiority to empirical models like Coastal Engineering Manual (CEM) method.Mahjoobi et al.(2008) also applied ANNs and ANFIS methods for wave hindcast- ing at Lake Ontario [20].Özger and Sen (2007) applied the fuzzy logic to extract the relationship between wind speed and previous and current wave characteristics in the Pacific Ocean [16].Zanganeh et al.(2009) developed a combined Genetic Algorithm and Adaptive Network-based Fuzzy Infer- ence Systems (GA-ANFIS) for predicting wave parameters in the duration-limited condition.Results indicated that the GA-ANFIS model is more accurate than the ANFIS model in which subtractive clustering parameters are generated ran- domly [21].Combined GA-FIS models have been recently used by Zanganeh (2017) to predict wave parameters.In the models, the GA is used to improve FIS-based wave predic- tor models with simultaneous optimization of clustering and fuzzy antecedent and consequent parameters.Results show suitable performance of the model to estimate wave parame- ters including significant wave height and peak spectral period [22].
There are two important difficulties in the application of FIS-based models like the ANFIS for wave prediction.The first one is the extraction of fuzzy IF-THEN rules structure that is not an automatic process in the ANFIS.The second difficulty goes back to tune the shape of fuzzy membership functions and linear parameters of the fuzzy IF-THEN rules at its consequent part TSK FIS (in a Takagi-Sugeno type FIS).These parameters in the ANFIS model are tuned by gradient-based method.Employing meta-heuristic algorithms like Particle Swarm Optimization (PSO) can be beneficial to cope with the above shortcomings.Accordingly, this paper is aimed to apply the PSO for simultaneous optimization of subtractive clustering parameters and the antecedent and con- sequent parameters of fuzzy IF-THEN rules.Three aspects will be considered to optimize fuzzy IF-THEN rules.At First, two PSOs are used to optimize subtractive clustering param- eters and fuzzy IF-THEN rules antecedent and consequent parameters [15].In the second aspect, a PSO algorithm is used to optimize subtractive clustering parameters while the ANFIS model is being used to tune the extracted fuzzy IF- THEN rules parameters.In the third aspect, only one PSO algorithm is used to optimize subtractive clustering and fuzzy IF-THEN rules antecedent and consequent parameters.This is the highlighted contribution of the present paper.Zana- ganeh et al.(2009) employed the first aspect for estimation of equilibrium depth of scour beneath pipelines.The obtained results proved the model superiority to the ANFIS and em- pirical models [21].In this paper, the above three introduced combined FIS and PSO models are employed to predict wave parameters and the performance of developed models is exam- ined against the ANFIS model and empirical methods like the Coastal Engineering Manual (CEM) method at Lake Michi- gan.Low computational cost of the PSO in comparison with the GA [15]inspires the authors to apply the PSO instead of the GA for optimizing the FIS.The most important issue in the models like PSO-FIS is their sensitivity against initial population that make their application tedious.Therefore, ex- perience of operators to apply and develop the models play a crucial rule.In addition, decision variables in the model have no restriction intensifying the complexity of searching process.
In this paper, after an introduction about the application of soft computing-based models to predict wave parameters, the characteristics of the combined FIS and PSO models are pre- sented.Finally, the accuracy of the developed models versus collected data sets of Lake Michigan is evaluated for wave prediction.Improvement of the FIS method with the PSO and vice versa have been proposed by many researchers.Olivas et al.(2014) and Valdez et al.(2016) proposed a model to im- prove convergence and diversity of PSO through fuzzy logic [23,24].In their methods, the PSO parameters are updated dynamically via fuzzy logic.
2.Combined FIS and PSO Models
2.1.Fuzzy Inference Systems (FISs)
FISs may be used as tools to approximate ill-defined nonlinear functions representing complex system behaviors.These tools can assign qualitative aspects of human knowl- edge to approximate the functions.FISs usually contain the following five functional components [25]:
(1) A rule base containing a number of fuzzy IF-THEN rules.
(2) A database defining the membership functions of fuzzy sets.
(3) Decision making unit as the inference engine.
(4) A fuzzification interface which transforms crisp inputs to linguistic variables.
(5) A defuzzification interface converting fuzzy outputs to crisp values.
The architecture of the above five features in FISs has been shown in Fig.1 to estimate a simple function.This is a Takagi and Sugeno’s type (TS) FIS with two inputs includingxandyandfas the output.Given the fuzzy IF-THEN rules to estimatefas the output as follows:

whereA1,A2,B1areB2are fuzzy sets associated with premise input variablesxandy, respectively while,p1,q1,r1andp2,q2,r2are consequent part parameters.The FIS model depicted in Fig.1 is commonly outlined by the following five layers:
Layer 1.in this layer, the membership function associated with each input variable is calculated by the following Gaus- sian membership function:

whereai,ciare adjustable parameters associated with the Gaussian membership function.
Layer 2.this layer is called as the product layer in which previously calculated degrees of memberships are multiplied as follows:


Fig.1.FIS architecture [25].
wherewiis called as the firing strength of rulei,μAi(x)andμBi(y)are the degrees of membership forxandy, respec- tively, while represents the firing strength
Layer 3.in this layer called as the normalized layer the ratio of each weight to the total weights is calculated as follows:

in this layer every node is circle like and labeled asN
Layer 4.this layer is called as the defuzzification layer with adaptive nodes likeiexpressed as:

wherepi,qiandriare the adjustable linear consequent pa- rameters.
Layer 5.in this layer the final output of the network,f, is performed by the summation of all incoming signals as the following expression:

Fuzzy IF-THEN rules parameters of (S) can be divided into two separate sets as:

whereS1is the set of nonlinear antecedent parameters;S2is the set of linear consequent parameters; is the summation operator andSis all mentioned parameters;.
The ANFIS is functionally equivalent to a TSK FIS whose parameters are tuned by using a learning algorithm through available input-output data.In the learning process, the pa- rameters of membership functions for input variables in an- tecedent part of fuzzy rules are optimized using a Steepest Descent (SD) algorithm while, the linear parameters of the output variable in the consequent part are optimized using Least Squares Error (LSE) method.
The LSE method is used in the forward path to optimize consequent parameters by minimizing the error of estimation.In the backward path, the antecedent parameters are optimized by using the SD method evaluating derivation of Mean Square Error (MSE) as follows:

whereEis the MSE;αais nonlinear antecedent parameter,mis the epoch number andηis the learning rate expressed as follows:

whereneis the number of training epochs.
2.2.Subtractive Clustering
Developing a FIS model with minimum number of fuzzy rules would help us to escape from the so-called curse of dimensionality problem.One of the common techniques to extract fuzzy rules is clustering method.For clustering of data sets, several methods could be used such as hard c-mean, fuzzy c-means [26]and subtractive clustering methods [27].The subtractive clustering is a method based on the potential of data points for being cluster centers.In this technique, the data point with the highest potential value is selected as the first cluster center.The potential value for each data point is calculated as follows:

wherePVkis the potential of thekthdata point,Ntrn, is number of data points,ranis the cluster radius associated with thenthdimension of the point, andis thenthdimension of thekthdata point andis thenthdimension of thejthdata point.
Following to determination of potential value for each data point and the first cluster center (xC1) with its associated po- tential (PV∗1), the potential value of each data point (xk) is reduced as follows:

New cluster centers are determined depending upon the ac- ceptance ratioε, the rejection ratioεand the relative distance criterion.A data point with a relative potential value greater than the acceptance thresholdis directly accepted as another cluster center.The acceptance level of data points with relative potential values between the upper and lower thresholdsdepends on fulfilling the following condition:

wheredminis the nearest distance between the candidate clus- ter center and all previously found cluster centers.
In the ANFIS models employed in the study, each cluster center would represent a fuzzy IF-THEN rule.To construct the initial FIS, thenthcolumn of thecthcluster center is as- sumed to be the mean value (cin) of the associated Gaussian membership function defined for theithfuzzy linguist param- eter of thenthinput variable.The standard deviation (ain) of the above-mentioned Gaussian functions for input variable is calculated as follows:

2.3.Particle Swarm Optimization
Meta-heuristic algorithms such as the PSO algorithm are robust algorithms well-suited for optimization of discontinu- ous and multimodal functions.These techniques work based on parallel searching to extract favorite answer for a problem with respect to fulfilling required subjections.The PSO is a member of the wide category of swarm intelligence methods to solve global optimization problems.It was originally pro- posed as an optimization method in the simulation of social behavior.PSO is related to artificial life, swarming theories and evolutionary computing, especially evolutionary strategies and genetic algorithms [28].
This model is firstly inspired by the metaphor of social interaction observed among insects and animals.The kind of social interaction modeled within a PSO is used to guide a population of individuals (so called particles) moving towards the most promising area of the search space.According to the global PSO algorithm, each particle moves towards its best previous position and toward the best particle in the whole swarm [29].
In a PSO algorithm, each particle is a candidate solution equivalent to a point in aD-dimensional space, so theithpar- ticle can be represented asxi=(xi1,xi2,...,xiD).Each particle flies through the search space, depending on two important positions,pi=(pi1,pi2,...,piD), the best position for the par- ticle has found so far (pbest); andpg=(pg1,pg2,...,pgD), the global best position identified from the entire population or within a neighborhood (gbest).The rate ofithparticle’s position change is given by its velocityvi=(vi1,vi2,...,viD).
The following equations update the velocity and position of each particle in the search space as follows:

whered= 1, 2,...,D;i= 1, 2,...,N, andNis the size of the swarm;χis a constriction factor used to optimize constrained problems in order to control the magnitude of the velocity (in unconstrained optimization problems it is usually set equal to 1.0).ωis calledinertiaweight;c1andc2are two positive constants, calledcognitiveandsocialparameters;r1,r2are random numbers uniformly distributed in [0,1]; andn= 1, 2,..., determines the iteration number [30].
Experimental results indicate that it is better to initially set the inertia to a large value, in order to promote global explo- ration of the search space, and gradually decrease it to get more refined solutions.Thus, an initial value around 1.2 and a gradual decline towards 0 can be considered as a suitable choice forw.At every iteration, the PSO updates the inertia weight using the following equation:

wherewiteris the iteration’s inertia weight,itermaxis the max- imum iteration number andwmaxandwminare the maximum and minimum inertia weights, respectively.Recent works re- port that it might be better to choose a larger cognitive pa- rameter,c1, than a social parameter,c2, but withc1+c2≤4[31].
2.4.The Combined Models
As mentioned before, three aspects are taken to optimize a FIS models with PSO algorithm.The first aspect is related to the model in which one PSO is used to optimize cluster- ing parameters while another PSO is employed to optimize fuzzy antecedent and consequent parameters.In other words, the parameters of a FIS to map input values to desired out- puts are optimized by the two PSOs in order to minimize the total prediction error.This model in this study is called as the PSO-FIS-PSO model while Fig.2 shows its flow di- agram.The main drawback of this kind of model may go back to the application of two embedded PSO.In this model, the user is not able to control and tune parameters like ini- tial population, cognitive parameter,c1, social parameter,c2..Determination of the parameters especially initial population because of domain-irrelevant behavior of the FISs plays a crucial role.This cannot easily be achieved in this model.
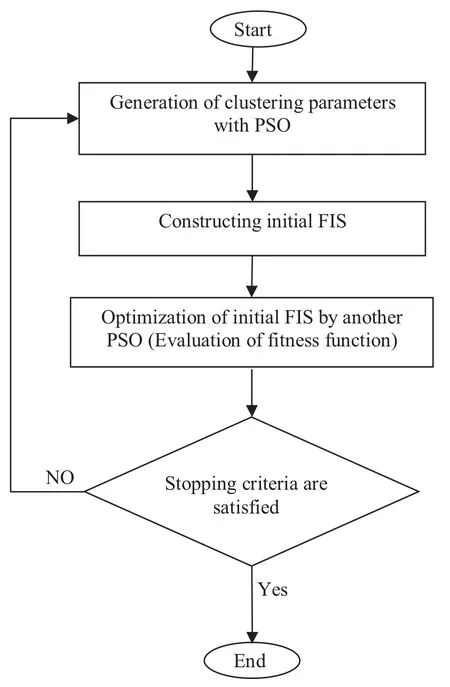
Fig.2.Flow diagram of the PSO-FIS-PSO model.

Fig.3.Flow diagram of the PSO-ANFIS model.
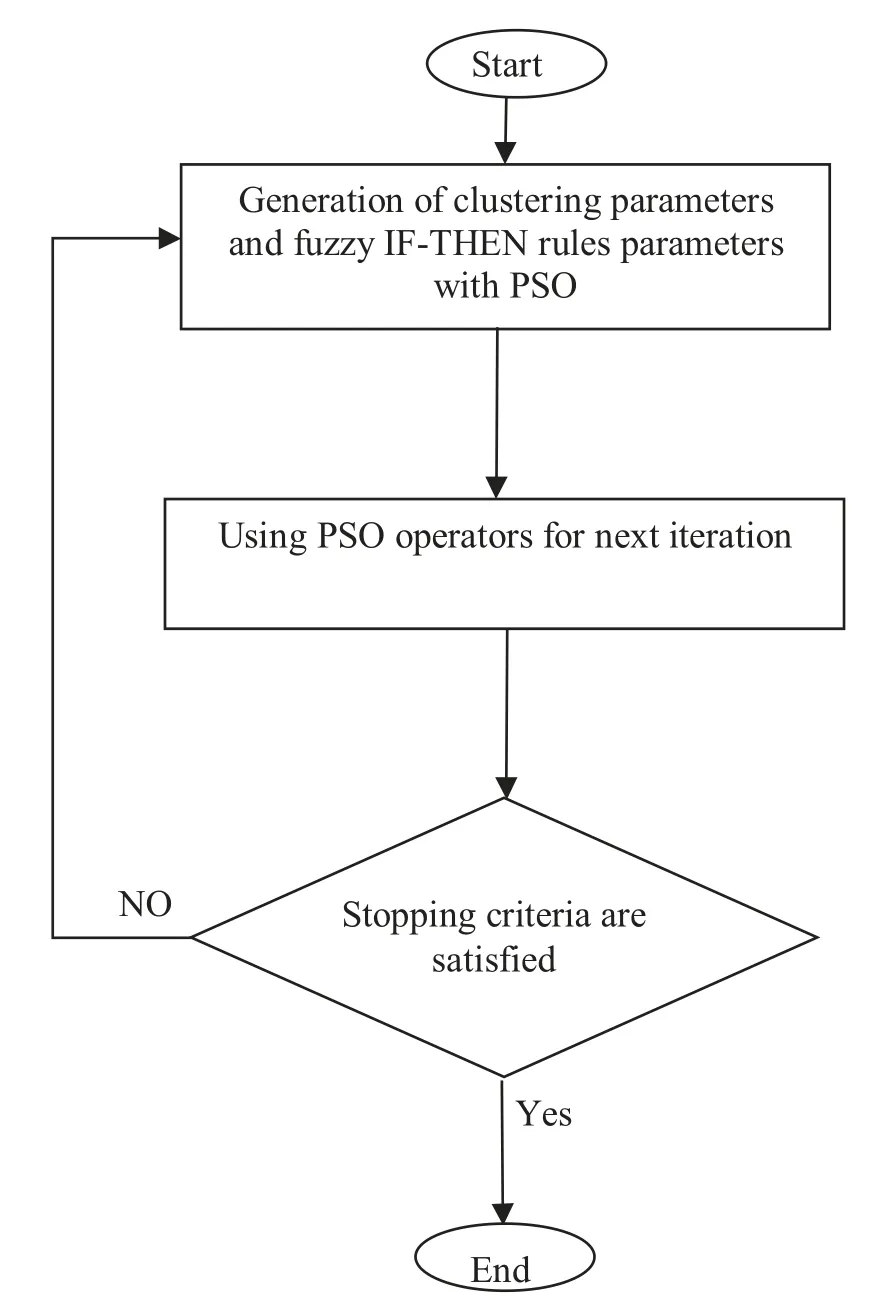
Fig.4.Flow diagram of the PSO-FIS model.
The second aspect is related to employing the PSO al- gorithm to optimize subtractive clustering parameters while the ANFIS model introduced by Jang (1993) is implemented to optimize the extracted fuzzy IF-THEN rules by the PSO algorithm.This model is called as PSO-ANFIS while Fig.3 shows its flow diagram.In this kind of model also controlling the ANFIS parameters like epoch number is difficult.This is because of working two embedded models like PSO and AN- FIS models in a successive manner.On the other hand, in this model the ANFIS local search behavior capability coupled with global searching behavior of the PSO model may in- crease model exploration and exploitation performance.Final decision about these characteristic of the PSO-ANFIS model to predict wave parameters can be made after its application.In the third aspect, only one PSO model is used to opti- mize subtractive clustering parameters and fuzzy antecedent and consequent parameters.This model is called as PSO-FIS model while Fig.4 shows its flow diagram.As it is shown in the diagram in this model only one PSO is used to optimize FISs in which supervising the PSO parameters are met easily.Therefore, this model may be superior to the PSO-FIS-PSO and PSO-ANFIS models.
The objective function of the PSO optimizer models is the minimization ofRootMeanSquareError(RMSE).Formula- tion of the objective function for approximating a function withzas the output andx,yas input variables has been outlined in Fig.5 whereranis the clustering radius for thenthpremise or consequent variable(n= 1,...,D)andraminnis the minimum clustering radius for thenthvariable.This minimum value is used to prevent from the firing strength values to become zero in Eq.2.MaxNumrule, is the maxi- mum number of fuzzy rules which is determined based on the prediction errors for training and validation data, i.e.RMSEtrnandRMSEvalidation.Note that in these forms of the PSO ap- plication for optimizing fuzzy IF-THEN rules, the number of the antecedent and consequent parameters are related to sub- tractive clustering parameters.Therefore, the number of the decision variables changes during running the PSO model, al- thoughMaxNumrulerestricts the number of rules.Also, the data set used to train the model is divided into two categories.The first category is the training data sets directly used in the learning process.The second category is the validation data used to avoid overtraining problem.

Fig.5.Objective function of the PSO model.
3.The study Area

Fig.6.The map of Lake Michigan with the location of buoy 45007.
As mentioned before in this paper the combined FIS and PSO models are implemented to predict wave parameters at Lake Michigan.This lake is one of the five Great lakes in North American.The collected data by National Data Buoy Center (NDBC) at station 45007 of the lake ( Fig.6 ) are used to develop the wave predictor models.This station is located at42°4030"N,87°0130"Wwhich is 176.4m deep.Also, the maximum measured peak spectral period is 7.3s; thereby prevailing deep water condition is met.The selected data set belong to the periods of March to January, 2001 and from Jan- uary to December, 2013; with 1-hr intervals.Wind and wave data was gathered by a 3-m discus buoy.Wave data were mea- sured in 20 min at 1 hour intervals with a sampling frequency of 2.56 Hz while wind data were collected for 8 min at 1 hour intervals at a frequency of 1.28 Hz.The wind speed was mea- sured at a height of 5 m above the mean sea level.The buoy measured and transmitted barometric pressure; wind direction, speed, and guest; air and sea temperature; and wave energy spectra.Significant wave height, dominate wave period and average wave period were derived from wave energy spec- tra.To measure the wave characteristics, the accelerometers and inclinometers of the buoy measure the heave accelera- tion and the vertical displacement of the buoy hull during the wave acquisition time.Based on the empirical formulas, the wind-driven wave characteristics are mostly functions of wind speed; fetch length and wind duration.
To determine wind duration the constant wind concept pre- sented by the CEM and the SPM manuals is employed.Ac- cording to these manuals the wind duration is the time meet- ing the following criteria.

whereDandUare respectively averaged wind directionand wind speed average in the hours beforeithhour.DiandUiare wind direction and wind speed atithhour, respectively.

Table 1 Statistical characteristics of data sets.
Following to the extraction of constant winds, 1200 hourly data are selected, of which 1080 data points (data set of year 2001) were used as the training set and the remaining (data set of year 2013) were selected as the testing set.Selecting another year for the testing data is for evaluation of the de- veloped model in various climates.From 1080 selected data points 800 data points are chosen as the training data points and the remaining 220 data points are used as the validation data to avoid overtraining of the model problem.The statisti- cal characteristics such as the minimum, maximum, average and range of all data points are reported in Table 1.In the selected interval of the data set the maximum and minimum of the recorded wind speed are 16.22 m/s and 5.75 m/s, re- spectively.This proves that the data set cover a wide range of wind climate at the lake.In the selected interval of the data set the maximum and minimum of the recorded wind speed are 16.22 m/s and 5.75 m/s, respectively.This proves that the data set cover a wide range of wind climate at the lake.
4.The CEM Method
Evaluation of presented approaches against known meth- ods with the same input parameters is beneficial to evaluate the efficiency of the models.In that regard, in this paper so called (Coastal Engineering Manual) CEM method are imple- mented for prediction of wave parameters.According to the CEM manual, wind-driven waves generation process are clas- sified as: fetch-limited; duration-limited and fully developed conditions [32].To evaluate wind generation conditions the real wind duration is estimated as follows:


Fig.7.The RMSE optimized by PSO-FIS-PSO model versus number of iterations (a) for the prediction of significant wave height (b) for the prediction of the peak spectral period.
wheretmin(in second) is the minimum time to meet the fetch- limited condition,Xis the fetch length in meter,gis the gravity acceleration set to 9.81 (m/s2) andU10is the wind speed 10 meter above the sea water level (m/s).Fetch-limited condition is prevailing, if the real wind duration exceeds the wind duration estimated by Eq.18.In this condition wave parameters are estimated as follows:

whereHmois significant wave height,Tpis peak spectral pe- riod,u∗is shear velocity calculated as follows:

whereCDis drag coefficient estimated as follows:

If the wind duration is less than the estimated one by Eq.18 the duration-limited condition is dominant and wave parameters are predicted by estimating the modified fetch length consisting with the real wind duration at Eq.18.In the empirical methods, another condition so-called fully de- veloped condition is considered in the estimation of wave parameters.At this condition, wave parameters are estimated by the following relationships.

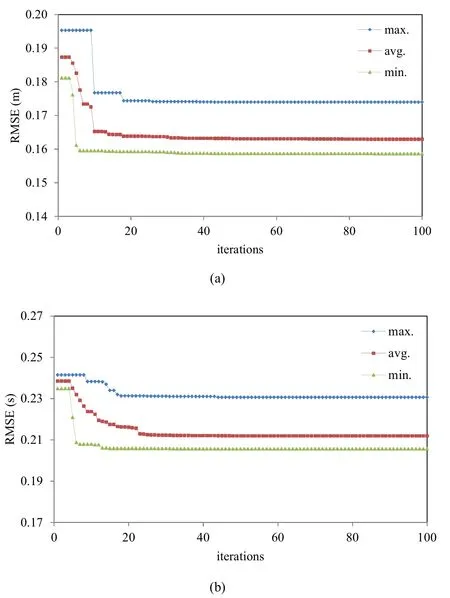
Fig.8.The RMSE optimized by the PSO-ANFIS model versus number of iterations (a) in the prediction of significant wave height (b) in the prediction of peak spectral period.
5.Combined FIS and PSO models for prediction of wave parameters
5.1.Development of models
In this section, the combined FIS and PSO models are employed along with the ANFIS model for prediction of wave parameters at Lake Michigan.Separate models are developed to predict the significant wave height and peak spectral period in each combined model.
Since construction of fuzzy IF-THEN rules is of great im- portance in the application of FIS-based models.In this study, these rules are chosen based on having their lowest similar- ities from the clusters extracted by the subtractive cluster- ing method.The rules are constructed in the way that only linguistic variables at the same levels are chosen (MATLAB GENFIS 2 command that is used to construct initial FIS).For example, “A1” as the first linguistic variable of input variableAmakes a rule with the first linguistic variable of input vari- ableBas “B1”.A sample of fuzzy IF-THEN rules to predict wave height is stated as follows:
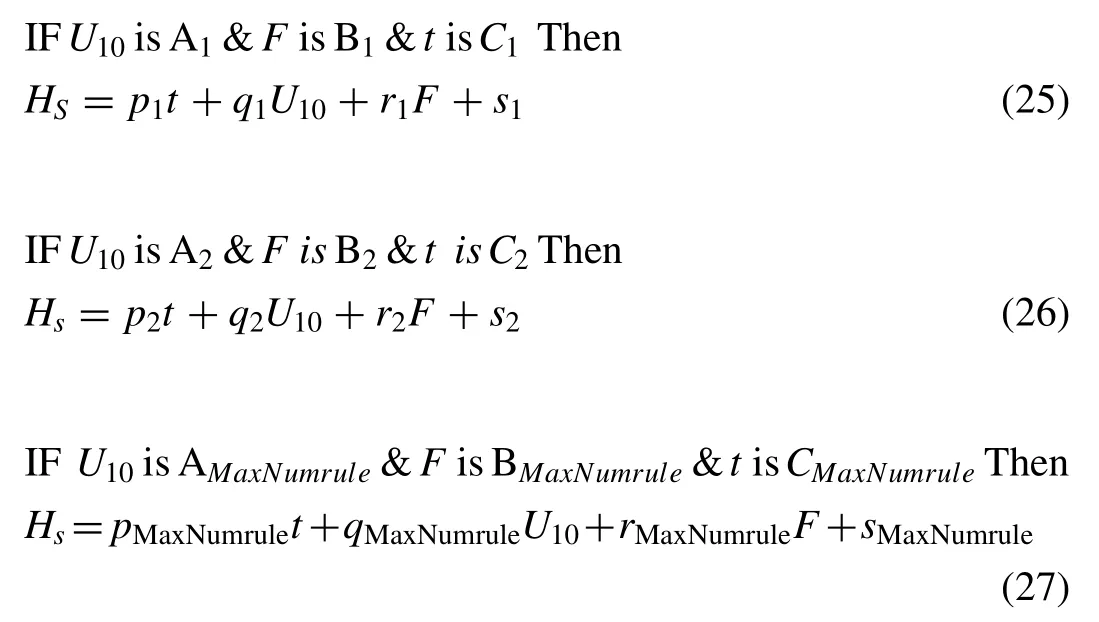
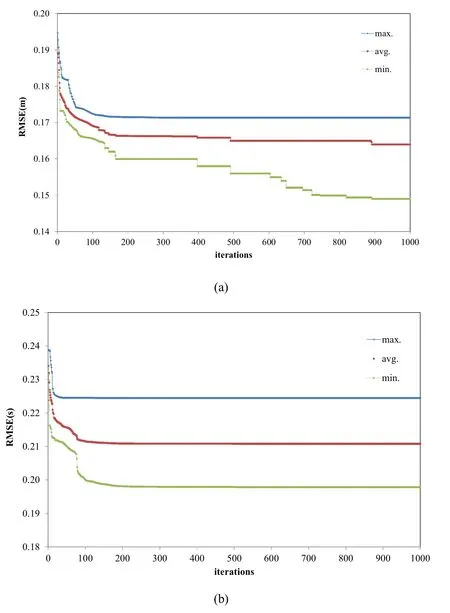
Fig.9.The RMSE optimized by the PSO-FIS model versus number of iterations (a) in the prediction of significant wave height (b) in the prediction of the peak spectral period.
wheretis the wind duration,Fis the fetch length,U10is the wind speed,A1,…,AnandB1,…,BMaxNumrule,C1,…,CMaxNumruleare respectively fuzzy values defined for the wind duration, fetch length and wind speed,Hsis the significant wave height; andpi,qi,riandsiare linear consequent parameters in theithfuzzy rule.MaxNumrule, is maximum rule number.
For our experiments, we used the chosen training; valida- tion and testing data sets in Section 3.As mentioned before, these three subsets are selected randomly to have models with higher generalization capability.
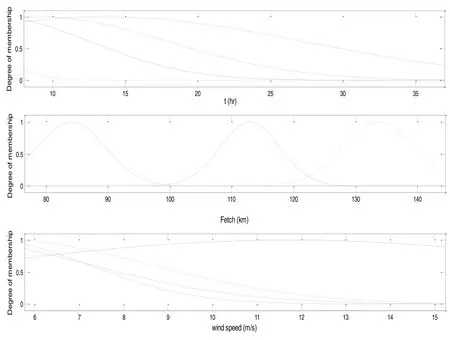
Fig.10.Final fuzzy membership functions appropriate by any input parameters for the significant wave height predictor model.

Table 2 The RMSEs of the PSO-FIS-PSO models in the prediction of wave parame- ters.
To develop the combined FIS and PSO models, firstly the PSO-FIS-PSO model is employed to predict wave parame- ters.In these models the number of initial population for the first PSO algorithm is 20 while, this number for the second PSO algorithm is 300.Also,c1andc2are set to 0.5 for both significant wave height predictor model and peak spectral pre- dictor model.Fig.7 shows the minimization process of theRMSEfor both predictor models.Decreasing tend ofRMSEsminimized by the PSO-FIS-PSO models are shown in Fig.7 (a) and Fig.7 (b) for the significant wave height and peak spectral period predictor models, respectively.This fig- ure shows minimum, average and maximum values ofRMSEerrors obtained from 10 executions of models.Table 2 also reports final errors of the training and validation data sets.As reported in the Table, the PSO-FIS-PSO model for the predic- tion of significant wave height gives an error about 0.153m at its best run for the training data while this error for the vali- dation data is equal to 0.312m.As it is clear from the table the training data error estimated by the PSO-FIS-PSO model to predict peak spectral period is equal to 0.205s whereas, this error for the validation data is about 0.348s.Optimum clustering parameters associated with the best execution of PSO-FIS-PSO models are reported to predict wave parame- ters as follows:
(1) Wave height predictor model inputs-output cluster- ing parameters and quash factor are as the following [rtr,rU10,rF,rHs,ηHs]= [0.151, 0.153, 0.1506, 0.7106, 1.068]where the number of rules associated with them is 4 containing 40 fuzzy antecedent and consequent pa- rameters.
(2) Wave peak spectral period predictor model inputs- output clustering parameters and quash factor are [rtr,rU10,rF,rTp,ηTp]= [0.34, 0.15, 0.739, 0.15, 1.11]the number of rules associated with them is 4 containing 40 fuzzy antecedent and consequent parameters.
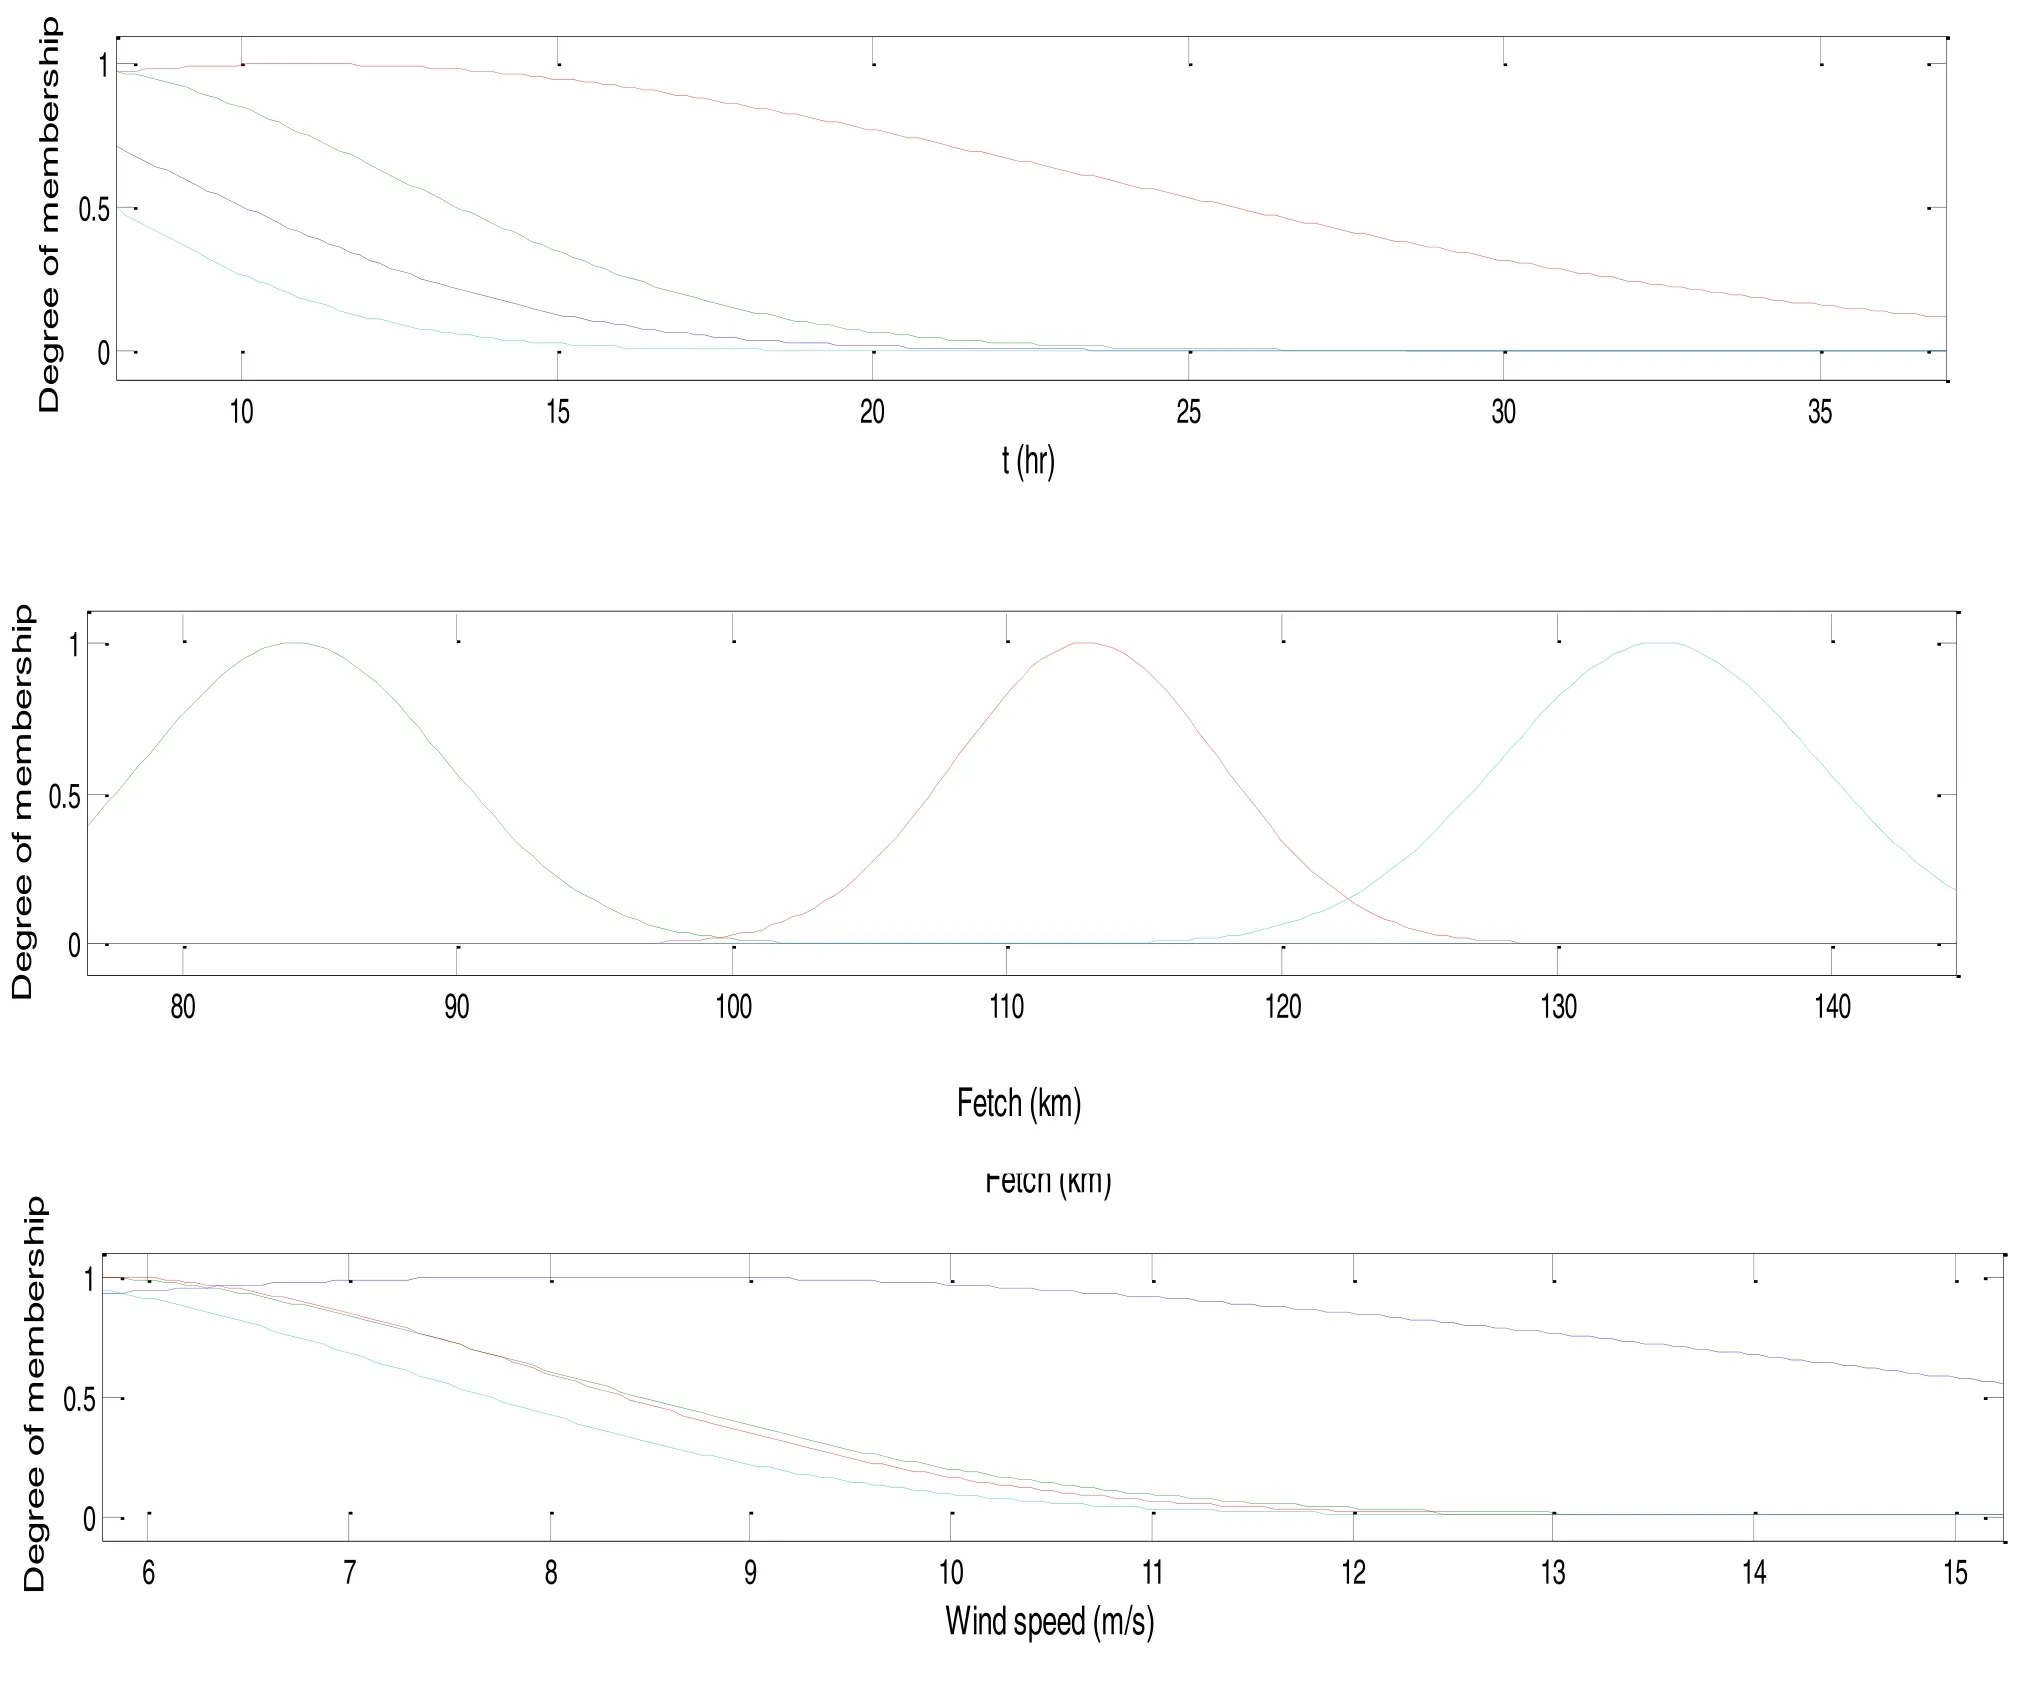
Fig.11.The final fuzzy membership functions appropriate by any input parameters for peak spectral period predictor model.

Table 3 The RMSEs of the PSO-ANFIS models in the prediction of wave parameters.
In the second step, the developed PSO-ANFIS model is employed to predict wave parameters.In these models, the number of initial population for the PSO algorithm is 20.Also,c1andc2are set to 0.5 for both significant wave height predictor model and peak spectral predictor model.Figs.8 (a) and 8 (b) display the optimization process of theRMSEver- sus number of iterations for PSO-ANFIS models to predict significant wave height and peak spectral period, respectively.In this model the epoch number for the ANFIS models is set to 500.As seen from Table 3 , the PSO-ANFIS model for the prediction of significant wave height gives an error about 0.158m at its best run for the training data while this error for the validation data is equal to 0.323m.As it is clear from the table the estimated error for the training data by the PSO-ANFIS model to predict peak spectral period is equal to 0.206s whereas, this error for validation data is about 0.335s.The optimum clustering parameters for prediction of each wave parameters in the PSO-ANFIS models are reported as follows:
(1) - Wave height predictor model inputs-output cluster- ing parameters and quash factor are as the follow- ing [rtr,rU10,rF,rHs,ηHs]= [0.161, 0.157, 0.144, 1.210, 0.961]where the number of rules associated with them is 4.
(2) - Wave peak spectral period predictor model inputs- output clustering parameters and squash factor are [rtr,rU10,rF,rTp,ηTp]= [0.285, 0.163, 0.744, 1.240, 0.781]where the number of rules associated with them is 4..

Fig.12.Predicted values by the PSO-FIS models versus observed values (a) for significant wave heights (b) for peak spectral period.
In the final step, the PSO-FIS model is implemented to predict wave parameters.Figs.9 (a) and (b) display theRMSEminimization versus number of iterations for both PSO-FIS models.In this model, the number of particle is set to 400 while maximum rule number is set 6.Besides, Table 4 reports the validation and training errors for both wave pre- dictor models.As seen from the Table, the PSO-FIS model for the prediction of significant wave height gives an error about 0.149s for its best run for training data while this er- ror for the validation data is equal to 0.294m.Also, as it is clear from the table estimated error for the training data by the PSO-FIS model to predict peak spectral period is equal to 0.197s whereas, this error for validation data is about 0.291s.
The optimum clustering parameters obtained in these mod- els are reported as follows:
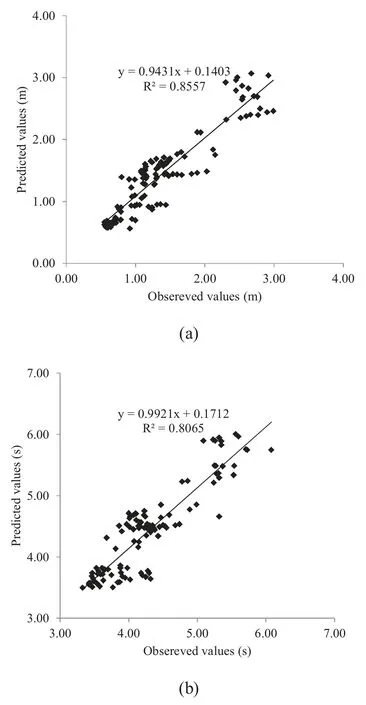
Fig.13.Predicted values by the ANFIS models versus observed values (a) for significant wave heights (b) for peak spectral period.
(1) - Wave height predictor model inputs-output cluster- ing parameters and quash factor are as the follow- ing [rtr,rU10,rF,rHs,ηHs]= [0.451, 0.453, 0.451, 0.313, 0.512]where the number of rules associated with them is 4.
(2) - Wave peak spectral period predictor model inputs- output clustering parameters and quash factor are [rtr,rU10,rF,rTp,ηTp]= [0.34, 0.15, 0.739, 0.15, 1.11]where the number of rules associated with them is 4.
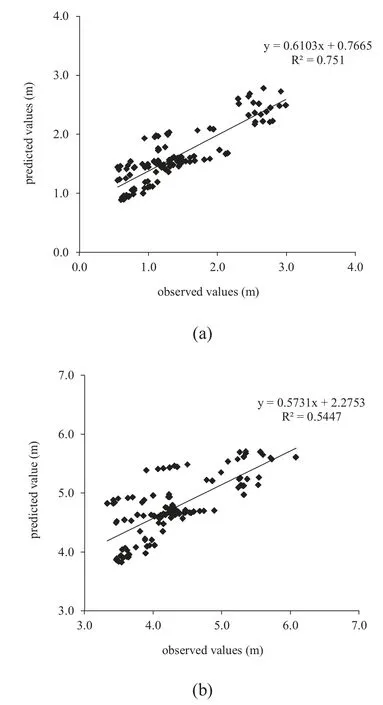
Fig.14.Predicted values by the CEM method versus observed values (a) for significant wave heights (b) for peak spectral period.

Table 4 The RMSEs of the PSO-FIS models in the prediction of wave parameters.
As mentioned above the PSO-FIS model in comparison to the PSO-FIS-PSO model is more accurate.The main rea- son of this finding may go back to the generation of initial population process which is one of the most important issue in such this model.These models are not domain relevant and many decision variables in these models may get various ranges which make the PSO model convergence more diffi- cult.Therefore, supervision to make initial population play animportant role in models performance.One of the disadvan- tages in PSO-FIS-PSO model is not having enough supervi- sion on initial population that make the model convergence premature.About PSO-ANFIS model also entrapping in lo- cal optima is the main reason for worse answer in compari- son to PSO-FIS model.Another reason for this disadvantage may go back to the ANFIS problem against scaling problem.Scaling problem is a kind problem in which gradient-based methods are not able to find the best answer when input variables are not at the same ranges in the soft computing models.

Table 5 The RMSEs of the ANFIS models in the prediction of wave parameters.
One of the main issue about the models developed in this paper is their computational cost.As an example, among the developed PSO-based models, PSO-FIS-PSO model is the most time-consuming model which takes about 4.2 hours for optimizing clustering and fuzzy IF-THEN rules parameters to predict significant wave heights.This time for PSO-ANFIS model is about 1.42 hours while for PSO-FIS model is about 3.95 hours.
Fig.10 and Fig.11 show final obtained membership func- tions of input variables for the both significant wave height and peak spectral period predictor models.The obtained re- sults confirm the performance of the third aspect of FIS and PSO combined model in comparison with the other aspects.
In order to evaluate the performance of developed the com- bined PSO and FIS model it is attempted that the ANFIS model is developed to predict wave parameters.To achieve this, considering the clustering parameters tuned by trial and error process two ANFIS model are developed to predict wave parameters that Table 5 shows its appropriate errors.As seen from the table, the ANFIS model for the prediction of sig- nificant wave height gives an error about 0.171m for training data while this error for the validation data is equal to 0.310m.Also, as it is clear from the table the estimated error for the training data by the ANFIS model to predict peak spectral period is equal to 0.211s whereas, this error for the valida- tion data is about 0.382s.These results prove the superiority of the combined models to the ANFIS models.
5.2.Models evaluation
Following to the development of the PSO-FIS-PSO, PSO- FIS and PSO-ANFIS to predict wave parameters, they should be verified versus testing data not used in the training process.Since PSO-FIS model has got best performance against train- ing and validation data in this sub-section only this model is compared with the ANFIS and CEM model.Scatter dia- grams shown in Figs.12 and 13 indicate the accuracy of PSO-FIS models and their high correlation coefficients (0.8648 for wave height and 0.8162 for wave period).As seen in the figures the models obey the previous trends for the prediction of significant wave height and peak spectral period, success- fully.These correlation coefficients for the ANFIS model are 0.8557 and 0.8065 for significant wave height and peak spec- tral period, respectively.In the CEM method these parame- ters are equal to 0.751 and 0.5447 respectively for significant wave height and peak spectral period as reported in Fig 14.Therefore, it can be concluded that the developed PSO-FIS model can predict wave parameters more accurate than other methods.

Table 6 The errors of the models in the prediction of wave parameters.
To compare the models’ skill, two statistical indexes also were used: theBiasthat shows the mean error caused by over-estimating/underestimating of the observed values; and the Scatter Index (SI)related to the PSOs objective function.These two indexes are calculated by the following equations:

whereOkis the observed value,Pkis the predicted value,Nis number of testing data,is the average value of the observed values andRMSEis Root Mean Square Error.
The results of wave prediction models have been presented in Table 5.From this Table, it can be concluded that the PSO-FIS models are more accurate than the ANFIS and CEM models in the prediction of wave parameters.TheSIof PSO- FIS, ANFIS and CEM are 18.02, 22.13 and 42.85 respectively for the prediction of significant wave height.Also, theSIof PSO-FIS, ANFIS and CEM for the prediction of peak spec- tral period are 7.45, 9.97 and 58.2, respectively.Noticing to theBiasproves the superiority of the PSO-FIS model to the ANFIS and CEM methods ( Table 6 ).
6.Conclusion remarks and future research directio ns
In this paper, the combined FIS and PSO models were pre- sented for prediction of wave parameters.These models were developed in three viewpoints: Firstly, a PSO optimized the structure and number of fuzzy IF-THEN rules in a FIS by finding the best values for subtractive clustering parameters while another PSO model was used to optimize the initial FIS generated by the first PSO model (the PSO-FIS-PSO model).Secondly, a PSO algorithm was used to optimize subtractive clustering parameters whereas; the ANFIS model was used to tune the extracted fuzzy IF-THEN rules parameters (the PSO-ANFIS model).Finally, only one PSO algorithm was used to optimize subtractive clustering and fuzzy IF-THEN rule antecedent and consequent parameters that were the most important innovations of the paper (the PSO-FIS model).The models were used for prediction of wave parameters, i.e.sig- nificant wave height and peak spectral period at Lake Michi- gan.The obtained results showed the satisfactory performance of the proposed PSO-FIS model in comparison to the PSO- ANFIS and PSO-FIS-PSO models.In addition, it was found that the PSO-FIS model was superior to the ANFIS and CEM models for the prediction of wave parameters.
In spite of climate changes empirical methods such as CEM, SPM and so on have not till been updated for sev- eral years.Therefore, it is recommended these formulas are modified either by regression based methods or multi-gene Genetic Programing (GP) model for future works.In addition, development of a more generalized model such as developed models in the paper for all great lakes can be recommended.
 Journal of Ocean Engineering and Science2020年1期
- Journal of Ocean Engineering and Science的其它文章
- Power enhancement of pontoon-type wave energy convertor via hydroelastic response and variable power take-off system
- Application of SWAN model for storm generated wave simulation in the Canadian Beaufort Sea
- Invariant subspaces, exact solutions and stability analysis of nonlinear water wave equations
- Measurement and validation of tsunami Eigen values for the various water wave conditions
- New turbulence modeling for air/water stratified flow
- Numerical simulation of air cavity under a simplified model-scale hull form
