Measurement and validation of tsunami Eigen values for the various water wave conditions
Sudhir Kumr Chturvedi , , Ugur Guven , Pnkj Kumr Srivstv
a Department of Aerospace Engineering, University of Petroleum and Energy Studies, Dehradun 248007, India
b Department of International Affairs, University of Petroleum and Energy Studies, Dehradun 248007, India
c Department of Petroleum Engineering & Earth Sciences, University of Petroleum and Energy Studies, Dehradun 248007, India
Abstract
Keywords: Tsunami Eigen functions; Monitoring; Detection.
1.Introduction
Most of the earthquakes generate tsunami as in the form of P- and N- types of seismic waves.Analytical and numerical models are always the handholding tools for the reporting of tsunamis near to the shorelines.The classical wave the- ory might turn out inappropriate for the model that runs for tsunami generation as well as wave propagation.Leading Dis- persion N-waves (LDN) is assumed like the individual wave having dispersion trough in front that changes properties of individual waves.The dispersion ratio and the dispersive phe- nomenon of the waves carries the significance of dispersive wave number parameterskdfor these kind of waves [4,16].
Tsunami travels with concurrently in the outwards direc- tions from the generating region.Since its generation is due to the underwater explosion, hence, energy movements also take place in the direction of the propagation.The speed of the propagation depends on the depth of ocean.Inside the exposed and wide ocean, they transit at the speed between 500–1000 km/h.These change occurrences take place for the tsunamis propagations from the deep water to the coastline because of nearshore bathymetry as well as coastal mor- phology.The most undeveloped part of the tsunami model- ing is the run-up of the tsunami currents onto the land area [14,15].
Most tsunamis occurrences are due to the sudden shifts of sea bed tectonic plates.Seismic waves have their prop- erties that, they could moves exceptionally high and more than ten times that of the wind generated waves in terms of the wavelengths and velocity of wave’s propagation.The ini- tial disturbance of free water surface lured from earthquakes having huge magnitude is N-waves comprising lengthy wave- lengths along with smaller fluctuation in vertical direction i.e.wave height.For such types of waves, dispersion number is the important parameter due to dispersion numberkdbeingO(10−2) toO(10−1) order.The dispersion numberkdis ap- proximated in between 0.026 to 0.25, for the Indian Ocean tsunami [19,28].Mostly the generation of Tsunamis takes place in the deep ocean due to the underwater plate tectonics movements or shifting of the ocean floor.Therefore, tsunamis are also known as seismic waves.Compared to the wind in- duced waves; seismic waves have higher magnitudes of en- ergy and due to these phenomena, the wave characteristics changes continuously from the origin towards the direction of propagation at every instant of time [11,18].
Tsunamis are the gravity waves which proliferate close to the surface of the ocean.These waves generated in tsunamis are as similar as the normal waves which propagate near to the surface.These kinds of waves have different gener- ation modes and propagation characteristics such as time pe- riod, wavelength and velocity.Tsunami, which have a very long wavelength (10 m to 100 km) always travel shallow water even in deep ocean water depths.Tsunami springs from rapid displacements of ocean surface.The rapid displacements or movements could be underwater explosion, volcanic eruption, undersea landslides etc.Based on the various researches in the past, tsunamis are normally known to be as seismic waves.There are three phases of tsunami developments: creation of the focalized introductory disturbances, evolution close to shore and propagation of waves in exposed ocean and leaves all its energy to the shore from the deep water.The utmost familiar model applicable here for explaining tsunami genera- tion, propagation and flooding in the continuous, shoal water, lengthy wave model which completely oversights the accou- terments of Coriolis force and shore line effects for tsunami long travel [3].Tsunami belongs to the same family as of the ocean waves which could normally be seen on to the beaches.The word shallow water wave explains the wave that has a wavelength higher than ocean base through which it is prop- agating [12 ,30].
When the tsunami waves reach the coast, they shallow and turn more dangerous.Reasonably, the most destructing belongings of natural hazards, but it are essential to save out- look.Tsunamis above a height of one or two meters are un- usual caused by a underwater earthquake of magnitude above toM8.0.On an average, oneM8.0 + earthquake happens per year, across the globe.Among these, 1-in-10 occurs below the ocean through a fault positioning supportive for tsunami generation.Hence, tsunamis which create extensive destruc- tion number of almost three or four per 10 years.While one’s ideas may be cast by infrequent “killer tsunamis”, many more gentle ones are lost in shallow.Presently, bottom pressure sensors can sense a tsunami of a few meters fluctuations in the open sea.The reasonable ( ≈M6.5) earthquakes can bear waves of this size, “baby” tsunamis happen numerous periods per year.Except by scientists’ observations, these are usually unobserved.At hand when a tsunami occurs is the physics surrounding the tsunami and its waves.The structure of the earth’s bedrock, how the tsunami was created, and the topog- raphy of the ocean floor all contribute to a particular tsunami’s characteristics.It is therefore necessary that these factors are explored in order to understand a tsunami and its properties [9,10].
The classification of deep and coastal water waves are identified using the respective correlations between water depth (d) verses wavelength (L).Ifd/L<1/20, water is known as shallow water condition.If ratio varies from 1/20 to 1/2, water is known as intermediate water.If the ratio is more than1/2, the oceanic region is defined as to be for deep water.Howsoever, the Tsunami waves generate from deep ocean and reaches to the coastal regions.The impact at the coastal region is extremely high because a significant wave height increases to the maximum extent due to the vari- ation of bathymetry geophysical tectonics [1,2,13].Tsunami travels with concurrently in the outwards directions from the generating region.Since its generation is due to the underwa- ter explosion, hence, energy movements also take place in the direction of the propagation.The speed of the propagation de- pends on the depth of ocean.In deep and exposed ocean, they travel at the speed of 500–1000 km/h.The change occurrences take place for the tsunamis propagations from the deep water to the coastline due to the nearshore bathymetry and shore- line morphology.The most undeveloped part of the tsunami modeling is the run-up of the tsunami currents onto the land area [20,21].For the practical applications, linear kdv equa- tion and the Boussinesq equations are much suitable for mod- elling the wave propagation in exposed ocean [22,24]when waves propagate to the near shore area and run-up on the beach, nonlinearity plays an important role.Tsunami execu- tion and propagation was also measured on hydrophones or seismometers in which the analysis have been carried out to provide a wide range of time of arrival about 90 to 3000 s.The aspect of Global Positioning Systems (GPS) measure- ments of tsunamis and its surveys have also been carried out this research categories based on the societal responses [23,27].Detailed analysis has been carried out to describe the properties of Eigen functions, which represent the values of wave potential, horizontal and vertical velocity, and accel- eration components with angular frequencies corresponding to the deep, intermediate and shallow water waves.
Analysis and measurement of Eigen functions were also performed.It shows that as distance progresses from the deep to coastal regions, celerity reduces due to increment in sig- nificant wave heights [25]
2.Objective and scope
•To compute and analyze the Tsunami wave parameters such as Eigen functions in terms of its angular velocity, orbital velocity, orbital acceleration, celerity of the waves and wave potential in deep, intermediate and shallow water regions.
•The overall scope of this work is to achieve the certain conclusion that, if the early warning systems can be de- signed and implemented, the concerned authority can be able to take the quick action against the region of interest, which has been affected due to the waste tsunami disasters.
•The basic fault parameters of Tsunami generation such as fault length, width, area and displacement would be calcu- lated with respect to the impact of earthquake magnitude.
•The measurement and analysis of tsunami Eigen functions such as orbital velocity, acceleration, wave potentials in the direction of propagation, vertical and resultant directions would be carried out using Airy’s wave theory.
3.Methodology
The detailed layout of the execution of the objectives is as shown in Fig.1.The flow diagram shows the method to compute and analyze the tsunami wave parameters based on the Eigen function study and computation of fault parame- ters.The detailed algorithmic analysis and explanation for the both approaches are mentioned in this unit.Various empirical equations are followed upon to validate the flow chart.
3.1.Algorithm for earthquake fault parameter calculation
The overall life time of the tsunami comprises the gener- ation from underwater earthquake or landslides, propagation in exposed ocean, run-up from deep to near shore ocean regions and perhaps breaking during the propagation on slope beaches.The main objective of this part of the study is analyze the physics and engineering happening near to the earthquake before its comes to the surface water waves generations.The earthquake parameters determine most of the characteristics of the tsunami wave’s generations [7,8].
Fault length (l), width (W), area (A) and displacement (D) are expected to signify in relationships of the following ob- served algorithms correlation to earthquake magnitude (M) as mentioned in Eqs.(1) to (4) , respectively.


Fig.1.Flow chart for the measurement of Tsunami wave parameters.
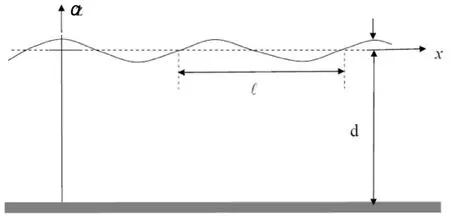
Fig.2.Wave representations in Ocean [5].

3.2.Computational analysis of tsunami wave parameters
Based on the Airy’s wave theory [18,26]can be demon- strated with aid of the following relationships mentioned from Eqs.(5) –( 7 ).
The surface generation for 2-D ( Fig.2 ) waves is as given below:

This correlates the surface elevation (a) angular frequency (ω) and wave number (k=2π/L) in the particular time and space domain.
Ocean waves are said to be under deep condition, ifd/L>0.5 the wave potential function can further be expressed in Eq.(6).

The dispersion relationship for wave conditions is ex- pressed in correlation with bathymetry water depth is pro- vided in Eq.(7) [3].

Where,ωis the angular speed of the wave motion,kis the wavenumber,g= 9.81 m/s2anddis the water depth variation.For deep water condition the equation can be represented asω2=gkastanh(kd)∼= 1.The wave potentials are given for all three water wave conditions, we have derived the mathe- matical equations for orbital velocities and acceleration with the differentiation in the space domain along the direction of propagation and its perpendicular as provided in the various equations in each water levels.
3.2.1.EmpiricalequationfortsunamiEigenfunctionindeepwater
The Eigen functions (xandzdirections) are given in Eqs.(8) –(11) , respectively which represents the distribution for the tsunami wave’s propagation in deep waters (Ward, 2002).

3.2.2.EmpiricalequationfortsunamiEigenfunctioninintermediatewater
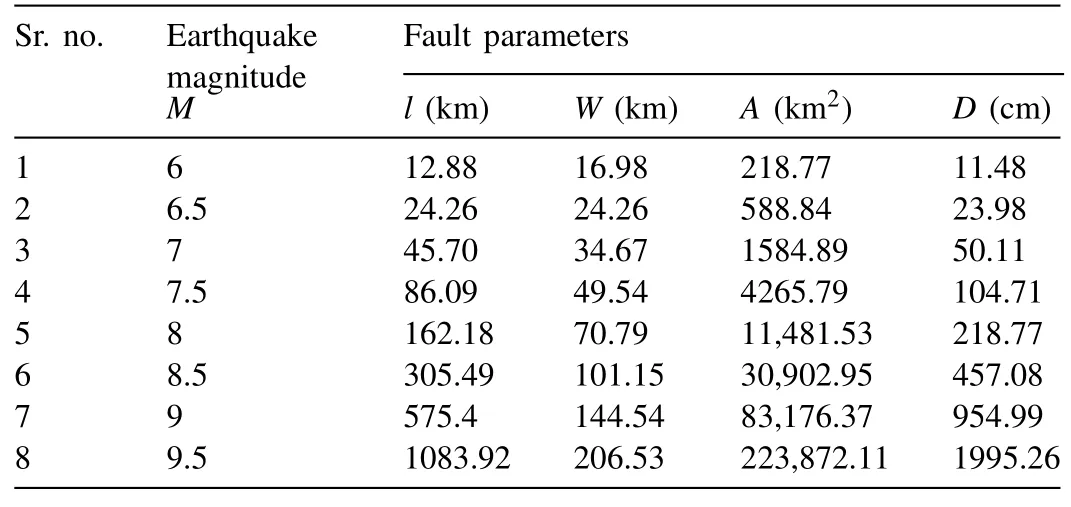
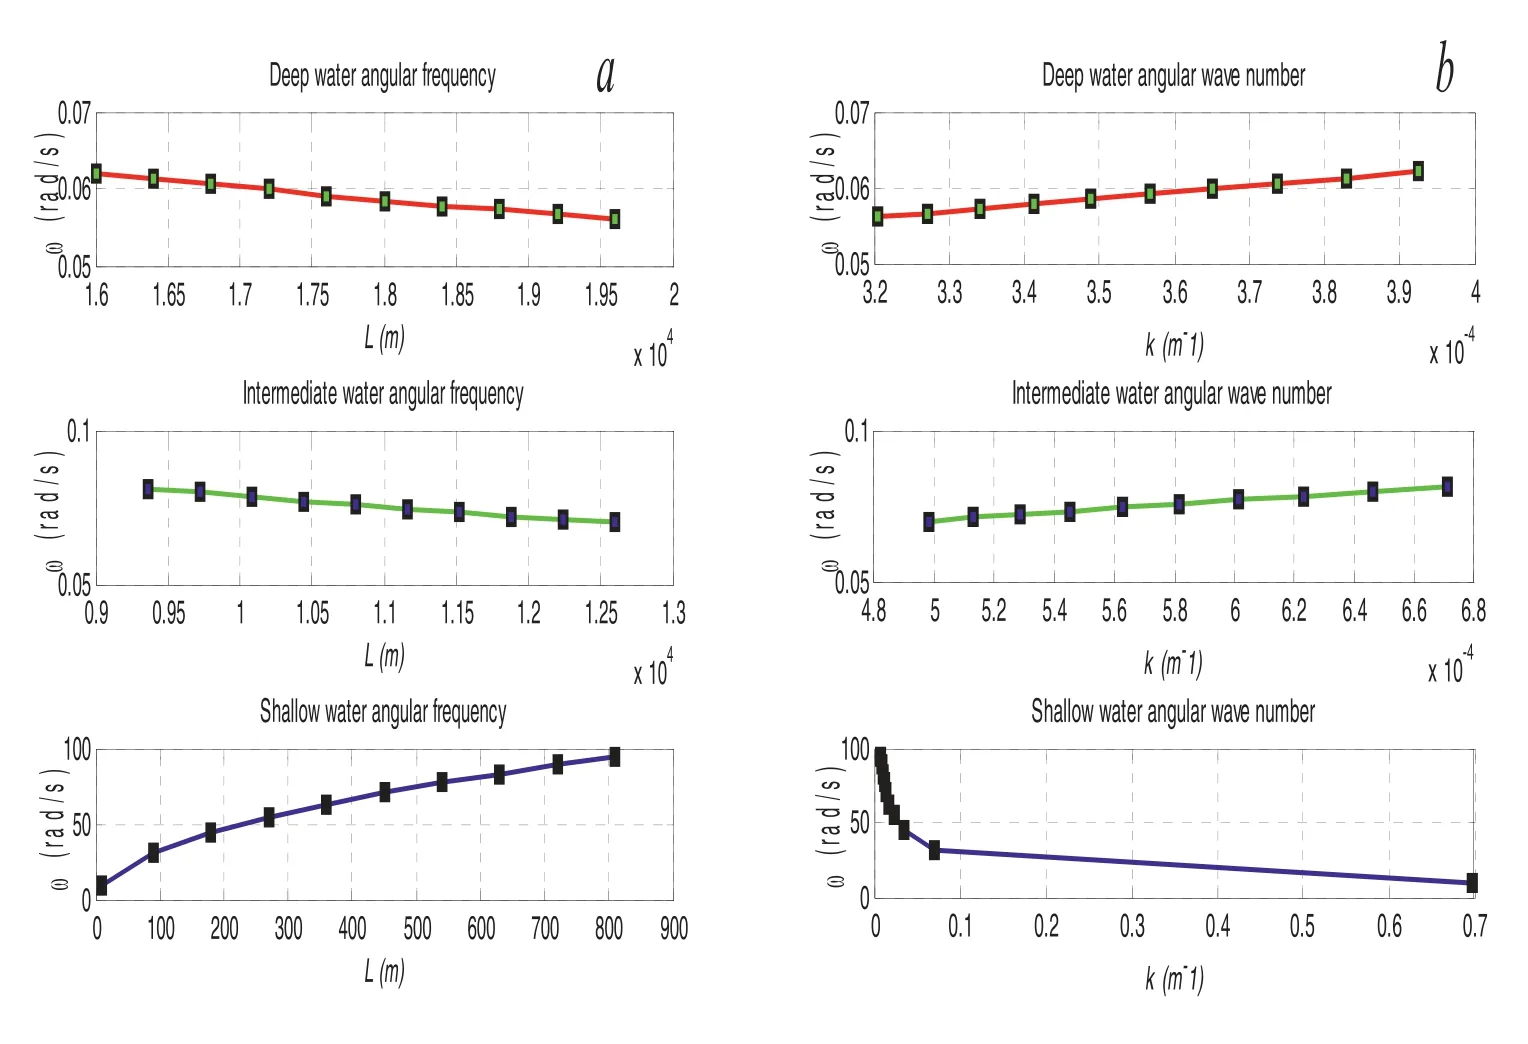
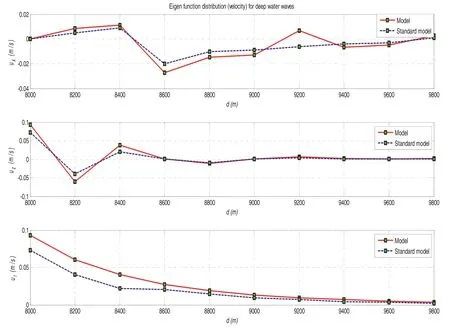
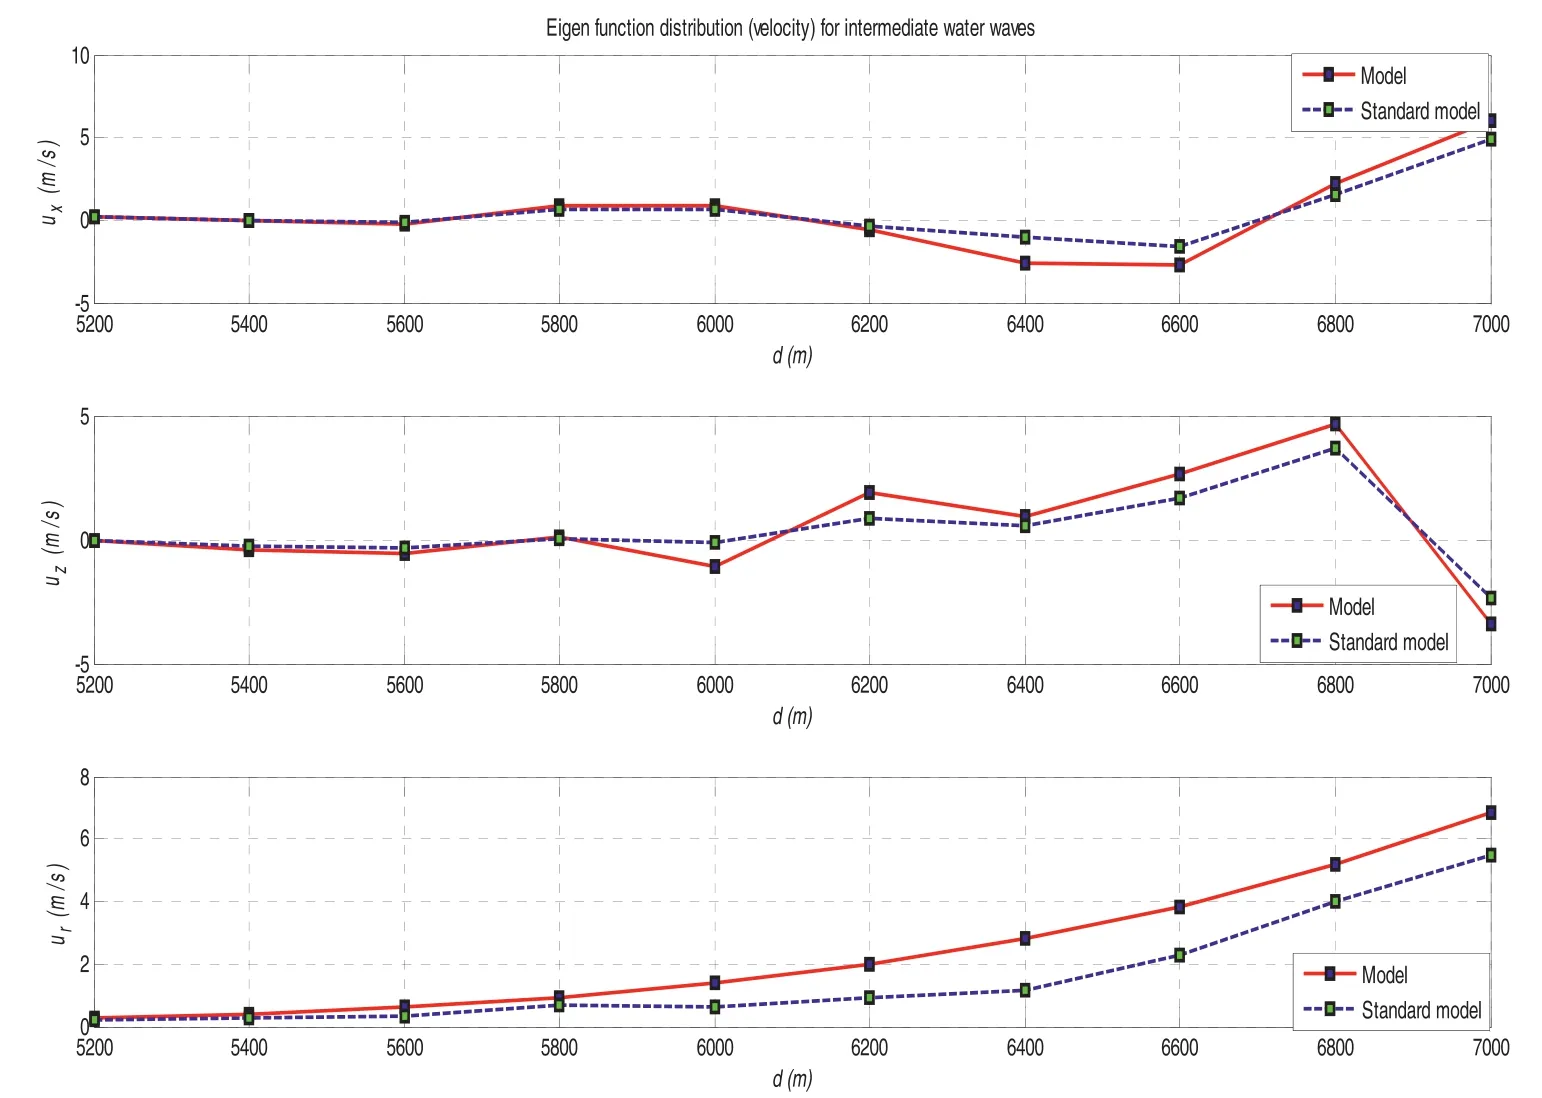
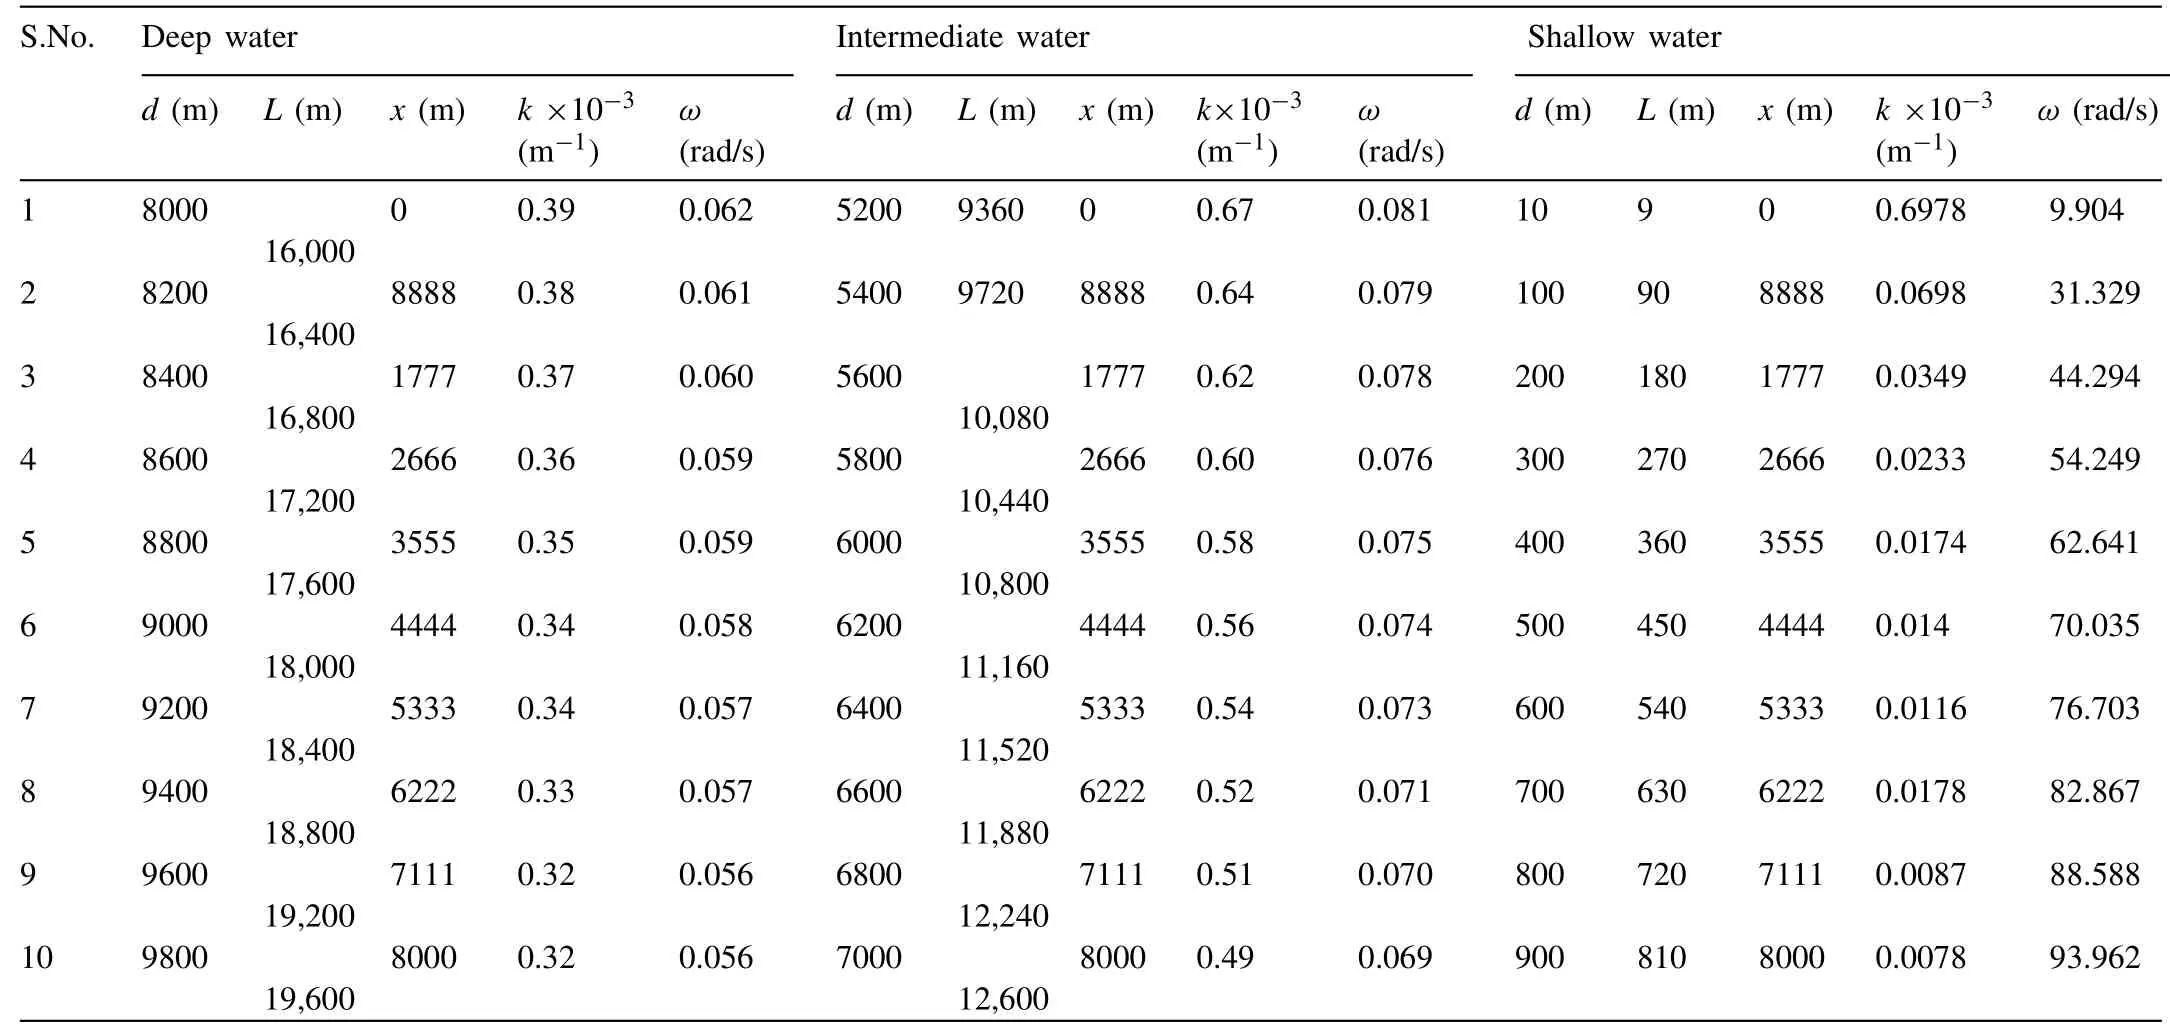
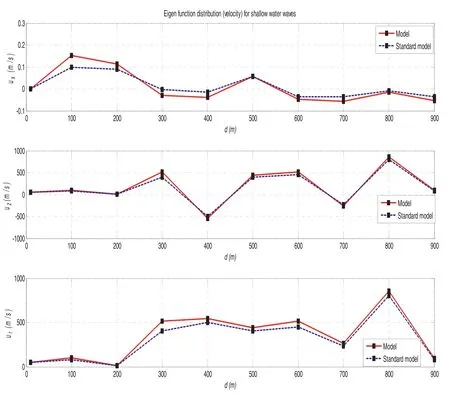
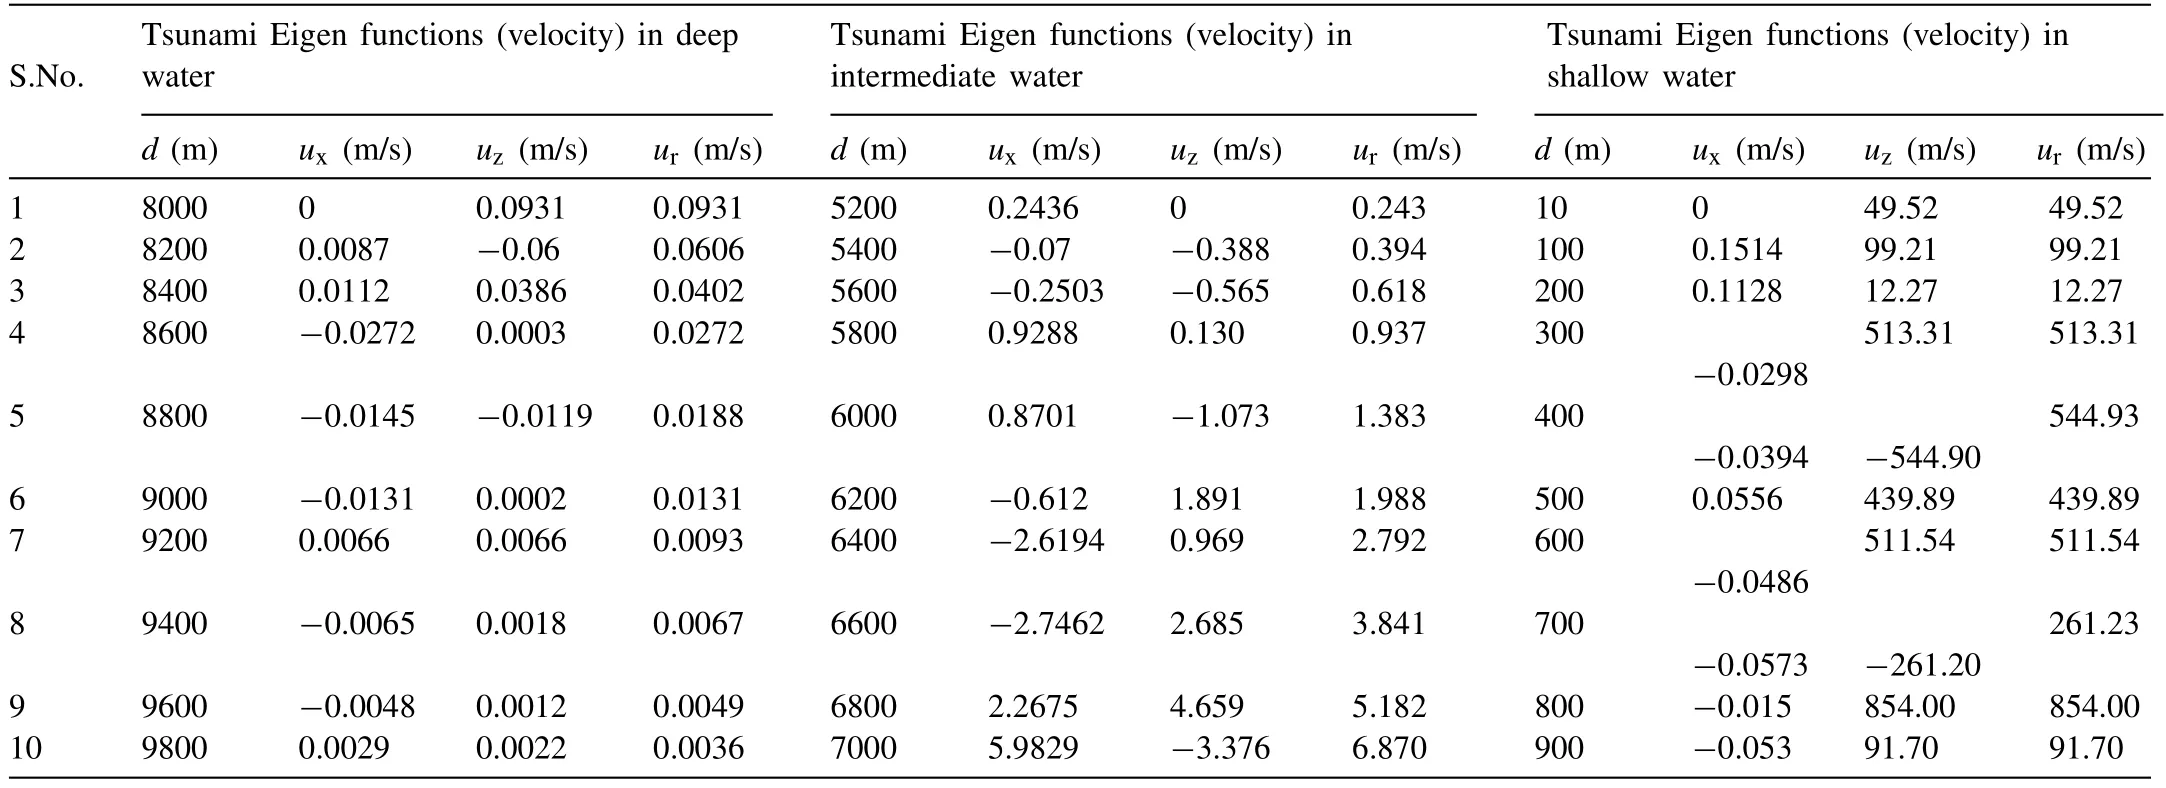
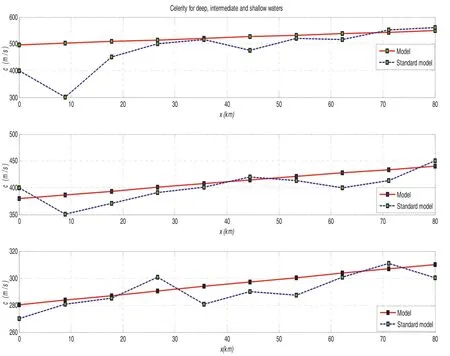
Based on the Airy’s wave theory, the water is said as of the intermediate or finite when it follows the condition of 0.05 The empirical equations for wave potential, Eigen function component values are provided in Eqs.(12) –( 16 ), respectively. Table 1 Estimated results for Tsunami fault parameters on logarithmic scale with reference to earthquake magnitude. 3.2.3.EmpiricalequationfortsunamiEigenfunctioninshallowwater Shallow water condition is demonstrated as ifd/L<0.05.The Eigen functions for this condition is also mentioned in the below Eqs.(17) –( 21 ), respectively 3.3.1.Computationalresultsoffaultparameters The computational analysis has been carried out to esti- mate the earthquake fault parameters such as length (l) in km, width (W) in km, area (A) in km2and the displacement (D) in cm.The parameters have been calculated using Eq.(1) to (4) with the consideration of earthquake magnitude (M) from minimum to maximum value that means from 6.0 to 9.5 with the finite difference of 0.5.Here the variation has been taken to indicate the suitable values of the fault parameters at each interval.The tabular results are provided in Table 1 with the pictorial representation as shown indicated in Fig.3.It can be observed that, variation of each quantity shows the linear re- sponse till the magnitude of 7.0 due to the lesser movement of tectonic plates on to the specified magnitude.There is a sud- den increment in the slope from linear to non-linear properties takes place because of the higher impact and respective fault parameters increases to the maximum level at the maximum magnitude.At the moderate value of earthquake magnitude of 7.5, the fault length is estimated as 86 km, fault width is resulted as 49 km, fault area if resulted as 4265 km2, and the fault shift displacement is resulted as 104 cm. Fig.3.Variation of earthquake parameters such as fault length ( l in km), width ( W in km), area ( A in km 2 ) and displacement ( D in cm) with respect to earthquake magnitude ( M ). Fig.4.Result for water wave angular frequencies in deep, intermediate and shallow waters with respect to ( a ) wave length, and ( b ) wave number. If the maximum earthquake magnitude of 9.5 is taken into consideration, all the fault parameters in terms of length, width, area and displacements are given as 1083 km, 206 km, 223,872 Km2, and 1195 cm, respectively.It can further be seen that, there is a huge difference of fault parameters be- tween maximum and moderate values of earthquakes.Hence, it can be concluded that, higher magnitude of earthquake re- sults to the higher disaster as compared to the lower or moder- ate magnitudes.Furthermore, the fault parameters estimations are the primary goal to calculate the affected region due to the Tsunami wave propagations in all concentric directions from the origin. Fig.5.Measurement of orbital velocities (horizontal ( u x ), vertical ( u z ) and resultant ( u r )) in deep water (thick line) and its validation with standard model (dotted line). 3.3.2.Estimationofwaterwaveangularfrequency The wave responses normally vary with respect the varia- tion of water depth.Significantly, it is important to calculate the water wave angular frequencies in deep, intermediate and shallower regions.Fig.4 (a) shows the variation of water wave angular frequencies with respect to wavelength (L), and (b) wavenumber (k) in all three cases of ocean water depths.The calculation has been carried out using the dispersion relation- ships expressed in Eqs.(5) and 6 for all three water condi- tions.As per the standard bathymetry table [17], the water depths for deep water has been taken from 8–9.8 km, for in- termediate water, depth is taken as from 5.2–7 km and for shallower region from 10–900 m for the simulation.The val- ues of angular frequencies in deep water case shows the lesser response as compared to the other two water regions due to the higher depth and the slope of bathymetry is constant throughout which results to the lesser response to the water wave orbital velocities.It can be observed that for deep water at 9.8 km of ocean depth the angular frequency provides the results of 0.056 rad/s and wavelength is resulted as 19,600 m and the respective wave number is 0.320/m, while in interme- diate water at 5.2 km of ocean depth, it shows the values as 0.0811 rad/s.But the larger effects can be seen in the shallow region where at 10 m of ocean depths, angular frequency re- sult is 9.90 rad/s and at 900 m of ocean depths it response to 93.96 rad/s which shows the higher value of the shallower lin- ear velocity and huge impacts on the beaches.Fig.4 (a) shows for the deep water, angular frequency decays with the wave length propagation of the ocean wave.Furthermore, in inter- mediate water, almost uniform pattern of angular frequency can be observed and in the end, in shallower region, incre- ment of the angular frequency can be observed at every depth.In the similar pattern, reverse observation of the angular fre- quencies can be seen for all three water depths with respect to wave number (k) in Fig.4 (b).Once critical results are found for the shallower region, the angular frequency abruptly de- cays with respect to the wavenumber of 0.1/m and after that, it decays with almost linear constant slope.This effect might be due to the cause of presence of beaches near to shore and land assimilation.In deep waters, the wavelength is very large compared to the intermediate and shallow water waves.It can be concluded that the angular frequency shows decaying re- sponse in deep and intermediate waters compared to shallower water with respect to wavelength variation.Variation inωis from 0.05 to 0.07 rad/s for deep, 0.05 to 0.1 rad/s for inter- mediate, and 0 to 100 rad/s for shallow waters.Furthermore, the right side of Fig.4 can also be described based upon the variation of angular frequency for deep and intermediate wa- ter waves.It can be clearly observed that, the value of angular frequency increases in deep water as compared to intermedi- ate and shallow water due to the inverse relationship betweenkandL.It can also be observed that, in shallower water, the particles move at very high speed and the impact is more significant compared to the other two water wave conditions at a significant wave heights.Wave numbers from 0–0.1/m responds to the tremendous reductions in angular frequencies from 100 −30 rad/s.Furthermore, almost constant value of angular frequencies can be obtained from the wave numbers from 0.1–0.7/m with the constant reduction in slope value.The description about the results parameters are mentioned in Table 2.The calculation of each parameters have been carried out the developed dispersion algorithm as mentioned in Eq.(7) with the consideration of all three water wave conditions. Fig.6.Measurement of orbital velocities (horizontal ( u x ), vertical ( u z ) and resultant ( u r )) in intermediate water (thick line) and its validation with standard model (dotted line). Table 2 Result for wavelength, propagation length, wave number and angular velocity of the tsunami waves in deep, intermediate and shallow water regions. 3.3.3.MeasurementoftsunamiorbitalvelocityEigenfunction The simulation work has been carried out using the bathymetry depth assumption of deep (8–9.8 km), interme- diate (5–7 km) and shallow water (10 m to 1 km) waves, respectively.The dispersion relationships have been applied to determine the respective wavelengths in each water wave condition.The wave heights for three conditions were as- sumed as 3, 6 and 10 m for deep, intermediate and shallow water waves respectively [2,6].This assumption depends on the simulation because in the deep ocean, wavelength is large and wave height is less compared to the other water wave conditions.Fig.5 shows the results for velocity Eigen func- tions in horizontal (ux), vertical (uz) and resultant velocity (ur) components (thick line) for deep water wave conditions with respect to bathymetry depth.The validation of result is also drawn with the standard model (dotted line) which was earlier presented by Ward in 2002 for all water wave conditions.The calculation has been done using the relation mentioned in Eqs.(8) and ( 9 ). Fig.7.Measurement of orbital velocities (horizontal ( u x ), vertical ( u z ) and resultant ( u r )) in shallow water (thick line) and its validation with standard model (dotted line). Fig.8.Result for orbital accelerations (horizontal ( a x ), vertical ( a z ) and resultant ( a r )) in deep water (thick line) and its validation with standard model (dotted line). Here if we consider the resultant velocity component, there is a continuous decay in the orbital velocity values.Consider at depth of 8000 m, the correspondingurvalue is 0.09 m/s for the simulated model and 0.07m/s for the standard model.Similarly at the water depth of 8600 m, the orbital velocity re- duces and results to 0.03 and 0.027 m/s for the simulated and standard model results as shown in Fig.5.After this depth, almost the lesser accuracy values are obtained till the water depth of 9800 m with the both model results.The conclusion can be drawn that, the results of the derived model has been validated with the standard model with the accuracy of less than 10%. Fig.6 represents the results for horizontal, vertical and resultant orbital velocities for the intermediate water level.At the water depth of 6400 m, the resultant velocity is obtained as 2.3 m/s while for the standard model it is seen that the values is 1.5 m/s for the same depth.The error values are very precise and accurate for the depth from 5200 m to 6000 m.After 6400 m, the slope of both the models is almost constant.The orbital velocity is obtained as 6.1 m/s at the water depth of 7000musing the derived and developed model while the same has been estimated as 5.2 m/s.The accuracy values after the validation, it is found as of less than 5% from the water depth of 5200 to 6000 m and less than 10% for the water levels from 6000 to 7000 m.These results are obtained by simulation the Eqs.(13) and ( 14 ). The shallow water results for the orbital velocities are pre- sented in Fig.7.Due to the bathymetry variation near to the coastal regions and beaches, the orbital velocity increases.The results show the fluctuations in the values due to the un- predictable velocity level near to the coast.At the water depth of 300 m, model shows the velocity of 500 m/s and the stan- dard model shows the result of 470 m/s which indicated the validation at the depth under shallower water condition.At the depth of 800 m, both models shows the suitable and pre- cise responses in the velocity values such as close to 800 m/s which correlates the better variations in the velocity and it also represents the increment in the orbital velocities in shal- lower regions.In general there have been the various litera- tures where it is stated that Tsunamis are the shallower water waves [3]. Hence the final conclusion can be drawn in such a way that, the resultant velocity in deep water varies from 0 to 0.1 m/s which is simulated at the depths of 8 to 9.8 km and in intermediate water, the result shows the increase in slope with the velocity variation from 0 to 10 m/s with reference to the depth of 5.2 to 7 km.In shallow water waves, the resultant velocity fluctuates from 0 to 1000 m/s at depths from 10 m to 900 m.the results for orbital velocity Eigen function values for all three water conditions are tabulated in Table 3.The simulated results are obtained from Eqs.(18) and ( 19 ). 3.3.4.MeasurementoftsunamiorbitalaccelerationEigenfunction Analysis of the orbital acceleration has also been car- ried out ( Fig.8 ) for the deep water wave condition using Eqs.(10) and ( 11 ).Due to the bathymetry geometry, accel- eration values show the moderate response as compared to the water wave orbital velocities.It can be seen from the figure the resultant acceleration (ar) is almost constant after the water depth from 8400 m to 9000 m for the standard and derived models.But at the depth of 8000 m, the derived values are 0.01 m/s2and for the standard models the value is 0.07 m/s2which represents the larger variation due to the simulation hit and trial methods of the studies.For the inter- mediate water level also, the result is almost same except for the water depths from 6200 to 6600 where at the water depth of 6400 m, model results the acceleration value as 0.2 m/s2while the standard model shows the value as 0.8 m/s2.In deep water, the resultant acceleration is small and varies from 0 to 0.01 m/s2compared to the intermediate water, where the variation is from 0 to 0.5 m/s2.The simulation results are obtained using Eqs.(15) and 16.Fig.9 represents the Eigen acceleration values in intermediate water condition.The variation in the values between the water depths of 6.2 km to 6.6 km is due to the bathymetry topography and effect of the transition of the energy level from deep to shallow regions via intermediate water condition. The highest values of acceleration from 0 to 10 ×104m/s2have been obtained in the shallow water waves.From Fig.10 , it can also be concluded that, the orbital acceleration at 900 m depth show a value of 9 ×10⁴m/s2, hence the dynamic forces are very high approximately 1 km from the beaches.The computation in shallower regions is mea- sured using Eqs.(20) and ( 21 ).Once the Tsunami waves approaches to the beach, wave height increases whereas particle acceleration decreases because near the coast, due to geological structure of the earth’s surface, inertia and gravity forces increase to the extreme limits, while particle acceler- ation and velocity values reach close to zero.Here in this condition, the derived model and standard model results to the similar result.The complete scenario of the results under the acceleration values in all three conditions are tabulated in Table 4. 3.3.5.Measurementoftsunamiwavepotentialandcelerity Fig.11 shows the wave potential plot with respect to bathymetry depth for all three water wave conditions.It can be seen thatϕvaries from –20 to + 20 in case of the deep water, –2 ×10⁴to + 2 ×10⁴for intermediate water and –5 to + 5 for shallower water conditions with respect to bathymetry depth as tabulated in Table 5.The model derived values (thick line) have also been matched with the standard model values (dotted line).The computation is done using the algorithms mentioned in Eqs.(6) , ( 12 ) and ( 17 ) for all three water con- ditions respectively. Table 3 Tabulated results for tsunami Eigen functions such as orbital velocity along the direction of propagation ( x ), vertical ( z ) and resultant ( r ) for deep, intermediate and shallow water regions. Table 4 Tabulated results for tsunami Eigen functions such as orbital acceleration in the direction of propagation, vertical displaced direction and resultant direction for deep, intermediate and shallow water regions. Table 5 Calculated results for the tsunami wave potential functions in deep, intermediate and shallow water regions. Fig.9.Result for orbital accelerations (horizontal ( a x ), vertical ( a z ) and resultant ( a r )) in intermediate water (thick line) and its validation with standard model (dotted line). Fig.10.Result for orbital accelerations (horizontal ( a x ), vertical ( a z ) and resultant ( a r )) in shallow water (thick line) and its validation with standard model (dotted line). Fig.11.Calculated result for wave potentials (thick line) in deep, intermediate and shallow waters along with the validation with standard model (dotted line). Table 6 Celerity variations with respect to the direction of propagation in deep, in- termediate and shallow water regions. Fig.12 presents results of celerity variation with respect to distance from the origin of tsunami waves for all water wave conditions.The results show that as tsunami waves progress from the deep to coastal regions, celerity reduces due to in- crement in significant wave heights.It can further be observed that at 80 km distance from the origin of generation, the av- erage celerity is as 550 m/s for deep, 440 m/s for intermediate and 310 m/s for shallow water respectively and the respec- tive results are tabulated in Table 3.6.Measurements of the Eigen function parameters correlated to tsunami wave’s run- ups have been carried out using Airy wave theory models for all water wave conditions.It has been observed in the present work that in deep waters, tsunami waves propagate with the higher velocity due to less angular frequency of orbital par- ticles, while near the shorelines, particle movement is high, but linear velocity response diminishes.Using the dispersion relationships, celerity has been computed for all water wave conditions.In the shallow water region, celerity reduces and significant wave height increases.Tsunami with high-energy amplitude causes high impact to the shoreline, which results in extreme disaster. This paper presented the result for the computational analysis of the tsunami wave parameters such as its Eigen functions in terms orbital velocity, acceleration, wave poten- tial and celerity in deep, intermediate and shallower water regions.The model has been developed for the calculation of these parameters using Airy’s wave theory and the results have been proposed with the suitable validation using the standard model.The variation of each fault parameters have been calculated with the magnitude from 6.0 to 9.5 which is recorded as minimum and maximum magnitude values in various literatures.It is found that, the values of fault parameters show the linear response till the magnitude of 7.5.e.g.,atM7.5, the length is 80 km, width is100 km, area is 1000 km2, and displacement is 200 cm.This shows smaller values as compared to the earthquake magnitudeM9.5 at which all the parameters shows very large response.Furthermore, it is recorded that, the fault parameters varia- tion depends on the values of earthquake with the non-linear response afterM7.5.As a consequence, works have been carried out based on computation of tsunami Eigen functions such as its potential, wave angular velocity, orbital linear velocity, celerity, acceleration in deep, intermediate and shallower water regions.The algorithm was used based on Airy’s wave theory and dispersion relationships. Fig.12.Simulated result for celerity measurements in all three water wave conditions for 80 kms from the origin of tsunami center. As per the bathymetry and geological aspects, the deep, intermediate and shallow water regions are assumed to be from 7 to 10 km, 4 to 7 km and 0 to 4 km, respectively.The values of angular frequencies in deep water shows the lesser response as compared to other two water conditions because, in deep water the angular velocity of water particles travels with the lesser speed as compared to the shallower region as per Airy’s wave theory.The values of angular velocity at depth of 9.8 km show 0.0621 rad/s while in intermediate water it shows the response of 9.904 rad/s at water depth of 5.2 km and at the water depth of 900 m under shallower region the velocity value is very high i.e.93.96 rad/s.It indicates the higher impact on coastal region. The third step involves the simulation study of measure- ment of tsunami Eigen functions such as orbital velocity, ac- celeration, wave potential in deep, intermediate and shallower water regions.The simulation result shows the resultant or- bital velocity in deep, intermediate and shallow water regions are 0 to 0.1 m/s, 0 to 10 m/s and 0 to 1000 m/s, respectively.Furthermore, the resultant acceleration for all respective con- ditions is measured as 0 to 0.01 m/s2, 0 to 0.5m/s2and 0 to 10 × 104m/s2respectively with the assumed water depths.The orbital acceleration at the water depth of 900 m which is shallower in nature shows the result of 9 ×10⁴m/s2, hence the dynamic forces are very high approximately 1 km from the beaches.Once the Tsunami waves approaches to the beach, wave height increases whereas particle acceleration decreases because near the coast, due to geological structure of the earth’s surface, inertia and gravity forces increase to the ex- treme limits, while particle acceleration and velocity values reach close to zero.Similarly, the simulation result for the maximum wave potential is measured in all three water con- ditions are 20, 2 ×10⁴and 5 which represents the amount waves transformed from deep to shallower regions with re- spect to the wave length and direction of propagation.The validation of each result has also been presented with the standard simulated data which shows the results as less than 10% of the accuracy. Acknowledgement The author would like to thank Dr.Pankaj Srivastava and Dr.Ugur Guven of University of Petroleum and Energy Stud- ies for helping out in completing the task.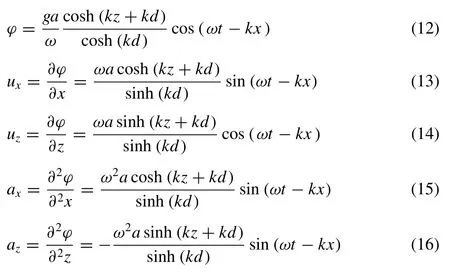

3.3.Results and discussions




3.4.Conclusions
 Journal of Ocean Engineering and Science2020年1期
- Journal of Ocean Engineering and Science的其它文章
- Power enhancement of pontoon-type wave energy convertor via hydroelastic response and variable power take-off system
- Application of SWAN model for storm generated wave simulation in the Canadian Beaufort Sea
- Invariant subspaces, exact solutions and stability analysis of nonlinear water wave equations
- New turbulence modeling for air/water stratified flow
- Numerical simulation of air cavity under a simplified model-scale hull form
- Design methodology of permanent magnet generators for fixed-pitch tidal turbines with overspeed power limitation strategy
