The investigation of internal solitary waves over a continental shelf-slope*
MA Qian , YUAN Chunxin , LIN Xiaopei , CHEN Xue’en,
1 Physical Oceanography Laboratory/Institute for Advanced Ocean Study, Ocean University of China and Qingdao National Laboratory for Marine Science and Technology, Qingdao 266100, China
2 School of Mathematical Sciences, Ocean University of China, Qingdao 266100, China
Received May 18, 2019; accepted in principle Jul. 19, 2019; accepted for publication Sep. 23, 2019 © Chinese Society for Oceanology and Limnology, Science Press and Springer-Verlag GmbH Germany, part of Springer Nature 2020
Abstract Internal solitary waves (ISWs) always happen in marginal seas, where stable stratifi cation exists. ISWs may carry large energy when they propagate and afference ect marine engineering constructions such as marine drilling platforms. Previous studies, including a large number of mooring observations and laboratory experiments, show the speed of ISWs will change when they pass by shelf slopes. Korteweg-de Vries (KdV) theory explain this phenomenon. In the paper, we use a laboratory experiment and a numerical model experiment to verify this theory. In the laboratory experiment, we injected two layers of water of difference erent densities in a tank to simulate marine stratifi cation and make ISWs. We use a CCD camera to record the whole process. The camera can take 16 photos per second. In the numerical experiment, we input the same original conditions as the laboratory one. The results of 18 difference erent original conditions show the dimensionless factor δ plays a key role in deciding the amplitudes and shapes of ISWs. The main conclusion also contains that small-amplitude waves match well with KdV theory while mKdV is better for largeamplitude waves. Whether the laboratory experiment or numerical experiment shows results with a high agreement. In future studies, we may use a numerical model with higher resolution to get analysis about phase speed and energy of ISWs.
Keyword: internal solitary waves; shelf-slope; laboratory experiment; numerical modeling
1 INTRODUCTION
Numerous in-situ and remote-sensing observations demonstrated internal solitary waves (ISWs) and nonlinear wave trains in marginal seas and coastal water (Vlasenko and Hutter, 2002). A large number of observations in the world’s oceans have shown that variable topography plays a crucial role in the shoaling of ISWs (Osborne and Burch, 1980; Apel et al., 1985; Holloway et al., 1997). The shapes of ISWs over continental shelf-slope remains a problem of considerable interest in coastal oceanography, but the study of ISWs was primarily based on traditional weakly nonlinear theories among which the Kortewegde Vries (KdV) theory (Benjamin, 1966; Ono, 1975; Rocklifference , 1984) was commonly used. Nevertheless, it is commonly recognized that such theories have certain limitations when applied to the realistic ocean, i.e., the capability to match observational data decreases as the wave amplitude increases (Vlasenko et al., 2005). This inspires researchers to develop theories incorporating higher-order nonlinear terms (Grimshaw et al., 1999), or to derive an equation system that is capable of delineating full nonlinearity (Vlasenko and Hutter, 2002; Vlasenko et al., 2010). To overcome this limitation, nowadays by the rapid development of the techniques of computational fl uid dynamics together with the availability of powerful supercomputers, comprehensive oceanic model based on the primitive equations are developed and successfully implemented to simulate ISWs. In the Extended Kdv-type equation, “critical depth” exists where the nonlinear coeき cient is zero. The thickness of the two layers are the same, and the ISWs will disappear (Tsuji and Oikawa, 2007; Nakayama et al., 2019).
Laboratory experiments on ISWs over continental shelf-slope have been conducted by a large number of scientists (Helfrich, 1992; Michallet and Ivey, 1999; Hsu and Ariyaratnam, 2000; Hüttemann and Hutter, 2001). Helfrich (1992) fi nd a mixing process will happen when an incoming wave passes by a slope and splits into serval waves. The baroclinic solitary waves in a two-layer fl uid system with the difference usive interface was investigated by Hüttemann and Hutter (2001). They defi ned two kinds of solitary waves: a fast, ground model soliton and a second-mode soliton.
Numerical simulation of ISWs is also conducted by many scientists. Several kinds of ridges under the water was simulated in a two-layer fl uid system. Features of ISWs including energy dissipation, amplitudes and refl ection are proved to have a connection with “the degree of blocking”. MCC-type theories are also reproduced by numerical modes (Zhu et al., 2016, 2017, 2018). Nakayama (2006) used six difference erent models to verify which one is suitable to solve the equation. Scientists also combined laboratory experiments and numerical experiments together to crosscheck the experiment results. Grue et al. (1999, 2000) used a laboratorysize and two-layer system model to simulate the process of wave breaking and broadening of ISWs. Nakayama et al. (Nakayama and Imberger, 2010; Nakayama et al., 2012) used a 3-D model to do the same work.
The previous laboratory experiment of ISWs over the continental shelf is, however, limited and not allinclusive. We comprehensively conducted a series of fundamental experiments on generation and propagation of ISWs over continental shelf-slope in the laboratory to investigate the evolution of ISWs in a difference erent stratifi cation. The laboratory and numerical experiment setup are illustrated in Section 2. The MIT general circulation model (MITgcm) is also applied to simulate ISWs with the same domain, topography, and stratifi cation. Section 3 shows experimental and numerical results. Based on the result, KdV-type theories are also shown in Section 4. Finally, we conclude in Section 5.
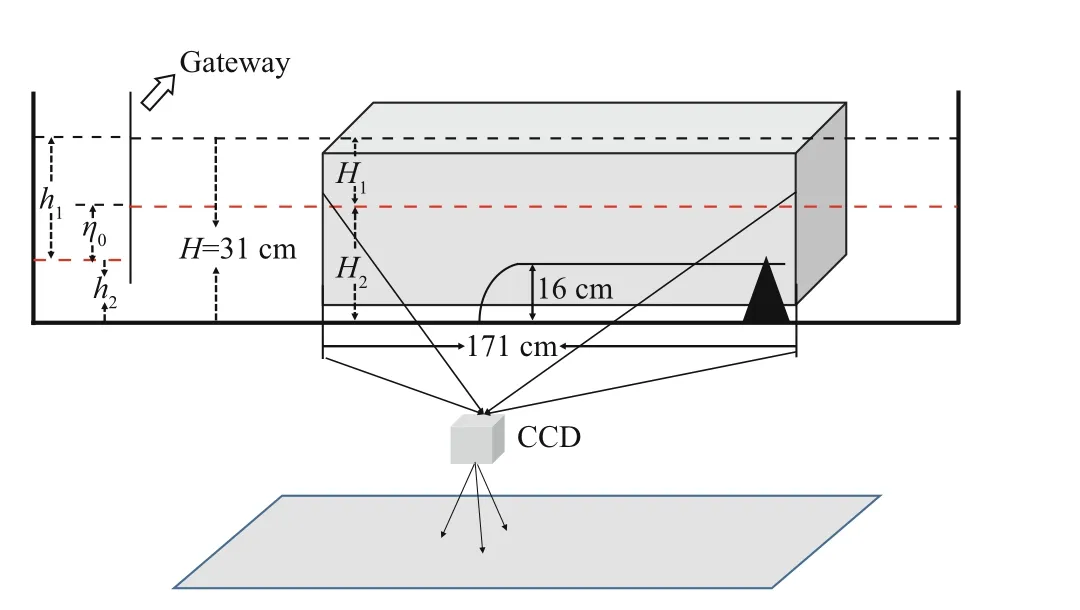
Fig.1 Sketch map of the experiment system
2 MATERIAL AND METHOD
2.1 Experiment setup
We conducted the experiments on a two-layer fl uid in a laboratory water tank, the size of the tank see Fig.1, together with the experiment system. The upper layer is freshwater whose density is 1.00 g/cm3with thickness H1, while the lower layer is dyed salty water with 1.02 g/cm3density, and layer thickness H2. A continental shelf-slope which has a semi-cycle forepart, 16 cm high and 1.3 m wide, is deployed on the right-hand side of the tank. Gravity collapse method is implemented to produce initial ISWs on the left-hand side. In advance of experiment, some control tests have run to ensure that the distance between the wave production area and continental shelf-slope is large enough for the evolution to ensure waves have fully developed to stable ISWs when they propagate to continental shelf slope. A CCD camera will photograph the whole process of propagation and evolution of ISWs in the darkness indoor environment, with a sampling frequency of 16 frames per second.
Factors governing the experiment include (1) the ratio of the thickness of the upper freshwater H1to the lower salty water H2under the condition that is keeping total thickness constant, H1+ H2=0.31 m, (2) the amplitude of an incident wave is determined by initial step depth η0in the production area. Other factors, such as the size of continental shelf-slope and the density of the upper and lower water, etc., are kept as constants. Three kinds of the ratio H1/ H2, 5/26 cm, 7.5/23.5 cm, and 10/21 cm and six categories of initial step depth η0, 2, 4, 6, 8, 10 and 12 cm for a depression type ISWs are considered. Time series of the pycnocline fl uctuation is derived from the photography obtained by CCD camera. Figure 2 displays the nine vertical sections which are selected to do the analysis.
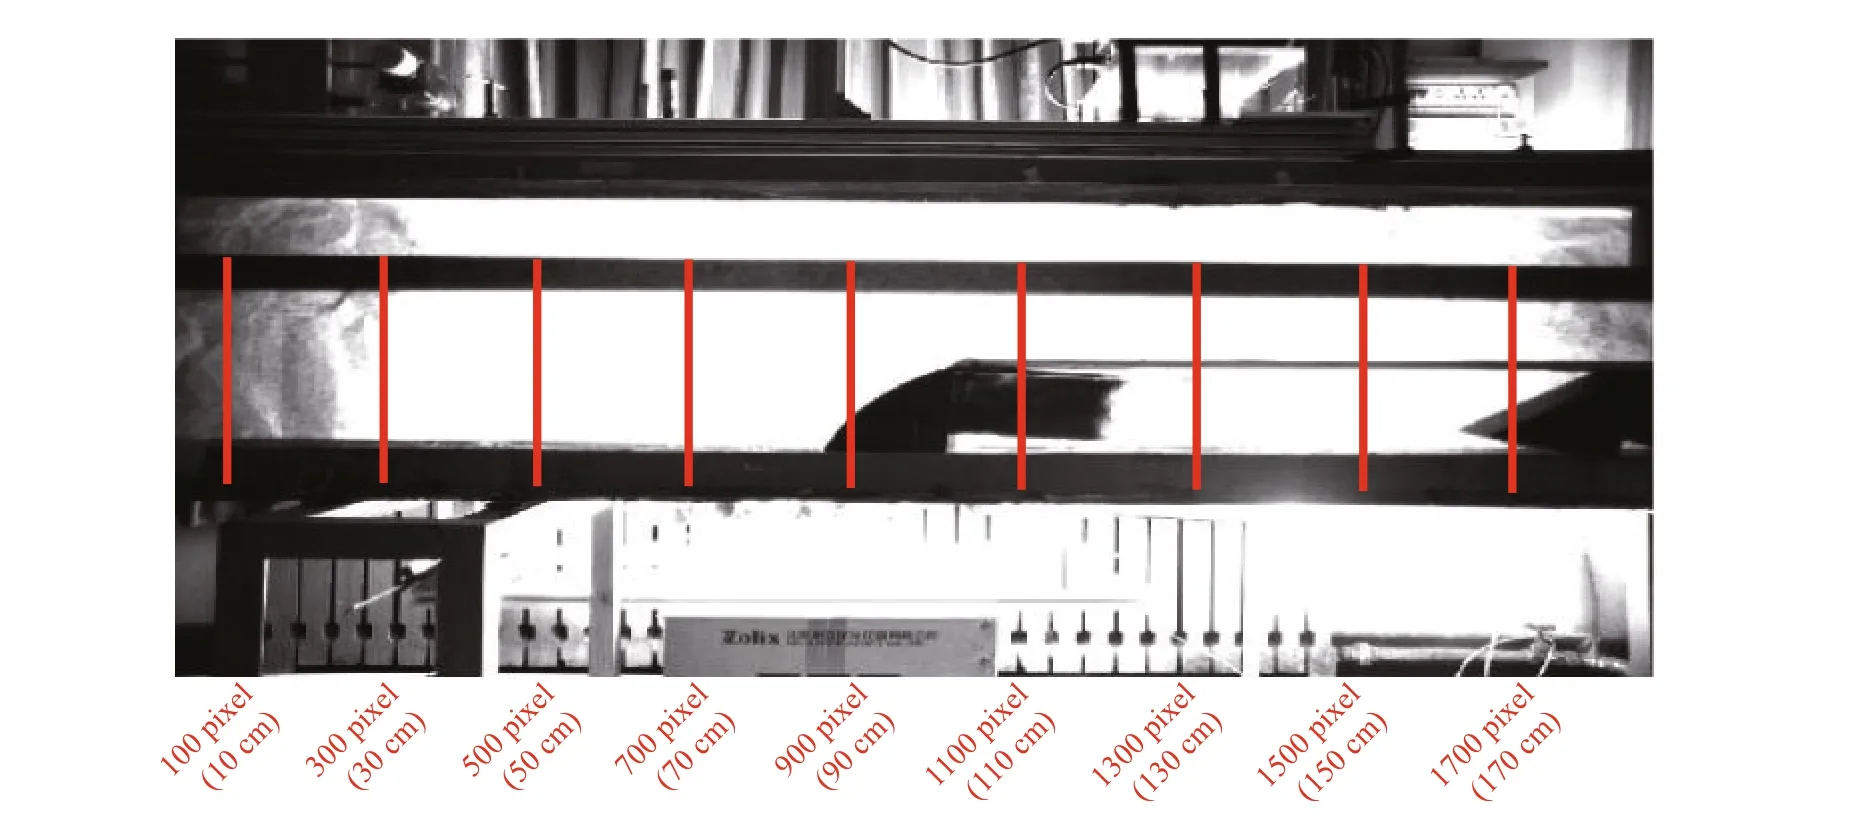
Fig.2 Vertical sections selected to conduct the analysis
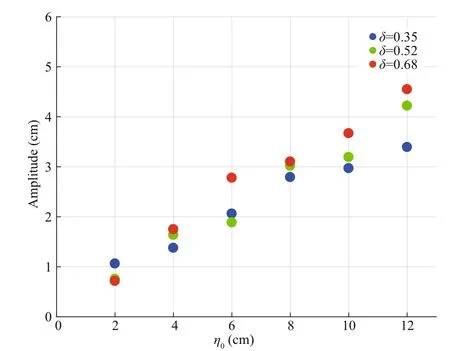
Fig.3 The amplitude of ISWs under the case of difference erent initial step depth on the 30-cm location
2.2 Numerical experiment set up
The fully non-linear non-hydrostatic version of the MIT general circulation model (MITgcm) (Marshall et al., 1997) is applied to reproduce the behavior of ISWs in the laboratory tank. MITgcm solves the primitive equations, and importantly, it can take the non-hydrostatic efference ect, which is indispensable for the simulation on internal solitary waves, into account (Marshall et al., 1997).This model was used to study the generation process of multi-modal ISWs in the northern South China Sea (Vlasenko et al., 2010). However, the combination of the laboratory experiment and numerical simulation is rare.
The bathymetry data and the model confi guration are as same as the realized laboratory situation, namely, with a two-dimensional x- z domain, with a length of 5 m and a depth of 0.31 m, including 10 cm upper layer and 21 cm lower layer respectively. The initially homogeneous domain-wide distribution of temperature is 170°C and salinity is 27.5 in the lower layer, 1.0 in the upper layer. The grid resolution in the vertical direction and horizontal direction both are 0.1 mm, and the timestep is set up to be 0.000 2 s, which can make the computation satisfy Courant-Friedrichs-Lewy (CFL) condition very well.
3 RESULT
3.1 Experiment result
3.1.1 Relationship between amplitude and other factors
Figure 3 shows the relationship between the initial step depth η0and the amplitude of the incident leading wave. In three cases of the ratio H1/ H2, the amplitudes of incident leading waves are all connected with initial step depth η0. In other words, a larger nonlinear coeき cient accounts for larger wave amplitude. Conversely, small step depth corresponds with small amplitude. This is very intuitional because larger initial step depth represents higher potential energy, which will produce larger amplitude incident waves. In the derivation of KdV equation, the nonlinear coeき cient serves as a scaling parameter, which means the ratio of the wave amplitude and total water depth H. It means a larger nonlinear coeき cient accounts for larger wave amplitude. (Gerkema and Zimmerman, 2008.) Additionally, amplitudes of incident waves are found to be in proportion to the dimensionless factor δ=| H1- H2|/( H1+ H2). However, it is also noticeable that the case of η0=2 cm and η0=6 cm do not obey the above the law, a reasonable guess is an experimental error, as for the case of η0=2 cm, the experiment data is relatively small. Therefore, even a small experimental error can play a signifi cant role.
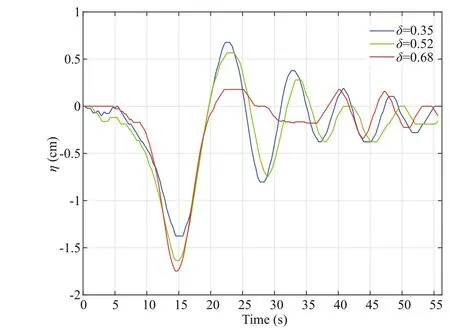
Fig.4 Time series of pycnocline fl uctuation on the vertical section of 10-cm in the case of initial step depth η 0=4 cm
The waveform can be delineated in Fig.4. The waveform will be closer to the theoretical standard one. The theoretical standard waveform can be calculated by MITgcm according to the KdV equation (Yuan et al., 2018a, b).The fl uctuation after leading wave was more signifi cantly suppressed when the dimensionless factor is larger. On the contrary, under the situation of a small dimensionless factor, the waveform will difference er far from the theoretical standard waveform, and the fl uctuation after leading wave was evident. The dimensionless factor corresponds with the amplitude of the incident leading wave, certifying conclusions in the above part.
3.1.2 ISWs over a continental shelf-slope
Three kinds of the ratio H1/ H2( H1is the thickness of the upper freshwater, and H2is the thickness of the lower dyed salty water, shown in Fig.1) are considered, and distinguishable results are demonstrated in the following sections.
Considering the height of the continental shelf is 16 cm, the ratio of the thickness H1/ H2=5/26 cm is changed to H1/ H2=5/10 cm after ISWs propagate onto the continental shelf. As a result, H1is always smaller than H2no matter in front of or over the continental shelf. Figure 5 shows the amplitudes of pycnocline fl uctuation on nine sections, respectively. The continental shelf-slope almost does not infl uence the propagation of ISWs if the step depth η0is small. However, as for substantially large step depth, the amplitude decreases rapidly when ISWs propagate onto the continental slope. Then the lower salty water gets thin gradually with ISWs propagating onto the continental shelf, resulting in the increasing nonlinearity simultaneously. Then the waves continue to propagate along the shelf, at the same time, the thickness of lower salty water is decreasing continuously and consequently, the friction is getting large, as a result, the amplitude of ISWs attenuates very quickly from 110 to 170 cm location. If we keep eyes on the 90 and 170 cm, the averaged attenuation rate of amplitude is 15%. Now we can claim the shoaling process can cause the polarity deepening.
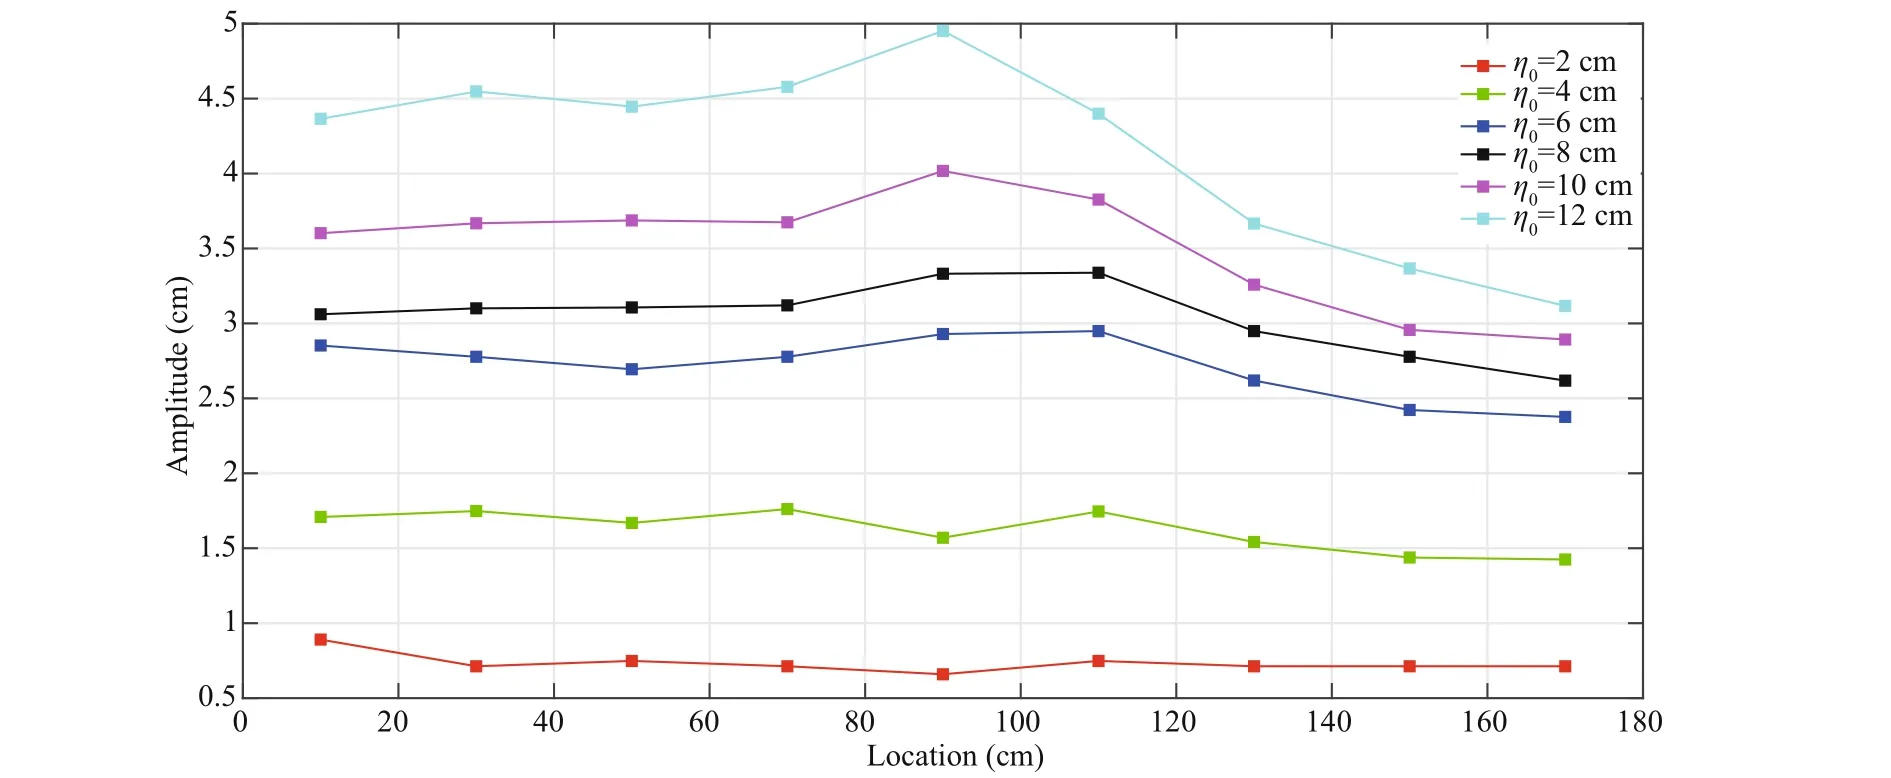
Fig.5 The amplitudes of pycnocline fl uctuation on nine sections in the case of six kinds of initial step depth and Fig.2 shows the location on the x-axis
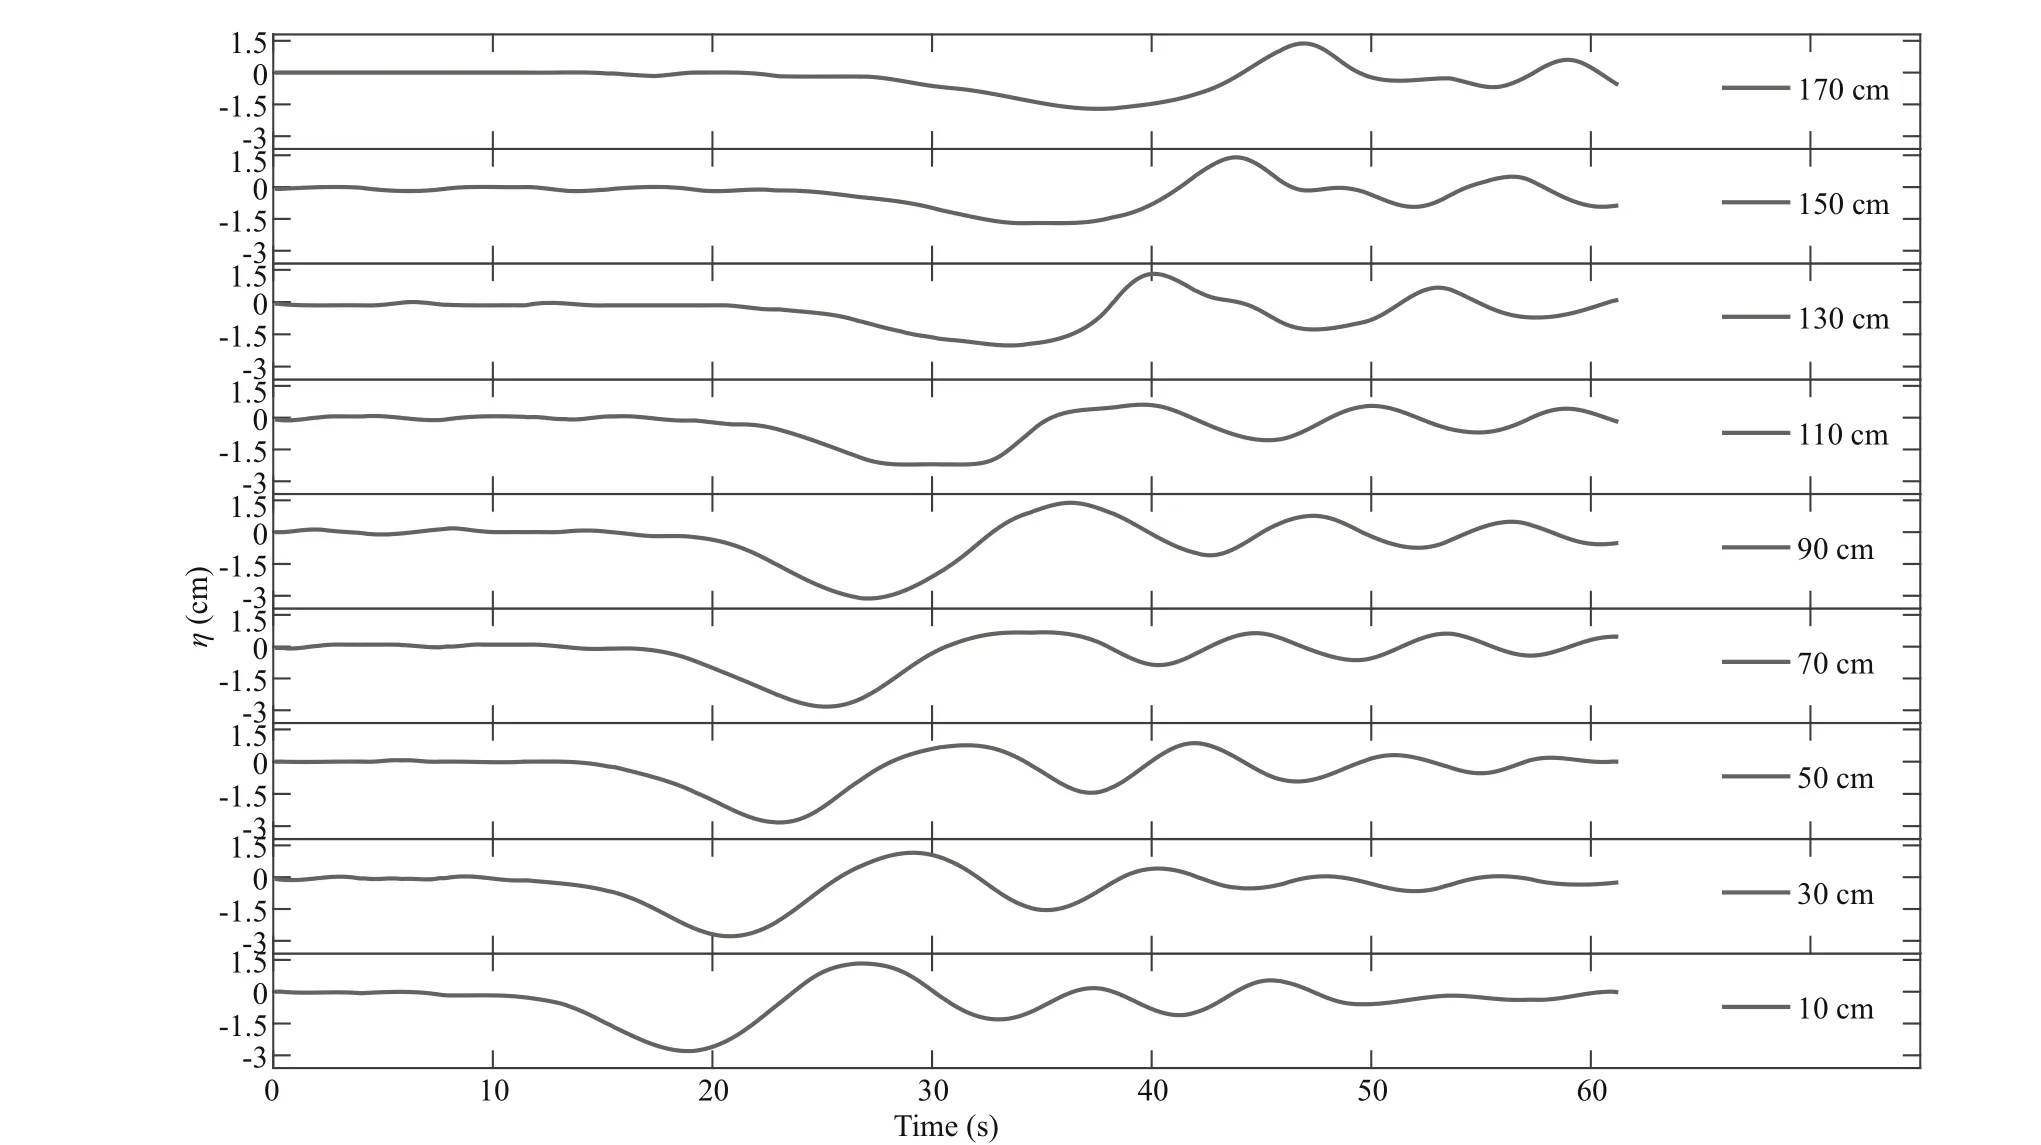
Fig.6 H 1/ H 2=10/21 cm, the pycnocline fl uctuation on nine vertical sections in the case of the initial step depth η 0=8 cm
For the ratio of the thickness H1/ H2=10/21 cm, it is altered to H1/ H2=10/5 cm after ISWs propagate onto the continental shelf. Therefore, H1is smaller than H2in front of the continental slope and turns to be larger than H2over the continental shelf. As is shown in Fig.6, trailing waves after leading wave is noticeable, which can be explained by the small dimensionless factor δ=0.35. The efference ect of nonlinearity is weak, and consequently. The waveform difference ers far from the theoretical standard waveform. On time 20 s, ISWs propagate to continental slope and begins to have an interaction between both, then the pycnocline ascends quickly between 28 s and 35 s, which indicates the process of polarity transition, and we will give a more detailed delineation next. On the vertical section of 170 cm, ISWs transform the polarity completely. Depression ISWs reverse their polarity and turn to be elevation ones.
It is worthy of highlighting the process of polarity transition. Details are shown in Fig.7. The waveform is symmetric before ISWs propagating onto the continental shelf-slope (Fig.7a). Due to the topography, the lower layer decreases gradually, and according to KdV theory, which means the efference ect of non-linearity also decreases. As a result, the speed of the water particle on wave trough turns to be smaller than the water particle on wave trail, which makes the waveform steeper on the trail and more fl at on the frontal face (Fig.7b). With the propagation, the waveform on frontal face deforms to be parallel to continental shelf gradually (Fig.7c). At the last stage, depression ISWs change their polarity completely and transform into elevation ISWs (Fig.7d).
Considering H1/ H2=7.5/23.5 cm, it is changed to H1/ H2=7.5/7.5 cm after ISWs propagate onto the continental shelf. Figure 8 displays the fl uctuation of pycnocline on nine vertical sections in the case of the initial step depth η0=8 cm. It shows that the polarity of ISWs attenuates gradually with the propagation over the continental shelf slope, and at last the non-linear ISWs develop into the linear periodic fl uctuation.
Besides the phenomena of overturning, we can also observe break dissipation and mixing in all the three kinds of H1/ H2, in the precondition of large amplitude. However, the lack of velocity data does not allow us to analyze these mechanisms in detail.
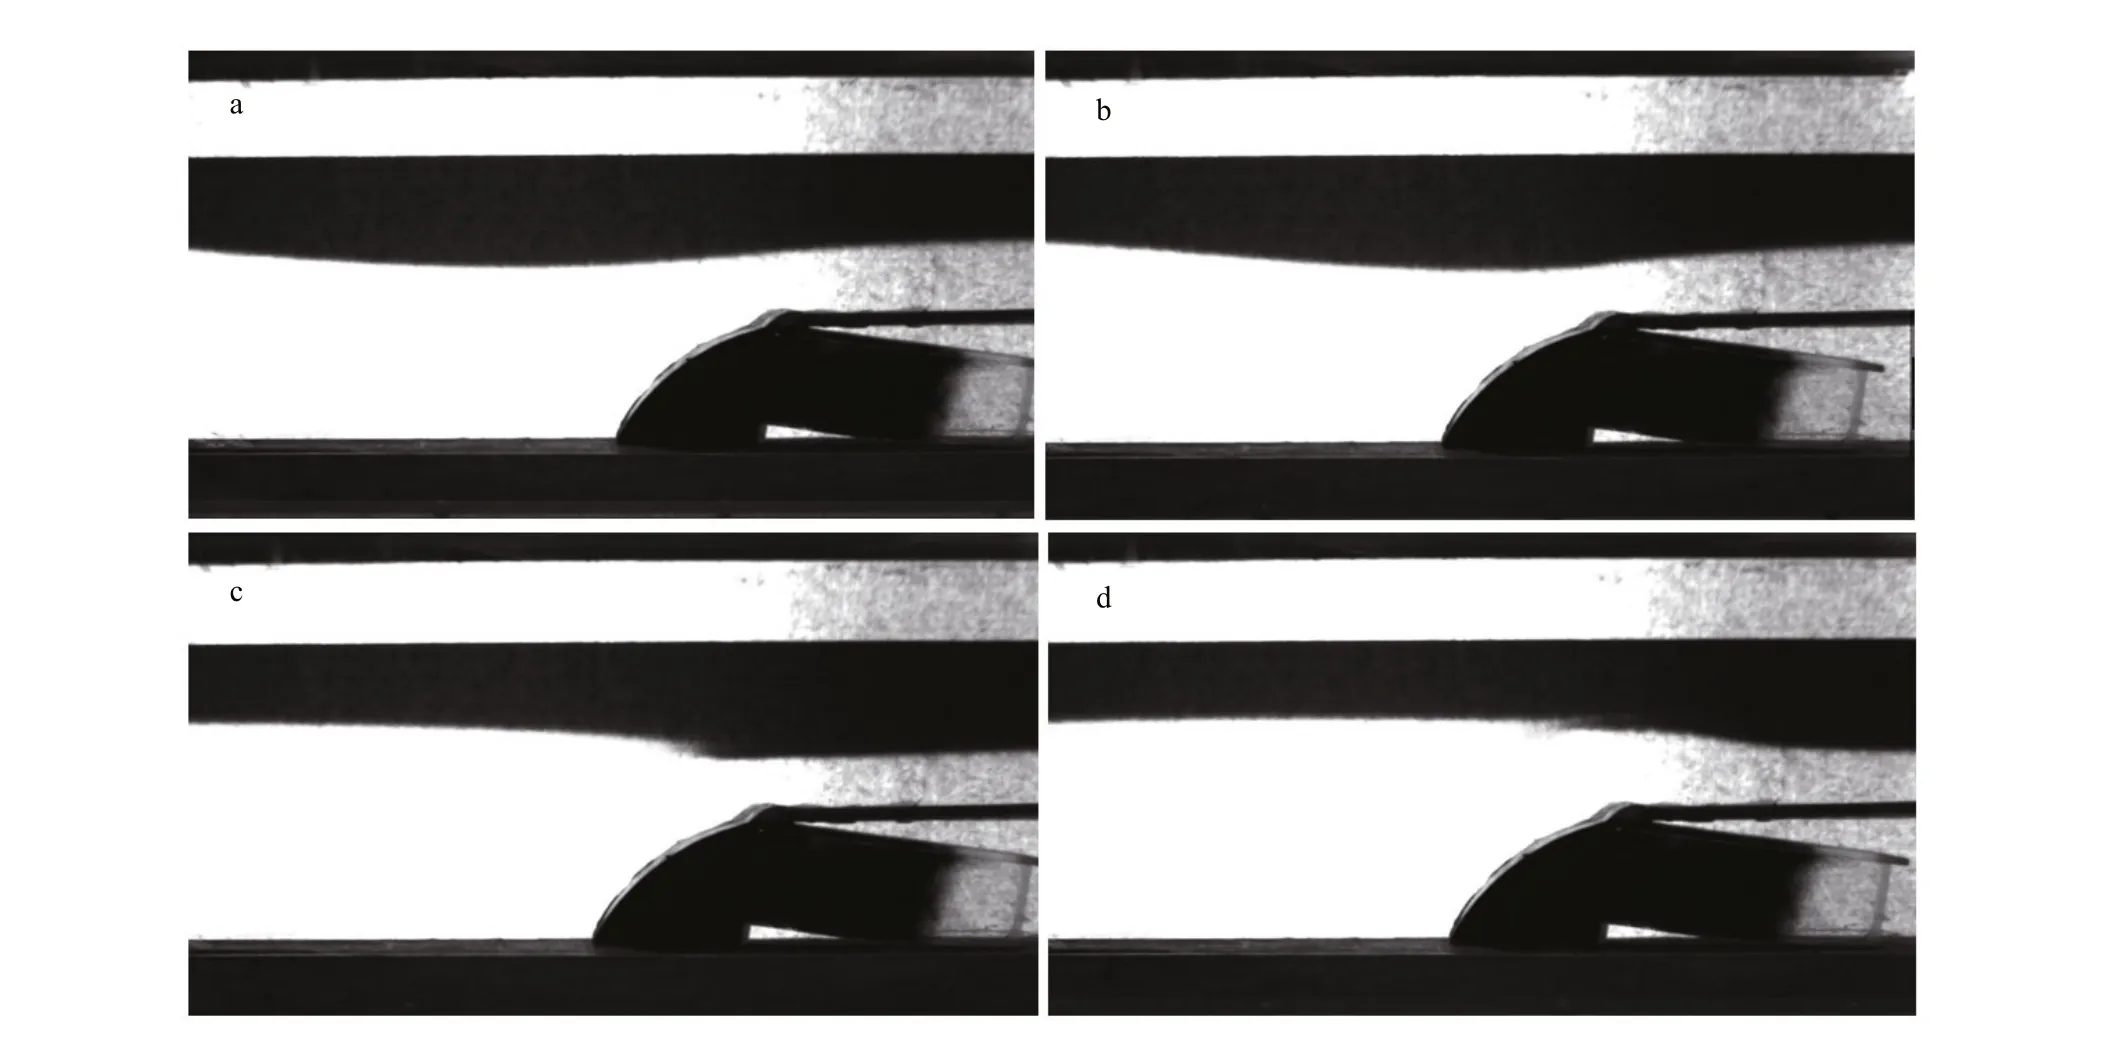
Fig.7 CCD cameras photography at 30 s, 34 s, 38 s, and 42 s, respectively (a-d) in the case of initial step depth η 0=8 cm
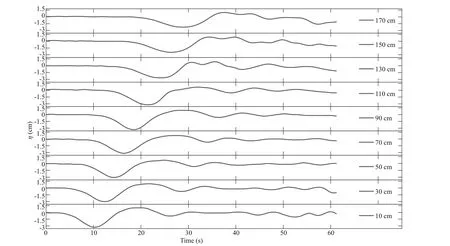
Fig.8 In the situation of H 1/ H 2=7.5/23.5 cm, the pycnocline fl uctuation on nine vertical sections in the case of the initial step depth η 0=8 cm
3.2 The numerical result
About ISWs, we need to know one of the wave properties and based on it. Then the others can be calculated via the theory. Because of this reason, the amplitude is selected to verify the numerical model result. Figure 9 shows the comparison between laboratory experiment and the MITgcm model, from which we can fi nd the coincidences between model and experiment on all nine vertical sections are very satisfi ed, except the two sections of 110 cm and 170 cm. About 20% relative error happens in the two sections. We consider a reasonable explanation for the error at 110-cm section is that wave breaking and mixing happened when it passed the slope. At 170-cm section, it is very close to the end of the tank. Boundary refl ection is the cause of the error. This great agreement corroborates the capability of numerical ocean model to simulate small-scale nonlinear phenomena. It also can lay a foundation for real ocean simulation, specifi cally speaking. This result inspires us that before we do some time-consuming three dimensional and high-resolution oceanic simulation. It is a good choice to do some comparison experiment at fi rst to determine a set of parameters to avoid or reduce the trials to parameterization.
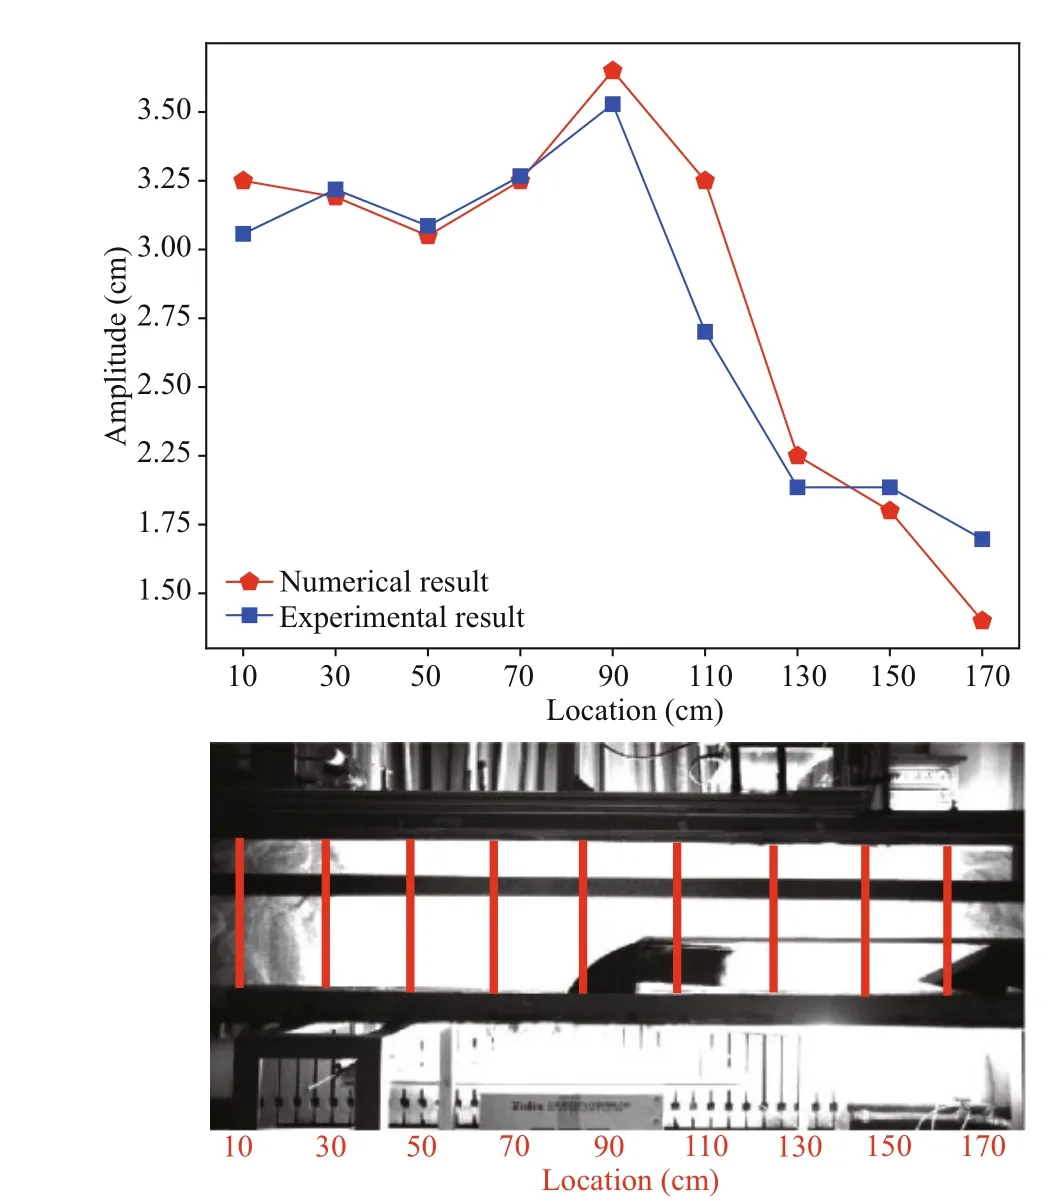
Fig.9 The comparison between the MITgcm model and laboratory experiment with the initial step depth η 0=10 cm in the case of H 1/ H 2=10/21 cm
By using high spatial and temporal resolution, together with the verifi cation of model into account, we can claim numerical results, can be used to conduct analyses. Figure 10 shows the time series of salinity in depth 10 cm. It can be seen the phase speed of the leading wave is approximately 10 cm/s, and it is 10.4 cm/s detected in the laboratory experiment, again they both have a good agreement. The waves have a strong interaction with the continental shelfslope when they reach topography, and then scatter upon the shoaling topography, either advancing further upslope, being partially refl ected, or being locally dissipated. It is clear that the transmitted wave has a phase speed of 6.7 cm/s, while the opposite
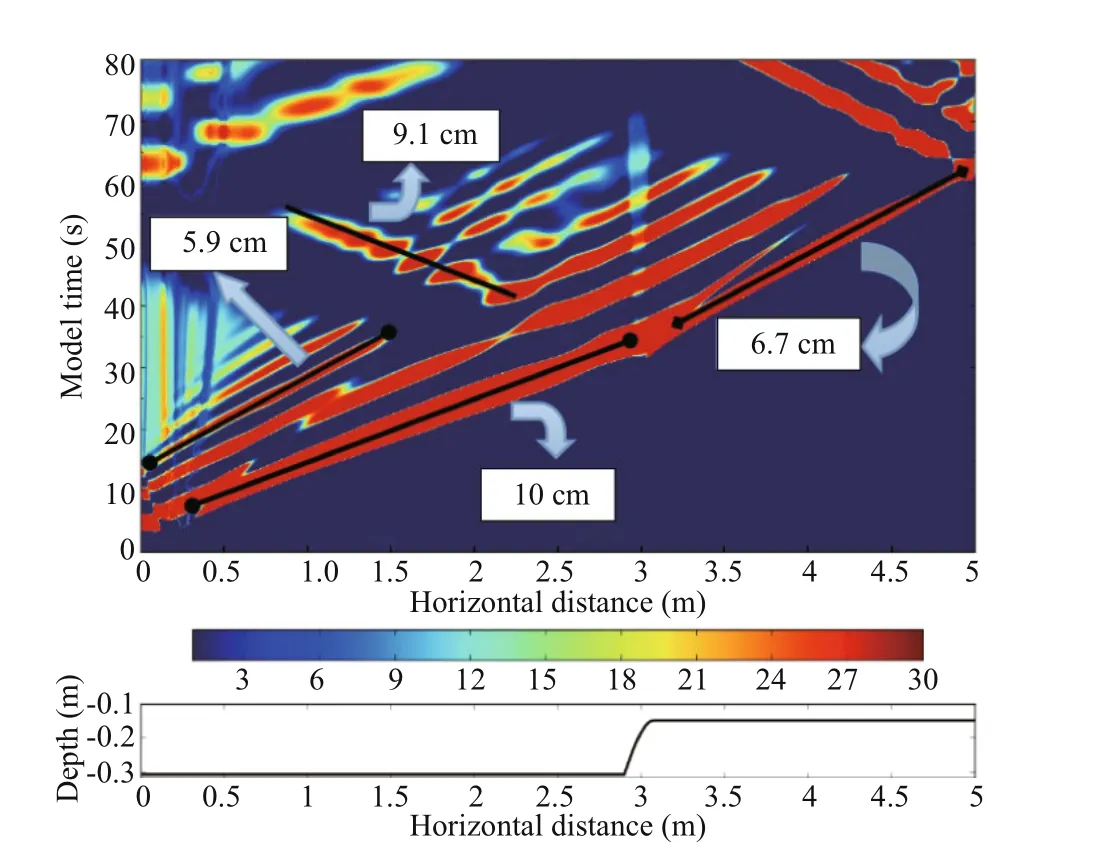
Fig.10 The time series of salinity in the depth 10 cm
The upper is the distribution of salinity in depth 10 cm, and the x-axis is the horizontal distance while the y-axis is the model run time. The lower panel is the corresponding topography. direction wave 9.1 cm/s. However, this opposite direction wave is not a refl ected wave, as its speed is signifi cantly larger than the refl ected wave. After combined consideration with the laboratory result, we guess it is possibly the gravity fl ow caused by the strong wave break and mixing when the waves encounter the topography. The trailing waves and some weak fl uctuations after the leading wave is also apparent in the fi gure.
4 DISCUSSION
4.1 The wave properties
According to a weakly non-linear theory, ISWs can be explained by Korteweg-de Vries equation:

In the formula, η is the wave displacement, subscripts x and t are spatial and temporal derivatives. α and β are the non-linear and dispersion coeき cients, respectively, for a two-layered fl uid, these coeき cients read

It can easily fi nd the non-linear coeき cientαis in proportional to the dimensionless factor δ mentioned above, despite the minor difference erences in notation. So the large dimensionless factor represents the prominent efference ect of non-linearity naturally, and that is the reason why large dimensionless factor corresponds with the close-theory standard waveform and large amplitude.
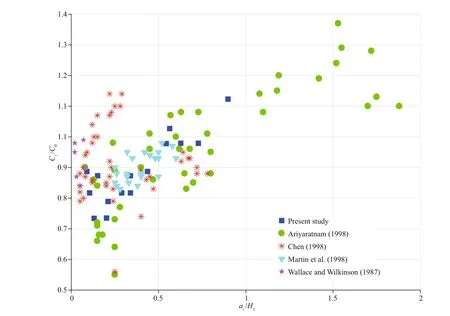
Fig.11 The relationship between the dimensionless speed and amplitude
The linear speed in the two-layered fl uid (Wessels and Hutter, 1996):

The relationship between normalized wave speed and amplitude when the thicknesses are the same (Xu and Yin, 2012):

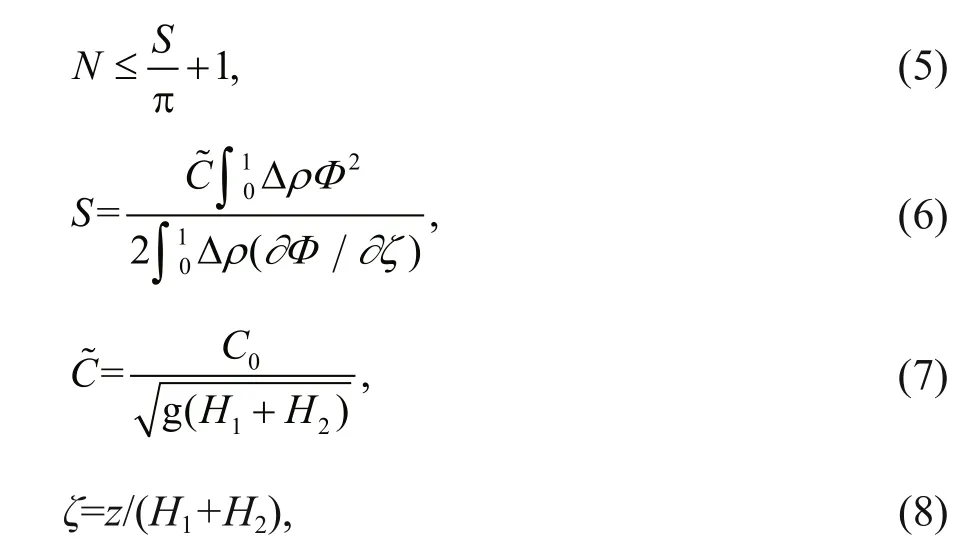
The number of internal solitary waves can be expected (Nakayama, 2006): where ρ and H are the densities and thicknesses of the two layers. If the speed of ISWs C > C0, then call C as supercritical speed; and C < C0, subcritical speed (Walker et al., 1998). The relationship between the dimensionless speed and amplitude is delineated in the plot depicted in Fig.11, and it can be shown that this research has a coincidence with the previous investigation (Wallace and Wilkinson, 1988; Ariyaratnam, 1998; Walker et al., 1998; Chen, 2004). According to Eq.4, when the thicknesses are the same, αwill approach to zero. The internal solitary wave will disappear and η0will become little. At the same time, the normalized wave speed will also get close to zero. Kdv theory is not suitable for explaining this condition.
In Eqs.5-8, z is the distance from the bottom of the tank when H1and H2are standardized. Φ changed with z linearly, with the boundary condition Φ(0)=0, Φ(1)=0. And Φ is 1 at the boundary between the two layers. According to Eq.5 we calculate N=1.07 when H1=0.1 m and H2=0.21 m.
4.2 The comparison between experimental result and KdV (mKdV) theory
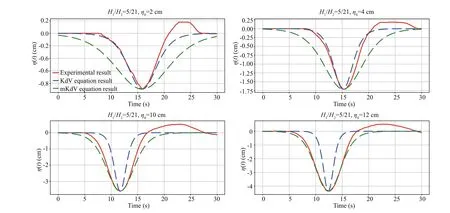
Fig.12 The time series of pycnocline fl uctuation on 10-cm location in the situation of H 1/ H 2=5/21 cm
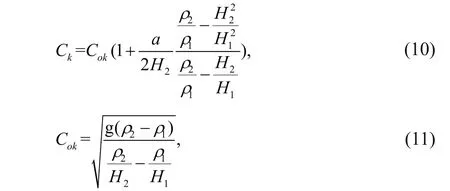
Michallet and Barthélemy (1998) divides ISWs into two types according to their amplitudes: smallamplitude ISWs ( a/ H <0.05) and large-amplitude ISWs ( a/ H >0.05). They also concluded that KdV theory agrees well with small-amplitude ISWs, while the mKdV theory has a prominent capability to delineate large-amplitude ISWs. For a two-layered fl uid, KdV equation has an analytical solution and read:

where η is the wave displacement, a is the amplitude, Ckis the theoretical speed, λ is the wavelength. It needs to connect with Eqs.10 & 11.
mKdV theory read:

Connecting with Eqs.13-18:

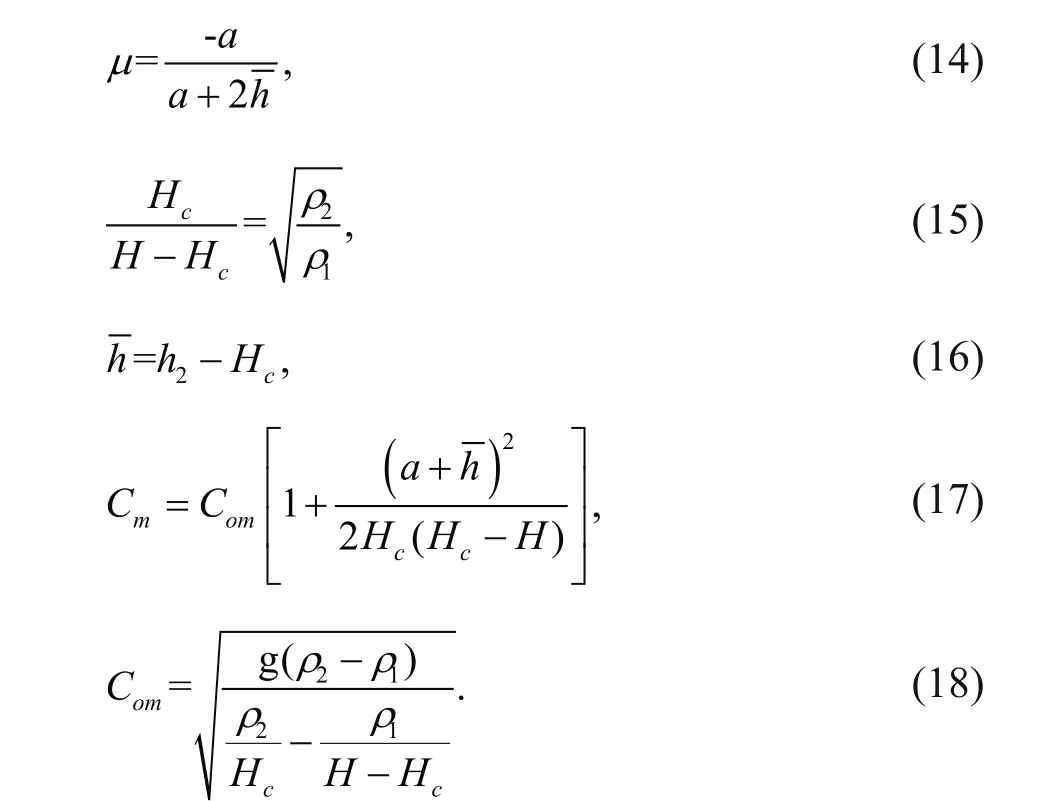
Figure 12 displays the comparison between theory and laboratory experiment. The value of a/ H is 0.029, 0.049, 0.11 and 0.14 corresponding to initial step depth 2 cm, 4 cm, 10 cm, and 12 cm, which indicates the fi rst two are categorized into smallamplitude ISWs and last two large-amplitude ISWs respectively. It is obvious that for small-amplitude ISWs, KdV theory has a better match than mKdV; whereas, for large-amplitude, mKdV is better, verifying the conclusions of Michallet and Barthélemy (1998).
4.3 Energy relationship
The transmitted wave, gravity fl ow, wave breaking, and wave mixing point out that energy analysis is maybe useful. The depth-integrated kinetic energy (KE) density is given by:
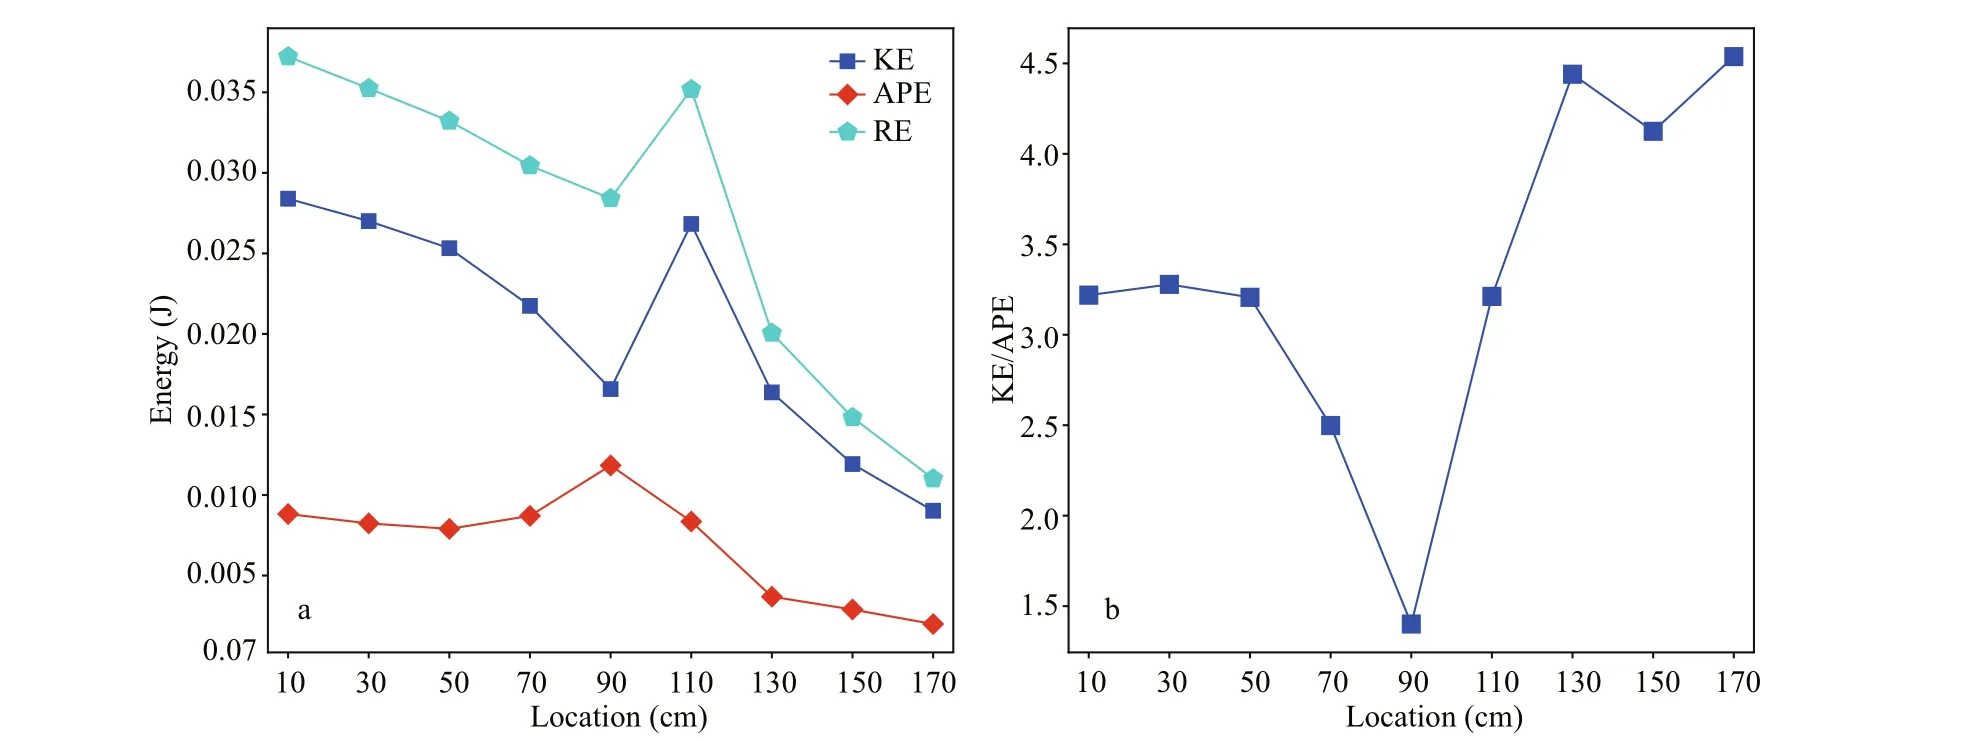
Fig.13 The distribution of energy on corresponding sections when the max-amplitude arrived at the section

In the formula, ρ0is the average density, and the bracket means calculating the average quantity during a wavelength. Vallis (2006) calculated the depthintegrated available potential energy (APE) density as the following formula:

In the formula, z matches the surface of equal density. The vertical integration is over the density range from 1 000.0 to 1 020.0 kg/m3. And the resultant energy is RE=APE+KE. Figure 13 illustrates the energy of corresponding sections when the main wave passed the section. Energy is concentrated on the main wave when the wave passed the section of 110 cm. The incident waves happened here are depression wave and transform to elevation waves after propagating onto the continental shelf-slope, compared with Fig.6. It is clear that the KE decreases rapidly while the APE increases simultaneously, and the APE reaches its peak on the continental slope (located at 90-cm in the picture), followed by a gradual decline, indicating a signifi cant dissipation. Because of the same reason, the KE also experiences a fall after propagating onto the continental shelf. The energy ratio KE/APE is ranged from 1.1 to 3.1, which is comparable with 1.04 reported by Moum et al. (2007) obtained on Oregon’s continental shelf, and 1.4 by Klymak et al. (2006) in the northern South China Sea.
5 CONCLUSION
This paper used a laboratory experiment and numerical simulations. Their results matched well, demonstrating that the ability of the numerical simulations to mimic the evolution of internal solitary waves, even in scales of laboratory water tank, and more importantly, since the laboratory experiments only provide the displacement of the interface, in addition to this, numerical simulations can also provide velocity profi led, which makes the occurrence of the exploration of energy budget. Besides, we obtain a set of parameterization scheme (such as the order of viscosity coeき cient) which could guide some further simulations.
We comprehensively investigate the propagation and evolution of ISWs over a continental shelf slope, considering three cases of stratifi cation, i.e., H1/ H2=5/26 cm, 7.5/23.5 cm, and 10/21 cm. Experiment results contain four aspects. Firstly, dimensionless factor δ=| H1- H2|/( H1+ H2) plays a key role in shaping the amplitude and waveform of incident ISWs. The amplitude is large, and the waveform is close to the theoretical standard waveform when the dimensionless factor δ is large, and on the contrary, the amplitude is small, and the waveform difference ers far from the theoretical standard waveform when the dimensionless factor δ is small. The essential of the relationship between dimensionless factor δ and amplitude and waveform is the nonlinearity. Secondly, the distribution of dimensionless amplitude and speed also coincides with the previous investigation. Thirdly, for ISWs whose amplitude is small, the continental shelf-slope plays a minor role. However, for those with a substantially large amplitude, the continental shelfslope does have some various infl uences. Fourthly, under difference erent ratio scenarios, for the case of H1/ H2=5/26, the polarity of ISWs is deepened when waves propagate to the continental shelf, while for the case of H1/ H2=10/21, the phenomenon of polarity transition emerges, and for the case of H1/ H2=7.5/23.5, ISWs transform into periodic waves.
Except these, the comparison between laboratory experiment and KdV (mKdV) theory shows that KdV theory is better in explaining small-amplitude waves, while mKdV is more suitable to largeamplitude waves. After that quantitative comparison between laboratory experiment and MITgcm model shows an unbelievable agreement, demonstrating the capability of the model to simulate ISWs in the laboratory tank and more importantly, provide some inspiration to how to tackle the parameterization to the real ocean simulation. Furthermore, based on the high resolution and accurate numerical result, we also conduct some analyses to phase speed and energy.
6 DATA AVAILABILITY STATEMENT
The experimental and numerical data that support the fi ndings of this study are available from the corresponding author on request.
7 ACKNOWLEDGMENT
We thank ZHANG Cunjie and LI Ziguang for their efference orts to improve the quantity of this article.
References
Apel J R, Holbrook J R, Liu A K, Tsai J J. 1985. The sulu sea internal soliton experiment. Journal of Physical Oceanography, 15(12): 1 625-1 651.
Ariyaratnam J. 1998. Investigation of Slope Stability Under Internal Wave Action. University of Western Australia, Australia.
Benjamin T B. 1966. Internal waves of fi nite amplitude and permanent form. Journal of Fluid Mechanics, 25(2): 241-270.
Chen C C. 2004. Experimental Study on the Propagation and Refl ection of Internal Solitary Wave from a Uniform Slop. National Sun Yat-Sen University, Taiwan, China.
Gerkema T, Zimmerman J T F. 2008. An introduction to internal waves. Texel: NIOZ, 207.
Grimshaw R, Pelinovsky E, Talipova T G. 1999. Solitary wave transformation in a medium with sign-variable quadratic nonlinearity and cubic nonlinearity. Physica D: Nonlinear Phenomena, 132(1-2): 40-62.
Grue J, Jensen A, Rusås P O, Sveen J K. 1999. Properties of large-amplitude internal waves. Journal of Fluid Mechanics, 380: 257-278.
Grue J, Jensen A, Rusås P O, Sveen J K. 2000. Breaking and broadening of internal solitary waves. Journal of Fluid Mechanics, 413(1): 181-217.
Helfrich K R. 1992. Internal solitary wave breaking and run-up on a uniform slope. Journal of Fluid Mechanics, 243(1): 133-154.
Holloway P E, Pelinovsky E, Talipova T, Barnes B. 1997. A nonlinear model of internal tide transformation on the australian north west shelf. Journal of Physical Oceanography, 27(6): 871-896.
Hsu J R C, Ariyaratnam J. 2000. Pressure fl uctuations and a mechanism of sediment suspension in swash zone. In: Proceedings of the 27th International Conference on Coastal Engineering. ASCE, Sydney. p.610-623.
Hüttemann H, Hutter K. 2001. Baroclinic solitary water waves in a two-layer fl uid system with difference usive interface. Experiments in Fluids, 30(3): 317-326.
Klymak J M, Pinkel R, Liu C T, Liu A K, David L. 2006. Prototypical solitons in the South China Sea. Geophysical Research Letters, 33(11): L11607.
Marshall J, Adcroft A, Hill C, Perelman L, Heisey C. 1997. A fi nite-volume, incompressible Navier Stokes model for studies of the ocean on parallel computers. Journal of Geophysical Research: Oceans, 102(C3): 5 753-5 766.
Michallet H, Barthélemy E. 1998. Experimental study of interfacial solitary waves. Journal of Fluid Mechanics, 366(1-2): 159-177.
Michallet H, Ivey G N. 1999. Experiments on mixing due to internal solitary waves breaking on uniform slopes. Journal of Geophysical Research: Oceans, 104(C6): 13 467-13 477.
Moum J N, Klymak J M, Nash J D, Perlin A, Smyth W D. 2007. Energy transport by nonlinear internal waves. Journal of Physical Oceanography, 37(7): 1 968-1 988.
Nakayama K, Imberger J. 2010. Residual circulation due to internal waves shoaling on a slope. Limnology and Oceanography, 55(3): 1 009-1 023.
Nakayama K, Kakinuma T, Tsuji H. 2019. Oblique refl ection of large internal solitary waves in a two-layer fl uid. European Journal of Mechanics-B/Fluids, 74: 81-91.
Nakayama K, Shintani T, Kokubo K, Kakinuma T, Maruya Y, Komai K, Okada T. 2012. Residual currents over a uniform slope due to breaking of internal waves in a twolayer system. Journal of Geophysical Research: Oceans, 117(C10): C10002.
Nakayama K. 2006. Comparisons of CIP, compact and CIPCSL2 schemes for reproducing internal solitary waves. International Journal for Numerical Methods in Fluids, 51(2): 197-219.
Ono H. 1975. Algebraic solitary waves in stratifi ed fl uids. Journal of the Physical Society of Japan, 39(4): 1 082-1 091.
Osborne A R, Burch T L. 1980. Internal solitons in the Andaman Sea. Science, 208(4443): 451-460.
Rocklifference N. 1984. Long nonlinear waves in stratifi ed shear fl ows. Geophysical & Astrophysical Fluid Dynamics, 28(1): 55-75.
Tsuji H, Oikawa M. 2007. Oblique interaction of solitons in an extended Kadomtsev-Petviashvili equation. Journal of the Physical Society of Japan, 76(8): 084401.
Vallis G K. 2006. Atmospheric and Oceanic Fluid Dynamics. Cambridge University Press, Cambridge. 745p.
Vlasenko V, Hutter K. 2002. Numerical experiments on the breaking of solitary internal wavesover a slope-shelf topography. Journal of Physical Oceanography, 32(6): 1 779-1 793.
Vlasenko V, Stashchuk N, Guo C, Chen X. 2010. Multimodal structure of baroclinic tides in the South China Sea. Nonlinear Processes in Geophysics, 17(5): 529-543.
Vlasenko V, Stashchuk N, Hutter K. 2005. Baroclinic Tides: Theoretical Modeling and Observational Evidence, Cambridge University Press, Cambridge.
Walker S A, Martin J A, Easson W J. 1998. An experimental investigation of solitary internal waves. In: Proceedings of the 17th International Conference on Ofference shore Mechanics and Arctic Engineering. ASME, Lisbon.
Wallace B C, Wilkinson D L. 1988. Run-up of internal waves on a gentle slope in a two-layered system. Journal of Fluid Mechanics, 191: 419-442.
Wessels F, Hutter K. 1996. Interaction of internal waves with a topographic sill in a two-layered fl uid. Journal of Physical Oceanography, 26(1): 5-20.
Xu Z, Yin B. 2012. Variability of internal solitary waves in the Northwest South China Sea. In: Marcelli M ed. Oceanography. InTech, Rijeka, Croatia. p.31-146.
Yuan C, Grimshaw R, Johnson E, Chen X E. 2018b. The propagation of internal solitary waves over variable topography in a horizontally two-dimensional framework. Journal of Physical Oceanography, 48(2): 283-300.
Yuan C, Grimshaw R, Johnson E. 2018a. The evolution of second mode internal solitary waves over variable topography. Journal of Fluid Mechanics, 836: 238-259. Zhu H, Lin C, Wang L, Kao M, Tang H W, Williams J J R. 2018. Numerical investigation of internal solitary waves of elevation type propagating on a uniform slope. Physics of Fluids, 30(11): 116602.
Zhu H, Wang L L, Avital E J, Tang H W, Williams J J R. 2017. Numerical simulation of shoaling broad-crested internal solitary waves. Journal of Hydraulic Engineering, 143(6): 04017006.
Zhu H, Wang L, Avital E J, Tang H W, Williams J J R. 2016. Numerical simulation of interaction between internal solitary waves and submerged ridges. Applied Ocean Research, 58: 118-134.
 Journal of Oceanology and Limnology2020年3期
- Journal of Oceanology and Limnology的其它文章
- List of the Most Outstanding Papers Published by CJOL/JOL in 2017-2018
- Who is the “murderer” of the bloom in coastal waters of Fujian, China, in 2019?*
- Efference ect of diets on the feeding behavior and physiological properties of suspension-feeding sea cucumber Cucumaria frondosa*
- Efference ects of light quality on growth rates and pigments of Chaetoceros gracilis (Bacillariophyceae)*
- Marine bacterial surfactin CS30-2 induced necrosis-like cell death in Huh7.5 liver cancer cells*
- PI3K/Akt pathway is involved in the activation of RAW 264.7 cells induced by hydroxypropyltrimethyl ammonium chloride chitosan*
