Study of syringe-free droplet microfluidic platforms enabling stable single-cell encapsulation*
FAN Beiyuan, LIU Lixing, LI Xiufeng, CHEN Deyong, WANG Wenhui, WANG Junbo†, CHEN Jian†
(1 State Key Laboratory of Transducer Technology, Institute of Electronics, Chinese Academy of Sciences, Beijing 100190, China; 2 University of Chinese Academy of Sciences, Beijing 100049, China; 3 Department of Precision Instrument, Tsinghua University, Beijing 100084, China)
(Received 10 October 2018; Revised 4 March 2019)
Abstract Negative pressures were used to generate droplets for single-cell encapsulations. Iodixanol was used to change the suspension solution densities in order to reduce the issue of cellular sedimentations. The effects of negative pressures and geometries of microfluidic T-channels on volumes and frequencies of generated droplets and the effects of iodixanol on the percentages of single-cell encapsulations were investigated and compared. This microfluidic platform may enable stable single-cell encapsulations, paving ways for single-cell analysis.
Keywords droplet microfluidics; single-cell encapsulation; negative pressure; iodixanol
一种可以实现稳定单细胞包裹的无进样器的微流控平台
范蓓媛1,2,刘力行1,2,李秀锋1,2,陈德勇1,2,王文会3,王军波1,2,陈健1,2
(1 中国科学院电子学研究所传感技术国家重点实验室, 北京 100190; 2 中国科学院大学, 北京 100049; 3 清华大学精密仪器系, 北京 100084)
摘 要液滴单细胞包裹技术是实现单细胞研究的有效方法。采用负压作为驱动力包裹单细胞,不再需要常规实验中会引起细胞吸附和降低单细胞包裹率的进样器和管路。在细胞悬浮溶液中加入碘克沙醇溶液调整溶液密度,进一步改善细胞沉降问题。研究负压大小和T型沟道几何尺寸对液滴频率和体积的影响以及碘克沙醇调整溶液密度后对单细胞包裹率的影响。该微流控平台可实现稳定的单细胞包裹,并为单细胞分析提供有利工具。
关键词液滴微流控;单细胞包裹;负压;碘克沙醇
CLCnumber:TP391.41;TN492Documentcode: Adoi:10.7523/j.issn.2095- 6134.2020.03.006
FanBY,LiuLX,LIXF,etal.Studyofsyringe-freedropletmicrofluidicplatformsenablingstablesingle-cellencapsulation[J].JournalofUniversityofChineseAcademyofSciences,2020,37(3):336-344.
*Supported by the National Basic Research Program of China (2014CB744600), National Natural Science Foundation of China (61431019, 61671430), Chinese Academy of Sciences Key Project Targeting Cutting-Edge Scientific Problems (QYZDB-SSW-JSC011), Instrument Development Program of the Chinese Academy of Sciences and Youth Innovation Promotion Association of Chinese Academy of Sciences
† Corresponding authors, E-mail: jbwang@mail.ie.ac.cn; chenjian@mail.ie.ac.cn
文章编号:2095- 6134(2020)03- 0336- 09
Droplet microfluidics produces microscale droplets (typically on the order of tens to hundreds of μm in diameter) of one fluid within a second immiscible carrier fluid based on microfabricated channels[1-4]. Since droplet microfluidics is capable of generating microscale droplets with physical and chemical isolations, it has been used in a variety of applications including directed evolutions, tissue printings and polymerase chain reactions[5-7].
As to cellular analysis, droplet microfluidics is a promising approach, which can effectively confine individual cells within each droplets, enabling single-cell analysis[8-11]. As pioneers, He et al.[12]combined optical trapping and microfluidic T-junctions to encapsulate single cells in aqueous droplets surrounded by an immiscible phase. Furthermore, droplet microfluidics also enabled the encapsulations of 1) lipid micro vesicles in water[13]and 2) agarose micro particles in oil[14].
Although well established, in conventional drop-let microfluidics, there is a loss of incoming cells as a function of time due to sedimentations and adhesions to walls of syringes and plastic tubes because of higher densities than surrounding solutions[15], leading to a significant decrease in the percentages of single-cell encapsulations as the experiments proceed.
In order to address this issue, several appr-oaches were mentioned briefly in previous publica-tions without comprehensive studies including verti-cal positions of syringe pumps[16], uses of magnetic bars to suspend cells within syringes[17-19]and density-matching solutions such as iodixanol[20-21]and Percoll[22].
In this study, the effects of iodixanol supple-mented solutions on single-cell encapsulations were investigated in a more systematic manner where multiple densities of iodixanol supplemented solu-tions and cell types were demonstrated and compared for single-cell encapsulations. In addition, negative pressures were used to generate droplets for single-cell encapsulations to get rid of the syringes and tubes used in conventional droplet microfluidics to further address the issue of cell sedimentations. In com-parison to previous studies, the developed micro-fluidic platform in this study was extensively charac-terized in droplet generations and single-cell confine-ments, enabling stable single-cell encap-sulations.
1 Materials and methods
1.1 Materials and cell culture
Unless otherwise indicated, all cell-culture reagents were purchased from Life Technologies Corporation (USA). Materials required for device fabrication included SU-8 photoresist (MicroChem Corp., USA) and 184 silicone elastomer (Dow Corning Corporation, USA). Iodixanol (320 mg I/mL) which was used to regulate the densities of cell-suspension solutions was purchased from GE Healthcare (USA). Mineral oil (M5904) and Span 80 (S6720) used for droplet generations were purchased from Sigma-Aldrich (USA).
All cell lines were purchased from China Infrastructure of Cell Line Resources and cultured in a cell incubator (3111, Thermo Scientific, USA) at 37 ℃ in 5% CO2. More specifically, the lung cancer cell line of A549 was cultured with RPMI-1640 media supplemented with 10% fetal bovine serum and 1% penicillin and streptomycin. The colon cancer cell line of SW620 was cultured with L-15 media supplemented with 10% fetal bovine serum and 1% penicillin and streptomycin. The breast cancer cell line of MCF 10A was cultured with DMEM/F-12 media supplemented with 1% NEAA, 5% HS, 10 μg/mL insulin, 20 ng/mL EGF, 100 ng/mL cholera toxin, 0.5 μg/mL hydrocortisone, and 1% penicillin and streptomycin. Phosphate buffer saline (PBS) was supplemented with iodixanol as a supplemented PBS with a volume ratio and a solution density of 1∶ 0.109 and 1.05 g/mL, 1∶ 0.182 and 1.07 g/mL, 1∶ 0.265 and 1.09 g/mL, or 1∶ 0.361 and 1.11 g/mL, respectively. Immediately prior to an experiment, cells were trypsinized, centrifuged and resuspended in the supplemented PBS at a cell density of 2.5 million cells per mL.
1.2 Device design and fabrication
In this study, a microfluidic T-junction for droplet generations and single-cell encapsulations was adopted from previous publications[19, 23-28]. More specifically, the critical dimensions of the T-shaped micro channels were 50 μm in width, 25 μm in height and ~5 mm in length. In addition, two aqueous inlets with variations in width (50 & 100 μm) and one oil inlet with variations in width (100 & 300 μm) were used and compared for droplet generations (see Fig. 1(a)).
The microfluidic device was fabricated based on conventional soft lithography including patterning of SU-8 based photoresist and molding of polydimeth-ylsiloxane (PDMS) based channels[19, 27]. Briefly, SU-8 25 was spin coated, exposed and developed to form the fluid flow channels with a height of 25 μm. The PDMS precursor and curing agents (10∶1 by weight) were thoroughly mixed, degassed, and poured onto the SU-8 channel masters for crosslinking (4 h at 80 ℃). Fully cured PDMS micro channels were then peeled away, punched with through holes as inlets and outlets.
The water-in-oil droplet generations require four sides of hydrophobic channel walls, and thus PDMS precursor and curing agents (10∶1 by weight) were thoroughly mixed, degassed, and spin coated on a glass slide, forming a fully cured PDMS membrane at a thickness of 100 μm. Patterned PDMS channels and spin coated PDMS membranes were then activated by oxygen plasma and bonded together on a hotplate (8 h at 120 ℃) (see Fig.1(b)).
1.3 Device operation and data analysis
As the first step, the generations of droplets based on negative pressures were realized, charac-terized and compared. The microfluidic device was positioned on an inverted microscope (IX71, Olympus, Japan), and the mineral oil supplemented with 4% (w/w) Span 80 as the surfactant was flushed to the channels for bubble removals. Then inlets were filled with approximately 25 μL either oil or PBS. A negative pressure of 3, 5, 7, or 9 kPa was generated by a pressure controller (Pace 5000, Druck, USA) and after two minutes of flow stabi-lizations, 5 images per second were captured by a sCMOS camera (Zyla 4.5, Andor, UK, Exposure time: 0.1 ms) for a duration of eight minutes in total.
These recorded data were analyzed based on ImageJ (National Institute of Health, USA) to quantify the length and the frequency of the generated droplets. In order to calculate droplet volumes, the quantified droplet length and the cross-section area of the microfabricated channel was multiplied. Note that in this calculation, the droplets under measurements were treated as a cube where the fronting and back curves of the droplets were not taken into considerations.
In addition, four pressure values including 3, 5, 7, and 9 kPa were used in this study to generate droplets for comparisons. Furthermore, microfluidic channels with differences in geometries were also used for comparisons in order to investigate the effects of geometrical variations on the volumes and frequencies of generated micro droplets.
In the experiments of single-cell encapsu-lations, cells suspended in supplemented PBS solu-tions at a volume of 25 μL were applied to the aqueous inlets. Based on the results of droplet gene-rations, optimized pressure values of 7 kPa and a certain channel geometries (width of 300 μm for the oil inlet and width of 100 μm for two aqueous inlets) were used in the following studies for single-cell encapsulations. Using ImageJ, the numbers of droplets containing 0, 1, and more cells were counted and divided by the total numbers of droplets generated during the recording periods to obtain the cell-encapsulation percentages. Note that three types of cells (e.g., A549, SW620 and MCF 10A) and four mass densities of supplemented PBS solutions (1.05, 1.07, 1.09, and 1.11 g/mL) were used for comparisons.
1.4 Statistics
In each group, the measurements of multiple samples (>=3) were conducted with results expressed by averages ± standard deviations. ANOVA was used for multiple-group comparisons where values ofP<0.05 (*) were considered as statistical significances. More specifically, ANOVA was used to evaluate whether there exists significant differences 1) of volumes and frequencies of generated droplets by multiple negative pressures and channel geometries; 2) of percentages of single-cell encapsulations among multiple time points under a certain mass density of iodixanol supplemented PBS.
2 Results and discussion
In conventional droplet microfluidics, syringes and tubes are key components for the transportations of cell suspensions to T-junctions for single-cell encapsulations. However, due to cellular sedimen-tations to the surfaces of syringes and tubes, gradual decreases in cell densities were observed in conventional droplet microfluidics, leading to decreased rates of single-cell encapsulations as experiments proceeded with time.
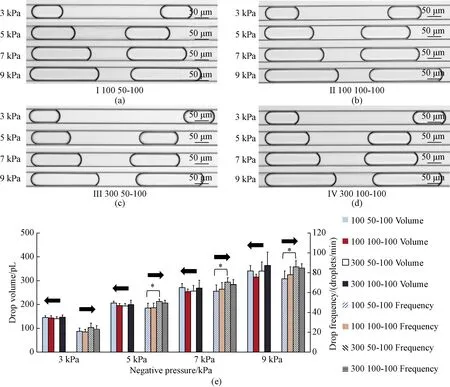
In order to address this issue, in this study, negative pressures were used for droplet generations and single-cell encapsulations where syringes and tubes were no longer used. The effects of applied pressures on the volumes and frequencies of generated droplets were investigated (see Fig.2 and Table 1). More specifically, the volumes and frequencies of formed droplets were (146.7±9.2) pL and (23.0±3.7) droplets/min under the negative pressure of 3 kPa, (199.6±18.2) pL and (49.4±2.8) droplets/min under the negative pressure of 5 kPa, (268.9±32.8) pL and (68.2±4.8) droplets/min under the pressure of 7 kPa, (363.5±56.2) pL and (84.7±4.4) droplets/min under the pressure of 9 kPa.
Based on these results, it was observed that increases in negative pressures lead to increases in both the volumes and the frequencies of the generated droplets, consistent with previous publi-cations[29-30]. Note that in previous droplet genera-tions based on negative pressures, no cellular encap-sulation was demonstrated. For single-cell analysis, droplets featured with high frequencies and low volumes are preferred and thus after a trade-off consideration, 7 kPa was chosen as the optimal aspiration pressure for the following single-cell encapsulations.
Note that although this microfluidic generator based on negative pressures has a much lower throughput (1 droplet/s) than conventional counterparts (100 droplets/s), the droplet generator reported in this study can operate with much longer experimental durations by supplementing cell suspensions at the cell inlets in comparison to conventional droplet generators which suffer the key issue of cell losses as experiments proceed with time.

(*represents P<0.05)Fig.2 Microscopic images of generated droplets (a-d) and volumes and frequencies of generated droplets (e)

Channel Geometries/μm3kPa5kPa7kPa9kPaVolume/pLFrequency/(droplets/min)Volume/pLFrequency(droplets/min)Volume/pLFrequency/(droplets/min)Volume/pLFrequency(droplets/min)10050-100145.2±7.521.0±3.3206.0±7.844.3±4.9270.6±17.161.3±6.4340.8±22.673.9±7.9100100-100143.4±9.320.3±2.7195.7±8.444.8±4.5253.8±11.263.4±6.6314.7±12.077.9±8.130050-100140.0±8.324.8±4.4193.4±10.651.1±2.3256.2±24.070.6±4.3339.8±38.685.9±6.2300100-100146.7±9.223.0±3.7199.6±18.249.4±2.8268.9±32.868.2±4.8363.5±56.284.7±4.4
In addition, the effects of geometrical variations on droplet formations were also investigated (see Table 1 and Fig. 2). These experimental results indicate that the effects of channel geometries on droplet volumes can be neglected, since among individual groups with geometrical variations, no significant differences were noticed. Meanwhile, increases in channel width of oil or aqueous inlets were observed to increase the frequencies of gene-rated droplets. Taking the negative pressure of 7 kPa as an example, when the width of the oil inlet was increased from 100 to 300 μm without changing the geometries of aqueous inlets, the frequencies of droplets were increased from (61.3±6.4) to (70.6±4.3) droplets/min. Since in single-cell encapsula-tions, a high frequency of droplet generations is preferred, in the following experiments, the micro-fluidic channels with the lowest flow resistances (the width of 300 μm for the oil inlet and 100 μm for the two aqueous inlets) were used.
In the experiments of single-cell encapsu-lations, pure PBS solutions were supplemented with iodixanol to match the densities of cells in order to address the side effects of cellular sediments. Note that iodixanol[20-21]rather than Percoll[22]was used in this study for density regulations since Percoll pro-duces a significantly higher autofluoresce in com-parison to iodixanol, which may have side effects on the downstream analysis relying on fluorescent detections such as fluorescence activated cell sorting and fluorescence based protein assays. Since the mass densities of cells were unknown, supplemented PBS solutions with mass densities of 1.05, 1.07, 1.09 and 1.11 g/mL were prepared for comparisons.
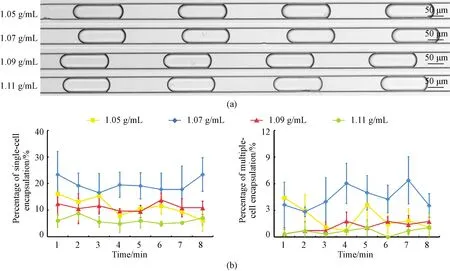
As to the cells used for single-cell encap-sulations, three types of tumor cells including A549, SW620 and MCF 10A were used at a suspending density of 2.5×10⁶cells/mL. Based on the Poisson distributions, the ideal percentages of single-cell encapsulations were estimated as ~30%. Fig. 3(a) shows the microscopic images of A549 cells encapsulated in droplets at four solution densities after eight minutes of experiments. Based on image processing, the percentages of single-cell encapsula-tions for A549 cells were quantified as 11.3%±3.3% (1.05 g/mL), 19.6%±2.4% (1.07 g/mL), 11.2%±1.3% (1.09 g/mL) and 6.1%±1.2% (1.11 g/mL) (see Fig. 3(b) and Table 2).

Fig.3 Microscopic images of A549 single-cell encapsulations (a) and percentages of A549 single and multiple-cell encapsulations (b)

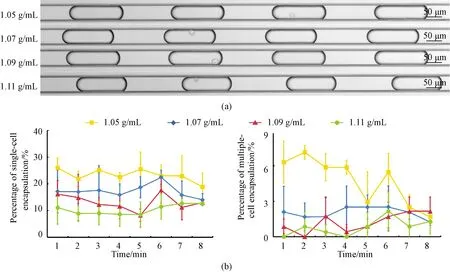
Time/minPercentages of single-cell encapsulations of A549 cells/%Percentages of single-cell encapsulations of SW620 cells/%Percentages of single-cell encapsulations of MCF 10A cells/%1.05g/mL1.07g/mL1.09g/mL1.11g/mL1.05g/mL1.07g/mL1.09g/mL1.11g/mL1.05g/mL1.07g/mL1.09g/mL1.11g/mL116.2±2.823.4±8.712.5±4.36.0±2.520.6±3.913.8±5.514.2±5.010.5±6.226.1±3.717.2±8.016.2±5.111.1±6.2213.2±2.319.2±4.810.6±5.78.8±2.626.4±4.612.6±1.89.3±3.210.2±2.021.8±2.917.1±4.414.9±8.68.9±2.9315.3±1.016.6±7.311.7±3.15.6±2.020.7±4.415.2±3.210.1±1.57.7±1.325.2±1.217.6±9.312.3±2.79.0±4.348.0±2.219.5±4.79.7±0.84.9±3.223.9±6.912.2±1.38.5±4.54.1±0.622.6±1.715.9±4.211.1±4.78.6±4.5510.6±0.619.2±4.99.5±2.36.0±2.721.2±6.79.6±4.110.5±2.18.1±1.625.6±6.418.7±3.98.3±2.38.5±4.8611.6±3.017.8±6.213.8±2.64.9±1.024.0±6.29.2±1.112.5±1.99.0±2.523.1±4.022.5±2.717.7±4.911.5±4.779.4±0.917.8±8.710.9±3.45.3±0.124.4±3.79.6±4.211.6±5.97.8±2.423.0±7.715.8±5.211.2±4.712.7±1.886.1±4.123.4±6.310.9±2.57.1±2.727.9±5.911.2±2.810.8±2.69.7±1.718.9±5.214.1±2.313.0±0.212.8±0.8
These results indicated that for the supplemented PBS solutions with a mass density of 1.07 g/mL, the highest percentages of single-cell encapsulations were obtained in comparison to other mass densities of 1.05, 1.09 and 1.11 g/mL. Note that for the experiments relying on pure PBS solutions, the results were not included in Fig. 3 since after two or three minutes, no microscopic pictures of single-cell encapsulations were located any more. Meanwhile, the results of single-cell encapsulations at 1.07 g/mL (e.g., 19.6%±2.4%) were still lower than the ideal values calculated from the Poisson distributions (29.0% for single-cell encapsulations). It was speculated that A549 cells may have variations in densities, and for the portions of A549 cells with densities different from 1.07 g/mL, they may be unevenly suspended in solutions, leading to decreases in the percentages of single-cell encapsulations.
As to the ratios of multiple-cell to single-cell encapsulations, ~25% was obtained for both ideal situations based on the Poisson distributions and the experimental results in this study, which may have some side effects and function as potential distur-bances. Further experiments are needed to optimize mass densities of cell suspensions to address this concern.
Furthermore, no significant differences were located for the percentages of single-cell encapsulations among different time points at the optimal density of 1.07 g/mL, which were quantified as 23.4%±8.7% (1 min), 19.2%±4.8% (2 min), 16.6%±7.3% (3 min), 19.5%±4.7% (4 min), 19.2%±4.9% (5 min), 17.8%±6.2% (6 min), 17.8%±8.7% (7 min), and 23.4%±6.3% (8 min). These results indicate the current microfluidic platform can realize stable single-cell encapsulations. Note that in this study, eight minutes were used since for experiments to charac-terize the activities of tumor cells in suspensions, they are suggested to be finished within an hour following trypsinization. The same experimental proce-dures were repeated three times and thus the time durations of each experiment was only eight minutes. Theoretically, this experiment can proceed much longer without the concerns of cellular sediments and gradual decreases of incoming cell densities.
In order to further validate the developed microfluidic platform, SW620 (see Fig.4) and MCF 10A (see Fig.5) cells were also tested. In comparison to A549 cells which showed highest percentages of single-cell encapsulations at a mass density of 1.07 g/mL, both SW620 and MCF 10A cells produced the highest percentages of single-cell encapsulations at the mass density of 1.05 g/mL, which were quantified as 23.6%±2.5% (SW620) and 23.3%±2.2% (MCF 10A), respectively (see Table 2). These results indicate that compared to A549 cells, both SW620 and MCF 10A cells demonstrated lower mass densities. Furthermore, no significant decreases in the percentages of single-cell encapsulations were located for both SW620 (e.g., 20.6%±3.9% at 1 min, 26.4%±4.6% at 2 min, 20.7%±4.4% at 3 min, 23.9%±6.9% at 4 min, 21.2%±6.7% at 5 min, 24.0%±6.2% at 6 min, 24.4%±3.7% at 7 min, and 27.9%±5.9% at 8 min) and MCF 10A (e.g., 26.1%±3.7% at 1 min, 21.8%±2.9% at 2 min, 25.2%±1.2% at 3 min, 22.6%±1.7% at 4 min, 25.6%±6.4% at 5 min, 23.1%±4.0% at 6 min, 23.0%±7.7% at 7 min, and 18.9%±5.2% at 8 min) as a function of time, validating the capability of the developed platform of generating stable single-cell encapsulations.

Fig.5 Microscopic images of MCF 10A single--cell encapsulations (a) and percentages of MCF 10A single and multiple-cell encapsulations (b)
3 Conclusion
This manuscript demonstrated a microfluidic platform enabling the stable generations of single-cell encapsulations, producing 1) optimized droplet volumes of (268.9±32.8) pL at the frequency of (68.2±4.8) droplets/min and 2) the optimal percentages of single-cell encapsulations of 19.6%±2.4% for A549 cells at 1.07 g/mL, 23.6%±2.5% for SW620 cells at 1.05 g/mL and 23.3%±2.2% for MCF 10A cells at 1.05 g/mL. In comparison to previous studies, the developed microfluidic platform in this study was extensively characterized in droplet generations and single-cell confinements, enabling the stable single-cell encapsulations.

