An Integrated Multi-Level Early Warning Method for Rainfall-Induced Shallow Landslides1
ZHAO Binbin,KONG Xiao'ang,OU Wenhao,LIU Yi and YANG Zhi
1)Faculty of Engineering,China University of Geosciences,Wuhan 430074,China
2)China Electric Power Research Institute Co.,Ltd.,Beijing 100055,China
Rainfall-induced landslides have occurred frequently in Southwestern China since the Wenchuan earthquake,resulting in massive loss of people's life and property.Fortunately,landslide early-warning is one of the most important tools for landslide hazard prevention and mitigation.However,the accumulation of historical data of the landslides induced by rainfall is limited in many remote mountain areas and the stability of the slope is easily affected by human engineering activities and environmental changes,leading to difficulties to accurately realize early warning of landslide hazards by statistical methods.The proposed warning method is divided into rainfall warning component and deformation warning component because the deformation induced by rainfall has the characteristic of hysteretic nature.Rainfall,tilted angle and crack width are chosen as monitoring indexes.Rainfall grade level that contains rainfall intensity and duration information is graded according to the variation of the safety factor calculated by 3-D finite difference numerical simulation method,and then is applied using the strength reduction method and unascertained information theory to obtain the deformation grade level of several monitored points.Finally,based on the system reliability theory,we establish a comprehensive landslide warning level method that provides four early warning levels to reflect the safety factor reductions during and post rainfall events.The application of this method at a landslide site yield generally satisfactory results and provide a new method for performing multi-index and multi-level landslide early warnings.
Key words:Landslides;Early warning;Rainfall;Deformation;Unascertained degree theory
INTRODUCTION
Landslide is one of the most destructive natural disasters and may cause catastrophic damage to human life and property(Ering P.et al.,2016).Rainfall-induced landslides occur frequently in Southwestern China after earthquakes,and the damage caused by such failures is substantial and long-lasting.Therefore,it is important to mitigate the effect of landslides by using the early warning system composed of local monitoring sensors combined with a warning analysis method.However,many challenging issues regarding the current landslide early warning applications still exist,including the determination of the landslide threshold and the delineation of more comprehensive warning levels based on multiple monitoring indexes.
The first issue-the threshold of the landslide initiation or the early warning level—must provide sufficient advance reaction time for users.There are generally two techniques used to obtain the threshold of landslide initiation.One is based on statistics and data mining,such as the intensity-duration(1-D)rainfall model proposed by several previous studies.For example,Saito H.et al.(2010)applied the sample statistics method to 1 174 landslides that had occurred in Japan during the 2006-2008 and obtained the critical amounts of rainfall necessary to trigger a landslide in different zones of Japan.Brunetti M.T.et al.(2010)used a Bayesian statistical method and frequency analysis to determine the critical amount of rainfall required to trigger a landslide in Italy.Another famous landslide warning model is the Satio model,which is based on the deformation rate(Saito M.,1965).Data mining is also widely used in landslide warning,including the Grey system theory-based model,the nonlinear dynamics model,the multiparameter prediction method and the neural network prediction method(Tien Bui D.et al.,2016).Early warning methods based on statistics and data mining have higher accuracy in areas monitored during a long period and have a large volume of statistical data.The other type of early warning model is based on mechanics(Thiebes B.et al.,2014;Pumo D.et al.,2016;Yang K.H.et al.,2017).However,if warning methods provide only simple warning threshold(Bíl M.et al.,2016)or determine the warning level based on experience(Greco R.et al.,2013),its accuracy may depends on the subjective experience.The critical factor in rainfall-induced landslide is rainfall infiltration that breaks the stress balance system of the slope.Therefore,key factors that are important in theoretical method research are the stress distribution of the slope and the hydrological response of unsaturated slopes subjected to rainfall infiltration.
The second issue in early warning method is the selection and use of the suitable indexes.Most existing warning methods use a single index to determine the threshold,such as rainfall,displacement or inclination angle(Intrieri E.et al.,2012;Gariano S.L.et al.,2015).Recently,monitoring the landslides and angular displacements has become popular for landslide research and early warning(Yin Yueping et al.,2010;Fan Y.B.et al.,2017).However,in practice,several types of sensors are installed in landslide areas,and even for the same type of sensor,a number of different landslide position points are usually monitored(Allasia P.et al.,2013).In the slope deformation process,sensors of the same type installed at different points on a slope may output distinctively different values.It is not sufficient to determine the stability of a slope using any single sensor,and a field inspection is often required before any further decisions(Yin Yueping et al.,2010).Therefore,the existing threshold determination method is not adequate for the current monitoring plans.So it is necessary to apply a comprehensive warning method that considers the output of multiple types of sensors and multiple monitoring points on the same slope.
In this research,we select the tilt meter and crack meter for deformation monitoring and the rain gauge for rainfall monitoring.These instruments are characterized by low cost and high reliability.Besides,their monitoring data can be returned to the data terminal in real time.We obtain the relationship between the safety factor and the slope inclinations by 3-D finite-difference numerical simulation.Based on the results,we define the grade level for each index.Then,we apply the unascertained measurement theory(Wang Guangyuan,1990)to calculate the grade level of the deformation.Meanwhile,we compute the relationship between the safety factor and the rainfall intensity and duration based on the strength theory model of unsaturated soils.We further define the rainfall grade levels according to the variations in safety factors with respect to the rainfall intensity and duration.Finally,we calculate the comprehensive grade-level risk of landslides based on the system reliability theory(Fenton G.A.et al.,2008),thereby achieving real-time multi-index and multilevel early landslide warning.Fig.1 shows a flow chart of this early warning method.
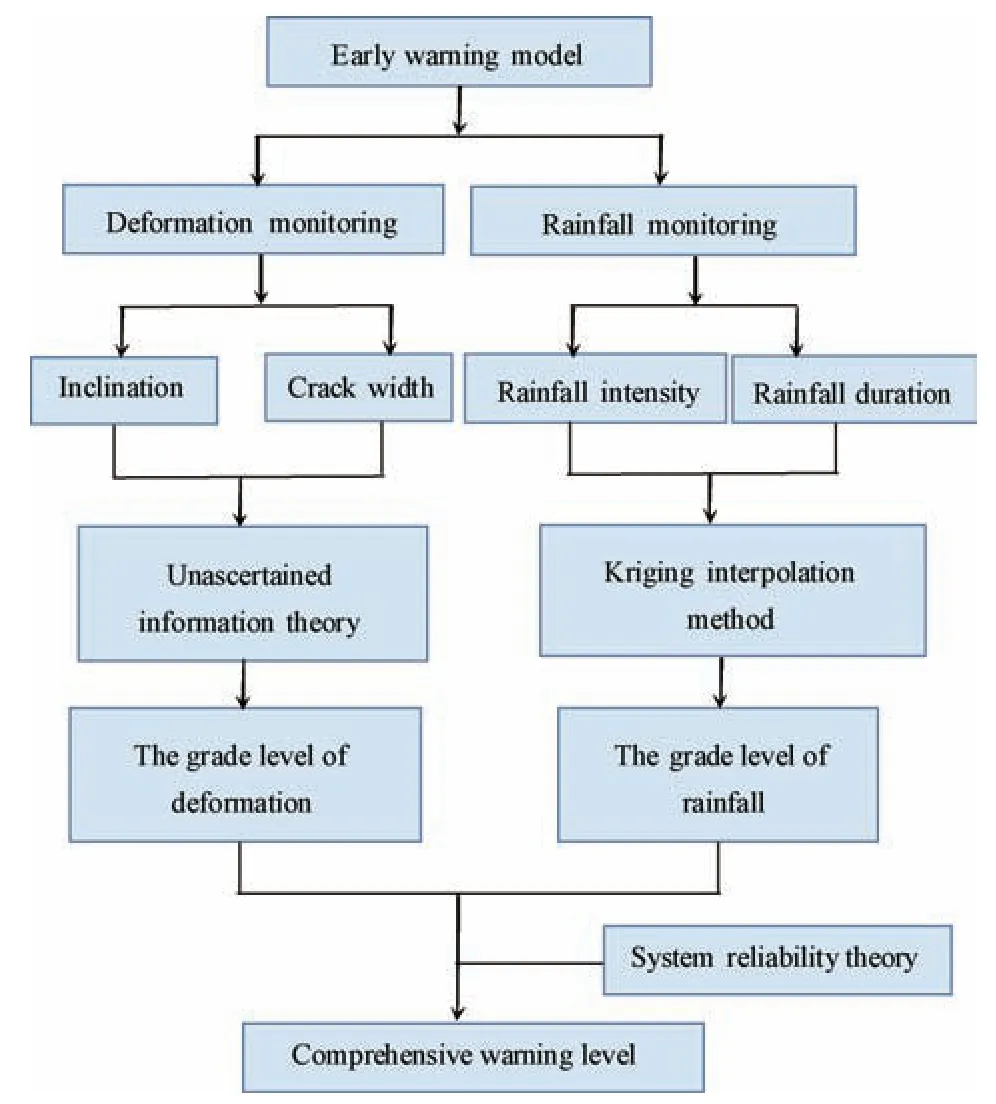
Figure 1 Flow chart of the early warning method
1 DESCRIPTION OF LANDSLIDE SITE BEING MONITORED
The study area is located in Zhaojue County,Sichuan Province(102.54° E,27.84°N).The highest altitude of the site is 3 150 m and there is a transmission tower on the slope.The surface of the slope is mainly composed of 3-m thick gravelly soil and sandy gravel.The accumulation layer between the bedrock and surface soil is dominated by grey purple conglomerate,with gray sandstone and mudstone,local thin coal and carbonaceous mudstone.The bedrock is mainly composed of sandstone and silty mudstone.The slope is about 35 degrees.To ensure the stability of the transmission tower,a 12-m wide concrete retaining wall has been constructed in the lower part of tower foundation,as shown in Fig.2.At the transmission tower,we further install a rain gauge,which can repeatedly record rainfall intensity at 15-min intervals.Fig.2 also shows the layout of the inclinometers and crack gauges,wherein the inclinometer monitoring points are numbered 1,2 and 3 and the crack gauge points are indicated by A and B.The inclinometer and crack gauge both record data hourly.
The safety factor is a traditional factor used to evaluate the stability of a slope.As such,it is reasonable to determine the early warning threshold or grade level based on the safety factor.In this section,we apply the three-dimensional finite difference code FLAC3Dto analyze the effect of rainfall infiltration on safety factor of a slope,i.e.,to correlate rainfall intensity and duration with the safety factor.Hock E.(2019)believed that under most open-pit mining conditions the short-term stability of a slope must have a safety factor value of 1.3 and,for a long-term slope stability,the value should be 1.5.Lee considered that the common safety factor value for a slope to maintain its stability range between 1.2-1.3(Cai Meifeng,2002).Schuster R.L.(1996)indicated that the safety factor of a highway slope design must generally be within the range of 1.25-1.5.On the basis of the above studies and experience,we divide the levels of landslide risk into four grades.Table 1 shows the relationship between the safety factor and the hazard grade.In detail,the risk grade Ⅰ,which corresponds to a safety factor≤1.05,is empirically determined and represents the most emergent state when a slope nearly loses its stability.The risk grade Ⅳrepresents a conservatively safe slope state according to the authors of the previous studies.To provide a practical guide for progressive action,we further insert two intermediate risk levels between levels Ⅰand Ⅳ.
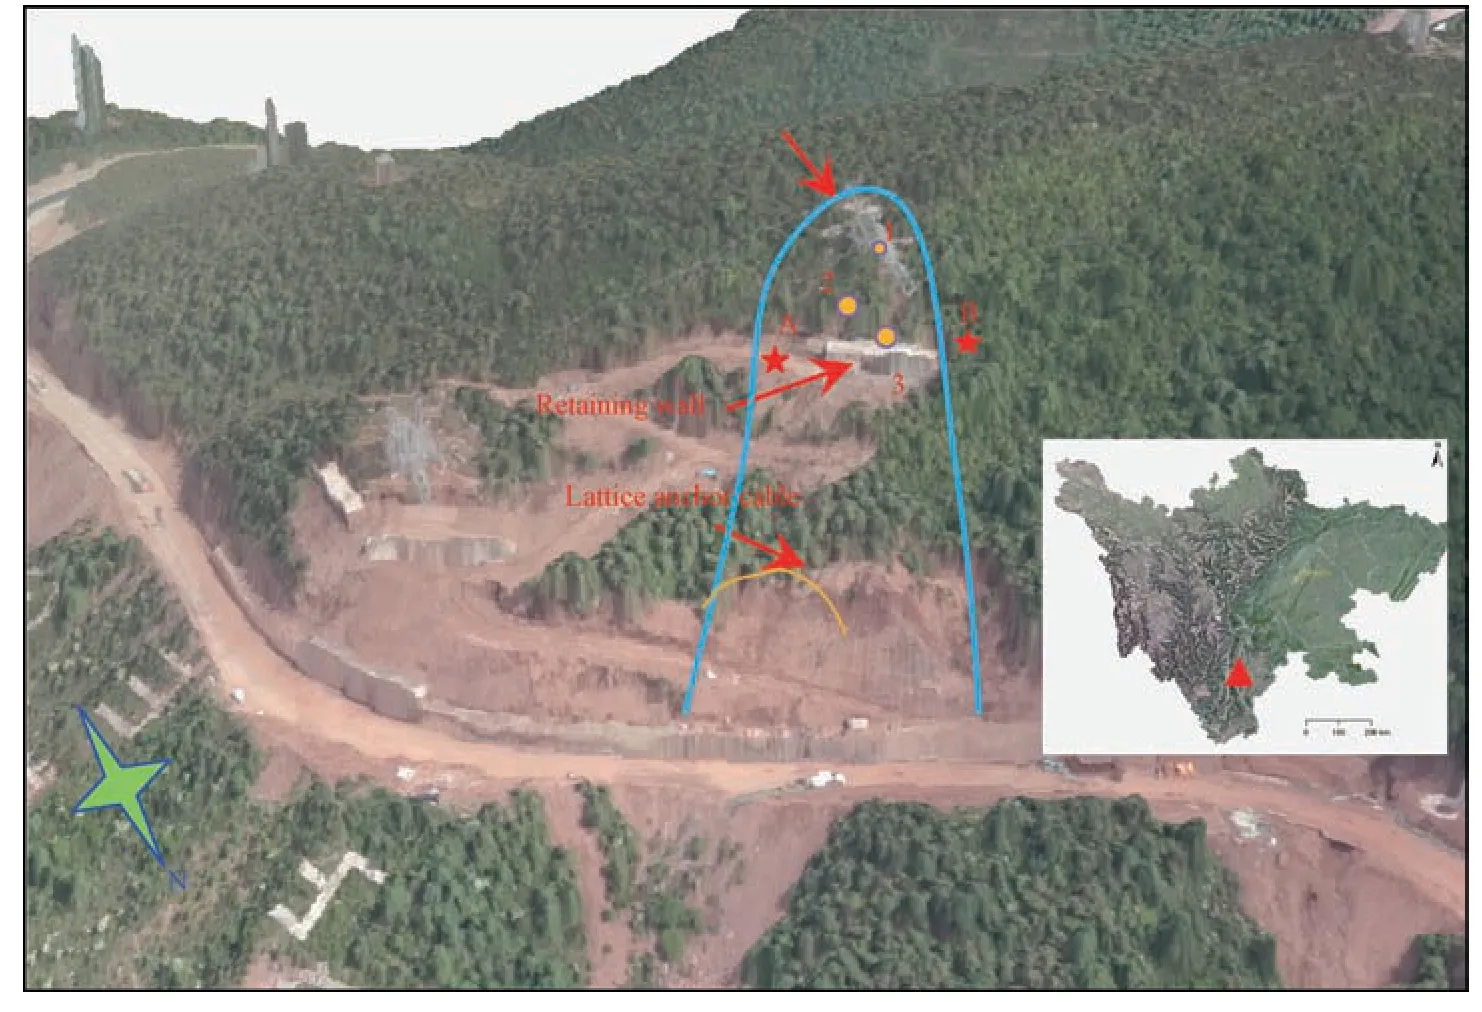
Figure 2 Topography of the study area

Table 1 Relationship between safety factor and landslide risk grade level
2 GRADE LEVEL OF RAINFALL
Rainfall is one of the major causes of landslides.However,it is not always easy to determine a rainfall threshold based on the statistical analysis of rainfall-induced landslide data.For areas with limited historical rainfall and landslide data,it is possible to obtain the rainfall threshold for a landslide by numerical simulation.We conduct a comprehensive geological survey of the monitored landslide site to obtain detailed geomorphological and geological data for the use in a numerical analysis of the landslide deformation process after rainfall infiltration.
2.1 Numerical Simulation with Respect to Rainfall Infiltration
We analyze the stability of the slope based on our numerical simulation results with respect to rainfall infiltration.We used the relationship between the safety factor and the rainfall intensity and duration to determine the rainfall warning level.In this study,we use FLAC3DVer.5.0(Itasca,2012)to analyze the stability of unsaturated slopes.Fig.3(a)shows the geometric model in our numerical simulation of an area with the dimensions 132 m×89 m×143 m.Approximately 50 986 elements and 55 569 nodes are used in the computation.The model is fully constrained in all directions at the basal plane,and the left and right planes are constrained in the normal direction.Besides,we adopt the Morh-Coulomb model for our constitutive model.Based on the geological survey report and the Hoek-Brown failure criterion,we reduce the rock mass parameters by the GSI value(Hoek E.et al.,1997)and obtain the soil parameters by numerical back analysis based on the results of a triaxial experiment and an in-situ direct shear test(Fakhimi A.et al.,2004).The highway slope is reinforced by mortar bolt with an interval of 3 m.The bolt bore has a diameter of 110 mm and the length of the bolt ranges from 8 m to 12 m.Table 2 lists the soil and rock mass parameters.
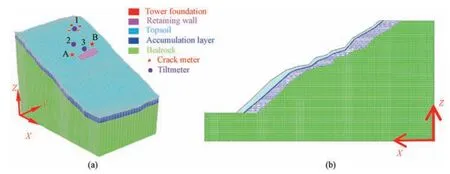
Figure 3 The geometry of the landslide

Table 2 Rock mass and soil parameters
In the simulation,we calculate the relative permeability as defined by Van Genuchten M.T.(1980)as follows:

whereaandbare fitting parameters.Seis the effective saturation,which yields the following expression(Mualem Y.,1976):

whereSris the residual saturation,Swis the water saturation,ψ(Pa)is the matric suction andP0(Pa)is a parameter that approximately depends on the air-entry value.
From Eqs.(1)and(2),we can conclude that the coefficient of permeability varies constantly in the presence of negative pore-water pressure.Therefore,the key to the slope unsaturation calculation is to adjust the coefficient of permeability in terms of the matric suction in the solution process.We use the FISH language of FLAC3Dto correct the element permeability coefficient and node saturation,thereby obtaining the unsaturated seepage field of the slope.
The formula for calculating the element osmotic volume force of the equivalent seepage force is as follows(Itasca,2012):

where{Fs}is the equivalent nodal load induced by osmotic force,γwis the density of water and[N]is a shape function.His the water pressure function of the seepage field when the soil is partially saturated.We calculate the quantitative change in the rock soil strength using Fredlund's theory of unsaturated soil strength(Fredlund D.G.et al.,2012):

whereσ′nis the effective normal stress on the failure plane,uwis the pore water pressure andφbis the angle of internal friction with the change in the matric suction.
After applying the pore-water pressure caused by rainfall,we are able to obtain the safety factor of the slope using the response surface method(RSM)(Cho S.E.,2016),which can be written as follows(Zienkiewicz O.C.et al.,1975):

whereFsis the reduction factor andC′andφ′are the effective cohesion and friction angle,respectively.
We set the surface of the slope model as the discharge boundary,the bottom of which is impermeable.With respect to the left,right,front and back surfaces,we set the zone above the underground water level to be impermeable,and the zone below the underground water level as the boundary of the pore water pressure.The permeability coefficient of the bedrock is 2×10⁻¹⁰(m2/Pa·s).Table 3 shows the soil seepage parameters and Fig.4 shows the relationship between the suction,relative saturation and relative permeability of the topsoil.

Table 3 Seepage parameters
2.2 Analysis of Numerical Simulation Results
Historical rainfall data for Zhaojue County suggest that the rainfall intensity mostly range from 0 mm/hr to 10 mm/hr,and rarely exceed 10 mm/hr.Even when the rainfall intensity exceed 10 mm/hr,its duration is less than 1 hr.Therefore,we apply rainfall intensities of 2 mm/hr,4 mm/hr,6 mm/hr,8 mm/hr and 10 mm/hr in our simulations.According to the hydrogeology report,the decrease in the matric suction with the ground elevation is 1.14 kPa/m.During the rainfall,the infiltration has caused a change in the matric suction and the formation of a transient saturated zone,which increases the weight of the topsoil.With the increase in the pore-water pressure,the effective stress decreases,and the shear strength decreases accordingly.To demonstrate,Fig.5 shows a simulation of the development of pore-water pressure(Pa)with time for a rainfall intensity of 6 mm/hr.Fig.5(b)-5(d)show that the pore-water pressure changes from negative to positive.During the rainfall process,a large transient saturated zone with positive pore water pressure appear in the slope.After 36 hours,the negative pore-water pressure significantly disappears,and the slope tends to be saturated.
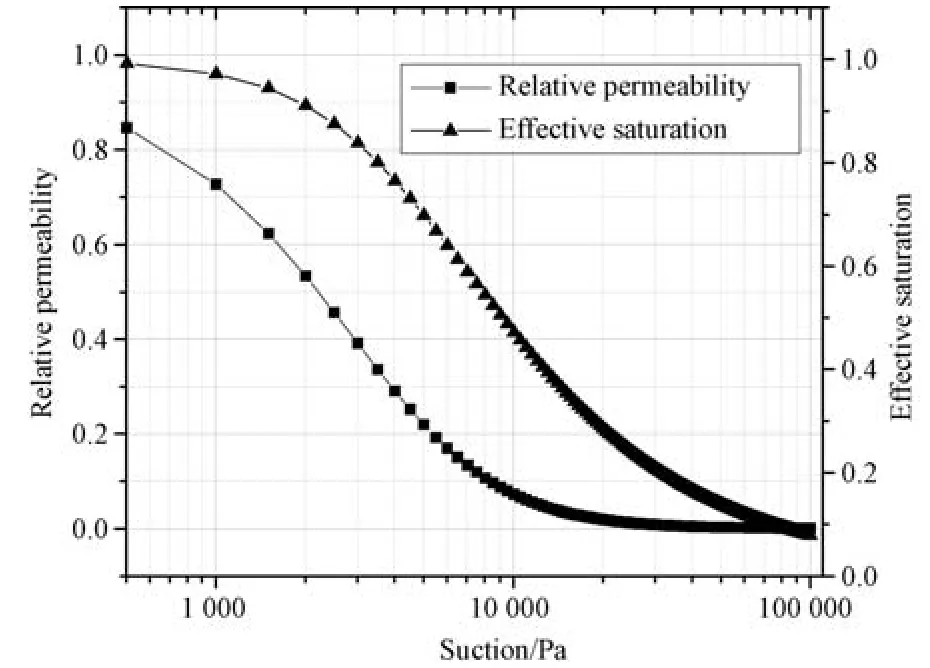
Figure 4 Relationship between suction,relative saturation and relative permeability of the topsoil
From Table 1,we determine the rainfall grade levels that correspond to different levels of slope stability,as shown in Table 4.

Table 4 The rainfall grade levels that correspond to different levels of slope stability
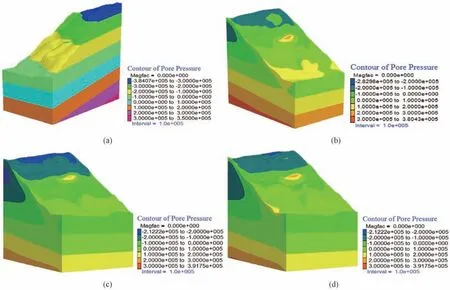
Figure 5 Pore-water pressure(Pa)at different times in the simulation with a rainfall intensity of 6 mm/hr
Using the Curve Fitting Toolbox of Matlab software and the Kriging interpolation method(MATLAB,2009),we fit the relation between rainfall intensity,rainfall durationand the safety factor.Fig.6 shows a three-dimensional contour map of the safety factor variations with rainfall intensity and duration.We can see that when the rainfall intensity is less than 6 mm/hr and the duration is longer than 24 hr,the safety factor remains greater than 1.05.When the rainfall intensity is greater than 8 mm/hr and the duration is longer than 12 hr,the safety factor is also greater than 1.05 and the landslide risk remains in a high level.
2.3 Grade Level Results of Rainfall
According to the monitored rain gauge results,three heavy rainfall events occurred on November 9th,10thand 12th,2016.The rainfall intensity on November 11threached 67.5 mm/day.Therefore,we use the equivalent rainfall duration to compute the risk grade.The cumulative rainfall can be calculated by considering the temporal and spatial variations,radiation intensity,evaporation capacity and soil infiltration capacity(Pan Huali et al.,2012),as follows:

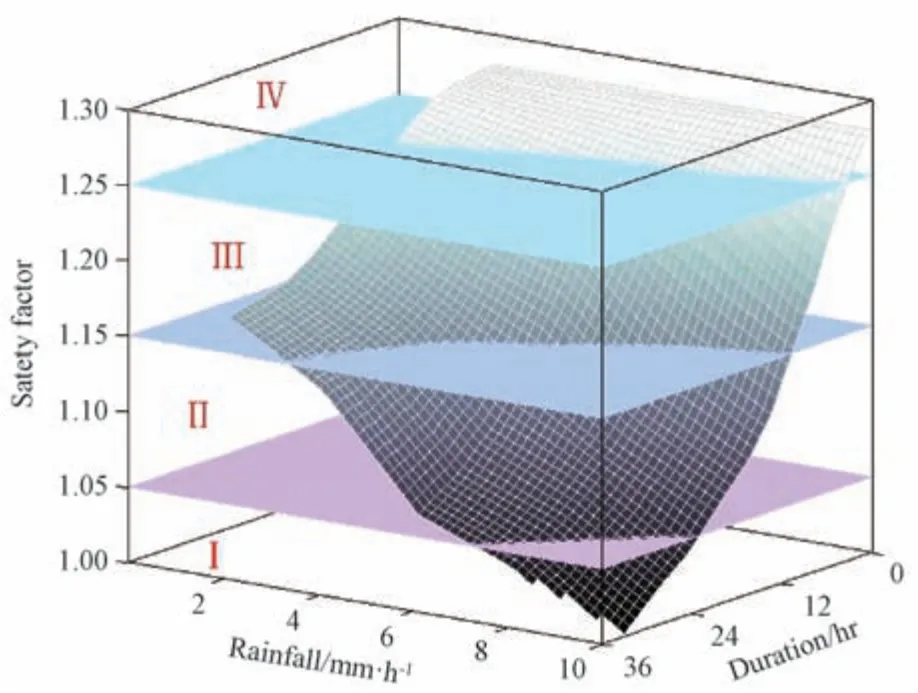
Figure 6 Three-dimensional contour map of the safety factor variations with rainfall intensity and duration
wherePn(n=1,2,3…,n)is the rainfall of daynbefore the current monitoring period(mm)andKis the decreasing coefficient.In hydrological calculations,the value ofKranges from 0.8-0.9.The appropriateKvalues can be determined based on the weather conditions,such as sunny,cloudy or hazy days.The valueKis able to reach 0.85 for the abundant sunlight in Zhaojue area,which is a plateau region with high elevation.The total cumulative rainfall of the current monitoring periodPtolcan be expressed as follows:

wherePais the cumulative rainfall during the monitoring day.If we suppose the current rainfall intensity isIt,the equivalent rainfall durationcan be written as follows:

In Fig.7,we can see that the grade level is III when the rainfall intensity exceeds 30 mm/d.The grade level reaches II due to the heavy rainfall on November 12th,2016.
3 GRADE LEVEL OF LANDSLIDE DEFORMATION
In the preceding section,we establish the relation between the safety factor and a onetime occurrence of rainfall.Theoretically,using the aforementioned method to find the relationship between slope deformation and rainfall seems viable.However,in practice,the slope deformation is not simply the result of one rainfall occurrence,but is a product of the total effect from several previous rainfall events.As a result,the deformation is actually accumulated deformation.In addition,it is also difficult to simulate a series of rainfall events over a long period,since weakening of the parameters also occurs with time.Therefore,we must take into account the contribution of preceding rainfall events by other simulation techniques,such as the strength reduction method(SRM)(Zhang Yonghui et al.,2010).Accordingly,we can obtain the relation between the safety factor and the accumulated deformation.As introduced in section 1,indexes of the monitored slope deformation include inclination and crack width,and the method for obtaining their grade levels are introduced below.
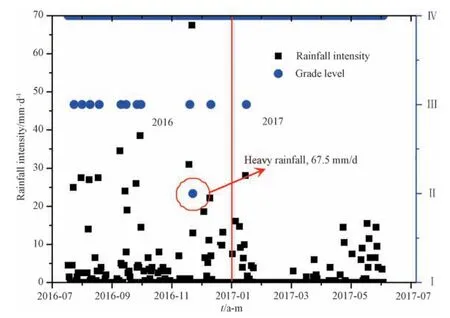
Figure 7 Landslide risk grade levels for different rainfall intensities during the field test
3.1 Relationship Between Safety Factor and Inclination
SRM can be used to directly extrapolate the relationship between the safety factor and deformation(Cheng Y.M.et al.,2007).Based on the results,we can define the grade level of each deformation index.
The safety factor of the slope is 1.28,as calculated by the SRM using FLAC.The respective contours of theZ-direction displacement and the shear strain increment are plotted in Figs.8 and 9,for which the maximumZ-direction on the surface of the slope is 3.41 cm.Figs.10 and 11 show the method for calculating the inclination in theX-direction.Suppose that the surface point of the drill hole isOand after deformation that point changes toO′.The point in the bottom of the drill hole isPand after deformation of the slope that point isP′.The vectorais(x1,z1),vectorbis(x2,z2+3),vectorcis(x1-x2,z1-z2+3)and vectordis(0,3).The dip angleθin theXdirection can be written as follows:

Similarly,the dip angle in theYdirection can be written asβ,as follows:

Fig.12 shows the variation of the landslide risk grade during a yearlong rainfall period,which is computed using the fitting function.In the actual monitoring process,rainfall intensity can be either variable or steady,so it is hard to accurately simulate this discontinuous process.It also shows the relationship between the safety factor and inclination.We can define the grade level of each inclination index based on the relationships shown in Fig.12.
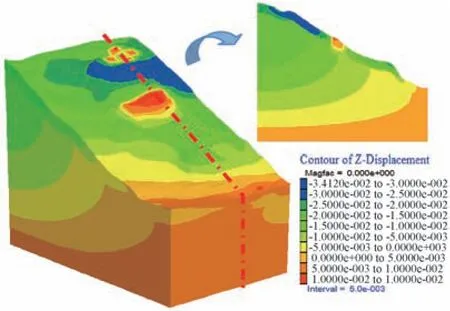
Figure 8 Contour of the Z-direction displacement
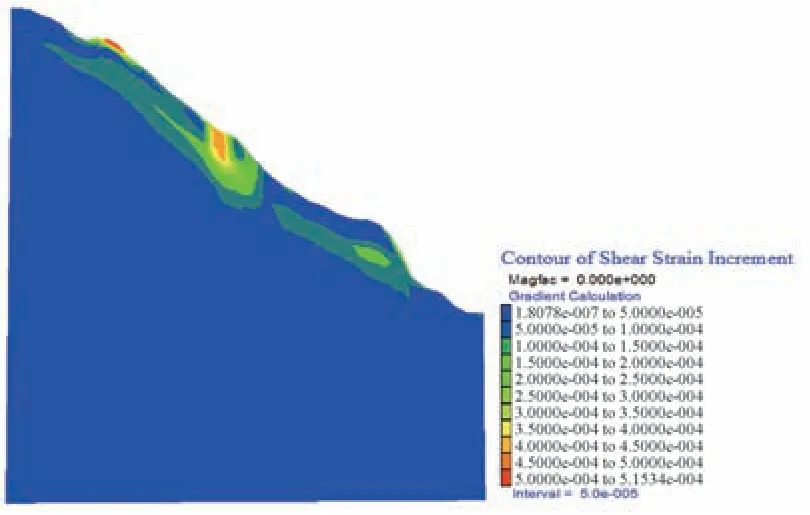
Figure 9 Contour of the shear strain increment
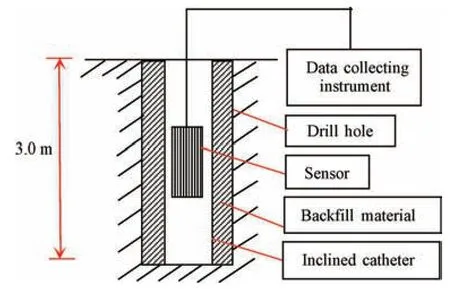
Figure 10 Schematic diagram of the tiltmeter
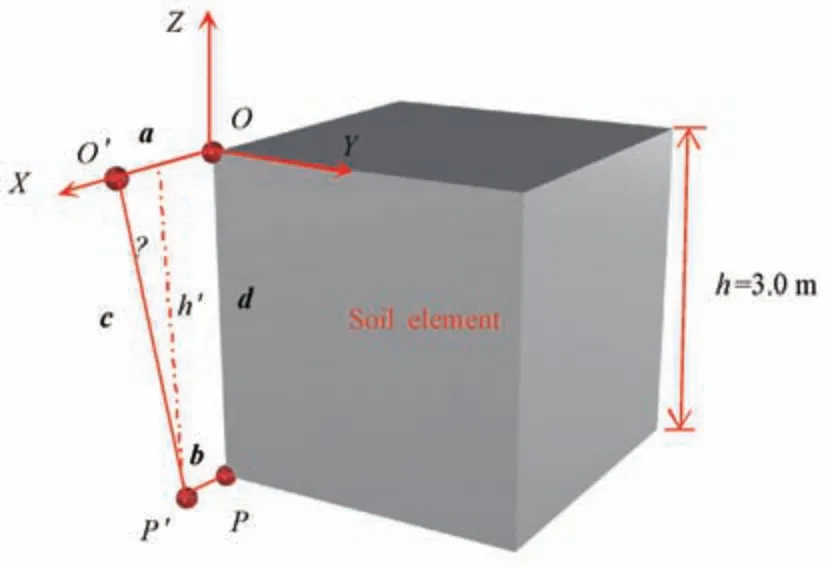
Figure 11 Diagram of the method used to calculate the displacement in the X direction
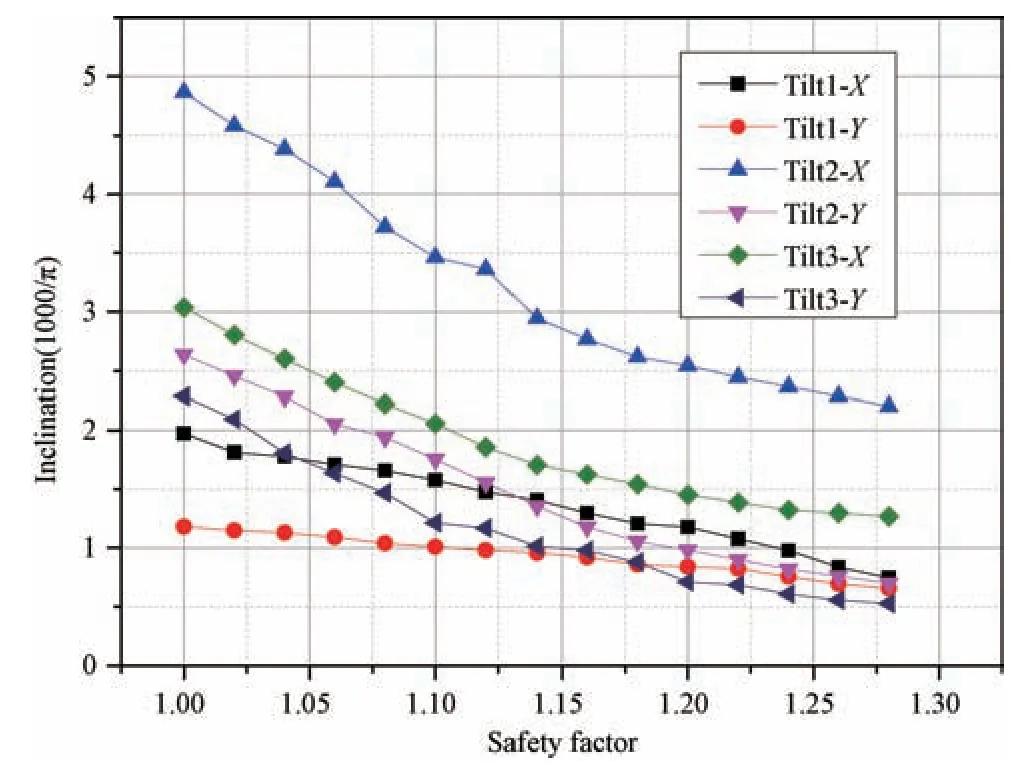
Figure 12 Relationship between the safety factor and inclination
3.2 Grade Levels of Inclination and Crack Width
At present,no mature method exists that can accurately consider both crack propagation and slope deformation in one numerical simulation.In Chinese industrial design codes(GB 50330-2013 and Q GDW 1173-2014),cracks with a slope exceeding 20 mm are defined as reaching an unstable deformation that requires intensified monitoring.On the basis of this standard and practical experiences,we empirically classify the grade levels of crack widths,as shown in Table 4.The inclination values that correspond to each grade level,based on the results described in section 2.2 are also shown in Table 5.

Table 5 Classifications and values of qualitative indexes
3.3 The Theory of NIT
Since we monitor several indexes on the slope and install inclinometers at several points,it is necessary to perform one comprehensive evaluation based on the overall deformation data.Consequently,to merge all the deformation data,we utilize the unascertained information theory(UIT),which was first applied to architectural engineering research by Wang Guangyuan in 1990(Wang Guanyuan,1990).This theory is popular in mining and geotechnical engineering and is characterized by the quantitative analysis of several unascertained factors to achieve a comprehensive evaluation(Dong Longjun et al.,2008;Liu Aihua et al.,2010).In the following sections,we introduce the procedure for implementing the UIT.
Suppose the evaluation object spaceRhasnobjects,andR={R1,R2,…,Rn}.Each object ofRi=(i=1,…,n)hasmevaluation indexes,so the evaluation index space isX={X1,X2,…,Xm}.Then,Rican be written asRi={xi1,xi2,…,xim},wherexijis the measured value of the evaluation objectRiwith respect to the evaluation indexXi.For differentxij(i=1,2,…,n;j=1,2,…,m),the contribution to the evaluation resultRidiffers.Eachxijhaspevaluation grades of{C1,C2,…,Cp}.
The evaluation spaceUis written asU={C1,C2,…,Cp}.SupposeCk(k=1,2,…,p)is thekth evaluation grade,which is higher than the(k+1)th one.If the grading rank{C1,C2,…,Cp}satisfiesC1>C2>…>CporC1<C2<…<Cp,it can be calledthe ordered partition class of the evaluation spaceU.
3.3.1 Unascertained Measurement of Single Index
Unascertained measurement can be defined as

whereμijkis the grade ofxijbelong to thekth evaluation grade ofCk,which satisfies as follows:

Where Eq.(13)process is called normalization,and it is defined as a non-negative bound.Eq.(14)process is called additivity.Then,ifμsatisfying Eqs.(13)-(15),it is called the unascertained measurement.The matrix(μijk)m×pcan be written as follows:

3.3.2 Determination of Index Weights
Thewjis characterized by the relative extent of importance of the measured indexXj,andwjsatisfies 0≤wj≤1.wjis defined as the weight ofxj.The index weight vectorwis written asw=(w1,w2,…,wm).Then,wjis calculated by the following steps(Shamilov A.,2007):

After obtaining single index evaluation matrix of the unascertained measurement,we can measurewjby Eqs.(17)and(18).
3.3.3 Composite Unascertained Measurement of Multiple Indexes
As the unascertained measurement of a single index and the index weights are obtained,the comprehensive unascertained measurement of multiple indexes can be calculated as:

whereμiksatisfies 0≤μik≤1,
3.3.4 Optimization Results for Recognizing and Sequencing
To obtain the final results of the evaluated multiple objects,we should adopt the credible degree identification criterion,where byλ(λ≥0.5)is defined as the credible degree.If the evaluation space{C1,C2,…,Cp}meets the criteriaC1>C2>…>Cp,the following formula will be a true statement:

Then,Ribelongs to thek0th evaluation grade ofCk0.
Define score value ofClasIl.The unascertained superiority degreeQRiof the evaluation objectRiis written as:

whereQ=is called the vector of the unascertained superiority grade.The superiority grade ofRiis ordered based on the magnitude of
3.3.5 Construction of Unascertained Measurement Function of Single Index
Next,we construct the unascertained measurement functions of a single index to calculate the evaluation indexes based on unascertained measurement function and the classifications shown in Table 4.Fig.13 shows plots of the unascertained measurement function of each deformation index.Then,we calculate the weights of the indexes using Eqs.(13)-(18).
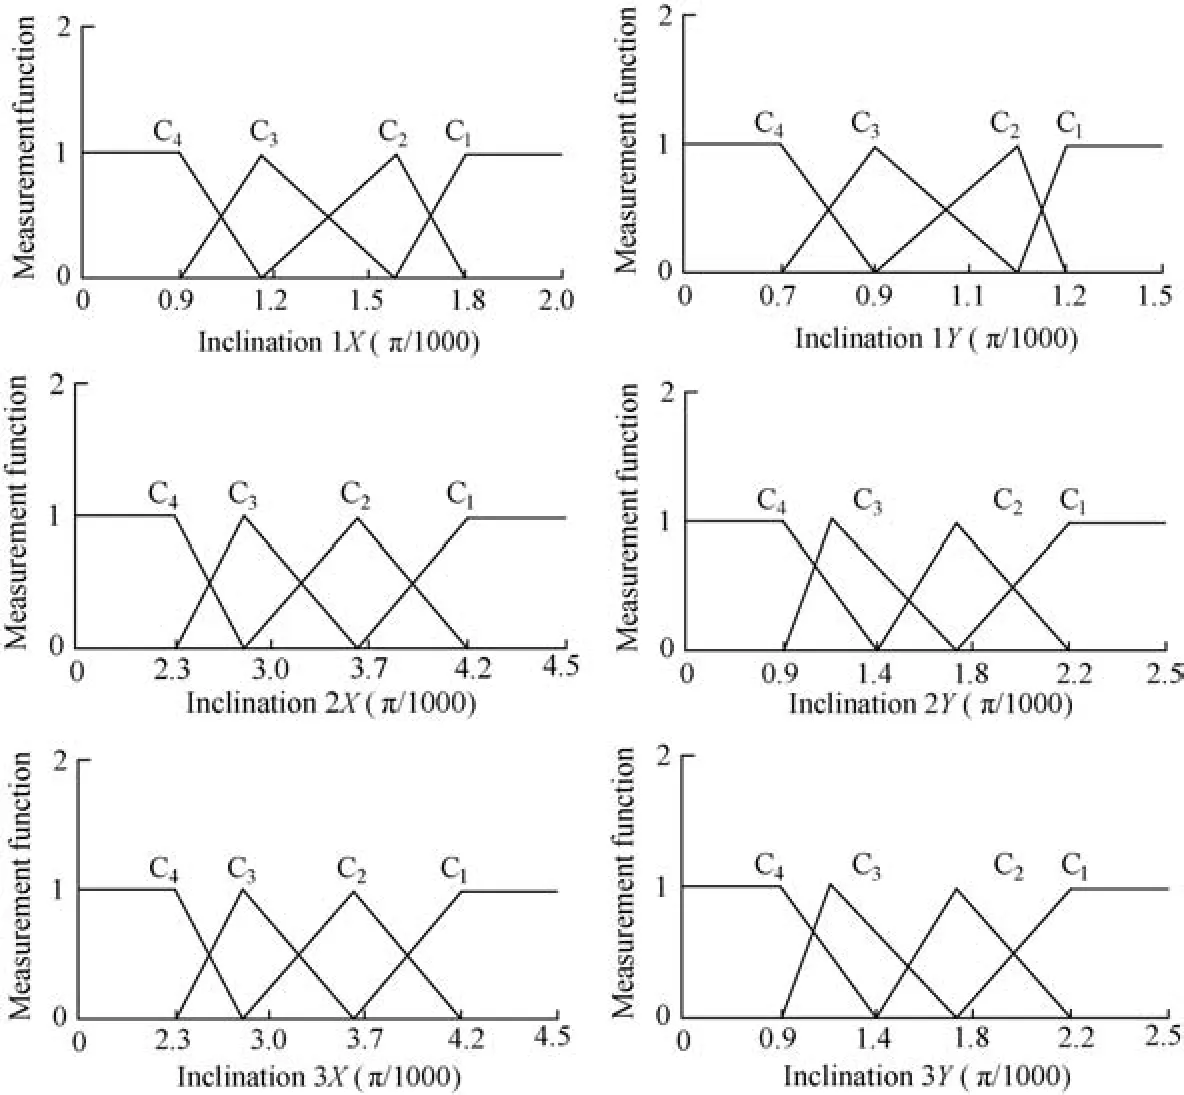
Figure 13 Unascertained measurement function of evaluation indexes
3.4 Grade Level Results
Next,we apply digital filtering to all the deformation monitoring data,which are shown in Fig.14.In Fig.14(a),we can see that there is no obvious increase of crack width after August 2016.Fig.14(b)shows that the inclination detected by tiltmeter 1 is relatively small;Fig.14(c)shows that the inclination detected by tiltmeter 2 exhibits ladder growth;and Fig.14(d)shows that the inclination detected by tiltmeter 3 increases slowly.
Taking the heavy rainfall on November 12th,2016 as an example,we input the eight deformation monitoring indexes into the measurement function,respectively,and calculate the evaluation matrix as follows:
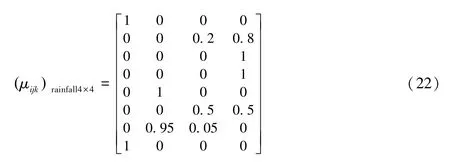
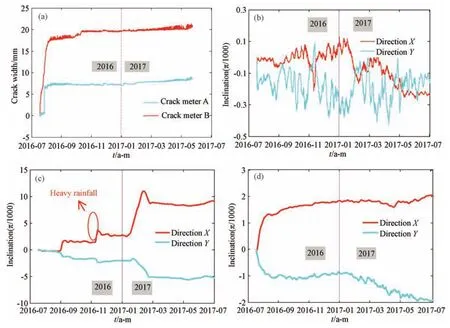
Figure 14 Time series of deformation detected by deformation sensors
Then,we calculate the composite unascertained measurement of the multiple indexes ofR1to be:{0.2,0.28,0.13,0.39}.The confidence level is taken as 0.6.According to Eq.(18)of the composite unascertained measurement vector of multiple indexes and Eq.(19)of the credible recognition rule,k0=0.61,which is larger thanλin ascending order,indicating that the superiority degree ofR1belonged to grade III.Only the inclination detected by tiltmeter 2 increases after November 12th,2016.The grade level calculated by the unascertained model remains in grade III.
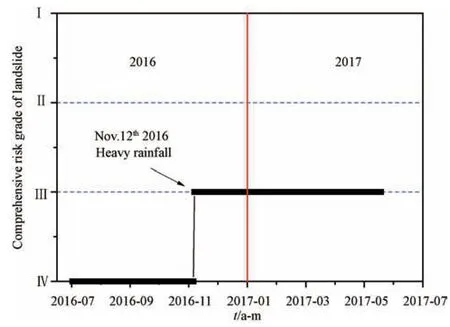
Figure 15 Grade levels of inclination and crack width during the field test
4 COMPREHENSIVE GRADE LEVEL BASED ON RAINFALL AND DEFORMATION
Numerous experiments and engineering practice indicate that landslides may be directly induced by rainfall(Montrasio L.et al.,2016).They may also be triggered by rainfall whose intensity is extremely low or negligible.In addition,landslides may occur abruptly during a rainfall or lag behind the rainfall event(Capparelli G.et al.,2011).If we use both the deformation and rainfall indexes as a set of index systems,the early warning result may be more conservative.Therefore,landslide warning can be divided into two early-warning components:the deformation warning component(as shown in Fig.15)and the rainfall warning component.When evaluating the landslide grade level,we consider these two components independently in the series.According to system reliability theory,the system reliability of a series is calculated as follows(Fenton G.A.et al.,2008):

The landslide failure probabilities with respect to risk grades I to IV are,P(E1)>P(E2)>P(E3)>P(E4),respectively.Suppose the failure probabilities of the risk grades evaluated by these two sets of evaluation index systems are,P(Ea)andP(Eb).According to Eq.(19),the system reliability is calculated as follows:

Because of the relationship between the two sets of evaluation index systems,the greater grade level evaluation based on these two sets of indexes is supposed to be the grade level of the slope.According to the above analysis,Table 6 shows the comprehensive risk grades obtained from the system involving these two sets of indexes.

Table 6 Comprehensive risk grades
Fig.16 shows the comprehensive landslide risk grade from July 2016 to July 2017,results indicating that the landslide risk grade induced by rainfall on November 12th,2016 is higher than that calculated by the deformation data.In a field investigation of the landslide site after heavy rain,we find tensile cracks in the lower part of the tower foundation.The distance between the crack and the tower is approximately 5 m,whereas the width and depth of the crack are about 10-20 cm and 30 cm,respectively,as shown in Fig.17.We also notice a crack with a maximum width of 5 cm and a length of 2 m at the east end of the retaining wall.Additionally,there is a crack with a maximum width of 4 cm and length of 5 m in the middle of the retaining wall,together with a crack with a maximum width of 20 cm and length of 5 m on the top of the retaining wall.From the expansion of the cracks along the wall,we can conclude that the traction landslide may have caused some extent of damage to the retaining wall,as shown in Fig.18.However,the deformation data indicate the landslide is in a stable creep stage,i.e.,that the slope remains stable at present.The warning results calculated by the rainfall and the field investigation actually show the slope stays in an unstable state and need to be strengthened.In 2017,the deformation monitoring data show that no further creeps occur on the slope.The slope is currently in a stable state following anti-seepage treatment and reinforcement of the slope after the heavy rainfall in November 2016.The early warning and field investigation results show this real-time early warning method is reasonable and accurate.
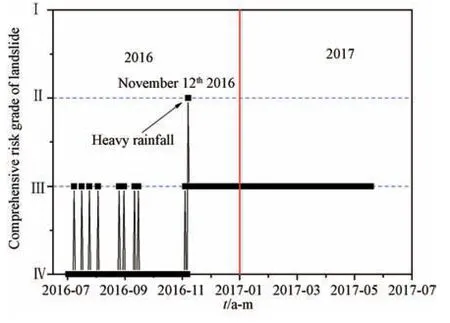
Figure 16 Time series of comprehensive landslide risk grade level
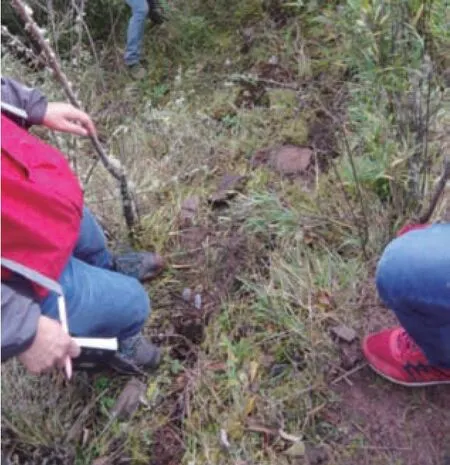
Figure 17 A crack in the slope
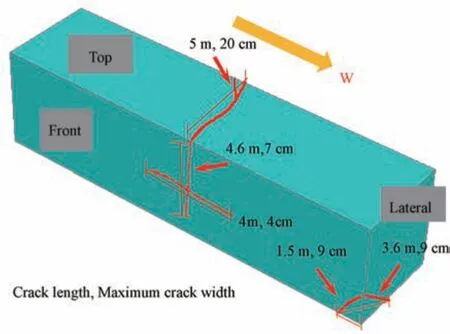
Figure 18 Cracks in the retaining wall
5 CONCLUSION
In this paper,we propose a new landslide early-warning method based on the comprehensive use of rainfall and deformation indexes.We calculate the comprehensive landslide risk grade levels based on the system reliability theory.The monitoring data and early warning results of the study landslide site from July 2016 to July 2017 indicate that the heavy rainfall may have destabilized the slope.Furthermore,the landslide risk grade level induced by the rainfall on November 12th,2016 is higher than that calculated based on the deformation data.The study results also indicate that the landslide induced by rainfall is characterized by lagging because the instability may take some time to occur after a rainfall.By dividing the early warning indexes into rainfall warning indexes and deformation warning indexes,this method can be used to effectively avoid the consequences of lagging on the early warning results.In general,our proposed multi-index and multi-level early-warning methods based on geodynamic calculations provide new technical support for real-time landslide hazard warning.
 Earthquake Research Advances2020年1期
- Earthquake Research Advances的其它文章
- Spatial Distribution of Seismic Landslides in the Areas of 1927 Gulang M8.0 Earthquake
- The Spatial Distribution and Attribute Parameter Statistics of Landslides Triggered by the May 12th,2008, MW7.9 Wenchuan Earthquake
- Distribution of Landslides in Baoshan City,Yunnan Province,China1
- Hazard Assessment of Co-seismic Landslides Based on Information Value Method:A Case in 2018 MW6.6 Hokkaido Earthquake,Japan
- Discrete Element Modeling of Tangjiagou Two-Branch Rock Avalanche Triggered by the 2013 Lushan MW 6.6 Earthquake,China
- A Discrete Element Analysis of the Sliding Friction Heat in High-Speed and Long-Runout Landslides
