Discrete Element Modeling of Tangjiagou Two-Branch Rock Avalanche Triggered by the 2013 Lushan MW 6.6 Earthquake,China
CAO Yanbo,XU Chong and NAN Yalin
1)School of Geological Engineering and Surveying,Chang'an University;Key Laboratory of Western China Mineral Resources and Geological Engineering,Xi'an 710054,China
2)Institute of Crustal Dynamics,China Earthquake Administration,Beijing 100085,China
3)China Electronic Research Institute of Engineering Investigations and Design,Xi'an 710055,China
Two branches of Tangjiagou rock avalanche were triggered by Lushan earthquake in Sichuan Province,China on April 20th,2013.The rock avalanche has transported about 1 500 000 m3 of sandstone from the source area.Based on discrete element modeling,this study simulates the deformation,failure and movement process of the rock avalanche.Under seismic loading,the mechanism and process of deformation,failure,and runout of the two branches are similar.In detail,the stress concentration occur firstly on the top of the mountain ridge,and accordingly,the tensile deformation appears.With the increase of seismic loading,the strain concentration zone extends in the forward and backward directions along the slipping surface,forming a locking segment.As a result,the slipping surface penetrates and the slide mass begin to slide down with high speed.Finally,the avalanche accumulates in the downstream and forms a small barrier lake.Modeling shows that a number of rocks on the surface exhibit patterns of horizontal throwing and vertical jumping under strong ground shaking.We suggest that the movement of the rock avalanche is a complicated process with multiple stages,including formation of the two branches,high-speed sliding,transformation into debris flows,further movement and collision,accumulation,and the final steady state.Topographic amplification effects are also revealed based on acceleration and velocity of special monitoring points.The horizontal and vertical runout distances of the surface materials are much greater than those of the internal materials.Besides,the sliding duration is also longer than that of the internal rock mass.
Key words:Tangjiagou two-branch rock avalanche;Lushan earthquake;Deformation and movement process;Discrete element modeling
INTRODUCTION
At 8∶02 on April 20th,2013 Beijing time,a strong earthquake(Lushan earthquake)occurred in Sichuan Province,China.TheMS6.6 earthquake has an epicenter at 30.284°N,102.95°E and a focal depth of 14 km.Until 14:30 on April 24th,2013,the earthquake has killed 196 people with 11 470 injured and 21 missing.The earthquake has triggered a large number of secondary geologic hazards in the vicinity,including Lushan County,Baoxing County,and Tianquan County(Xu Chong et al.,2013;2015a;2015b;Wang Genlong,2015;Hao Peifeng et al.,2018).Among these secondary hazards,landslides are mainly small-scale rock falls and landslides(Xu Chong et al.,2015a).It is considered that the tectonic and lithological structural planes are the main controlling factors of landslides in the area,which is similar to the adjacent areas in northeast direction affected by the strong 2008 Wenchuan earthquake(Gorum T.et al.,2011;Xu Chong et al.,2014b,2015b).The fragile geologic environment with high and steep terrains provides favorable conditions for the occurrence of landslides.Therefore,most of the geologic hazards are distributed in high mountain areas(Xu Chong et al.,2015b;Cui Peng et al.,2013;Zhang Dandan et al.,2014).
A large rock avalanche with two branches in Tangjiagou,Damiao Village,Laochang Township,Tianquan County has been triggered(Hu Xiewen et al.,2013),which is considered mainly due to the sharp ridges,steep terrain and intensely weathered lithology in the source area,as well as the existence of weak structural surfaces(Hu Xiewen et al.,2013;Yin Zhiqiang et al.,2014;Li Bin et al.,2017).However,the mechanisms of failure,sliding process,and accumulation of the rock avalanche remain equivocal and open to a variety of interpretations.Therefore,this study conducts discrete element numerical simulations regarding the deformation and failure of the Tangjiagou two-branch rock avalanche and analyzes its deformation,movement,and accumulation mechanisms.Results are beneficial for future predictions and deeper understandings of the mechanism and process of rock avalanches with similar topographic and geologic conditions.
1 TANGJIAGOU TWO-BRANCH ROCK AVALANCHE
1.1 Geologic Settings
The geology of Tianquan County is characterized by complex and developing active folds and faults.The avalanche is located at 25 km southwest of the epicenter,in the eastern mountainous area of Tianquan County and close to the Shuangshi-Dachuan fault(Xu Xiwei et al.,2013)(Fig.1).The exposed strata of the landslide area are dominated by dolomite limestone.The rock of the source area is strongly weathered and has poor integrity,and most of them have layered and fragmented structures(Xu Chong et al.,2013;Xia Shiwei et al.,2017;Zhou Qing et al.,2014).The area belongs to the middle mountainous landform,with high mountains and steep valleys.Generally,the elevation of the region is higher in the northwest and lower in the southeast.The highest elevation of the Tangjiagou valley is 2 810 m and the lowest is 935 m,with a difference of 1 875 m.
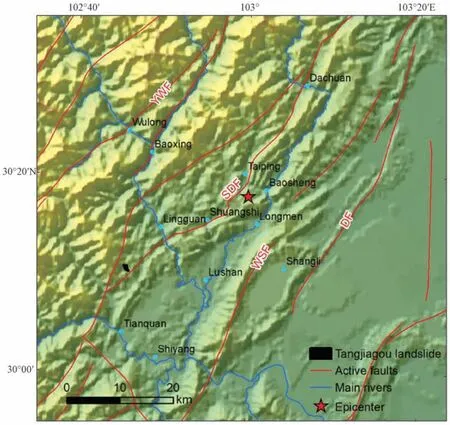
Figure 1 Location of the Tangjiagou rock avalanche and distribution of active faults.(Modified after Xu Xiwei et al.,2016 and Xu Chong et al.,2015a)
1.2 Characteristics of the Tangjiagou Rock Avalanche
The Tangjiagou rock avalanche(30°10′43″N,102°45′40″E)is the largest landslide triggered by the Lushan earthquake.The rock avalanche is originated on a ridge and composed of two branches.The branch-I has migrated to east-southeast for approximately 470 m runout and then changed the moving direction to south because of the topographic effect.Most of the materials have been moved to south with a runout about 660 m,then merged into the materials of branch-II,and finally ceased after a following 320 m runout.A small part of the landslide materials have been moved to northern upstream and stopped after a runout about 150 m.The branch-II has migrated to southeast-south and then has changed to the southeast along with the shape of the valley.The runout for branch-II is 1 030 m.Then,the materials have merged to the branch-I avalanche,the mixed materials finally stopped after a following 320 m runout.Therefore,the largest runout distance of the branch-I and branch-II are approcsmately 1 450 m and 1 350 m,respectively(Fig.2(a)).The volumes of the two branches are estimated to be about 1 000 000 m3and 500 000 m3,respectively.A fault that runs through the landslide scarp(Fig.2(b)),is considered as a branch of the Shuangshi-Dachuan fault,which is a major active fault related to the earthquake(Xu Xiwei et al.,2013;Xu Chong et al.,2014a).The lithology of the rock avalanche is light gray thick sandstone,lithic quartz sandstone,and mudstone of Triassic(T3x)(Fig.2(b)).Fig.2(c)shows the steep ridge after the failure with its two sides representing the two branches of the rock avalanche.Figs.2(d)and 2(e)show the branch-II and branch-I avalanche,respectively.The materials slide from maximum back scarp at 1 600 m to minimum elevation of 1 150 m(Xu Chong et al.,2015a).
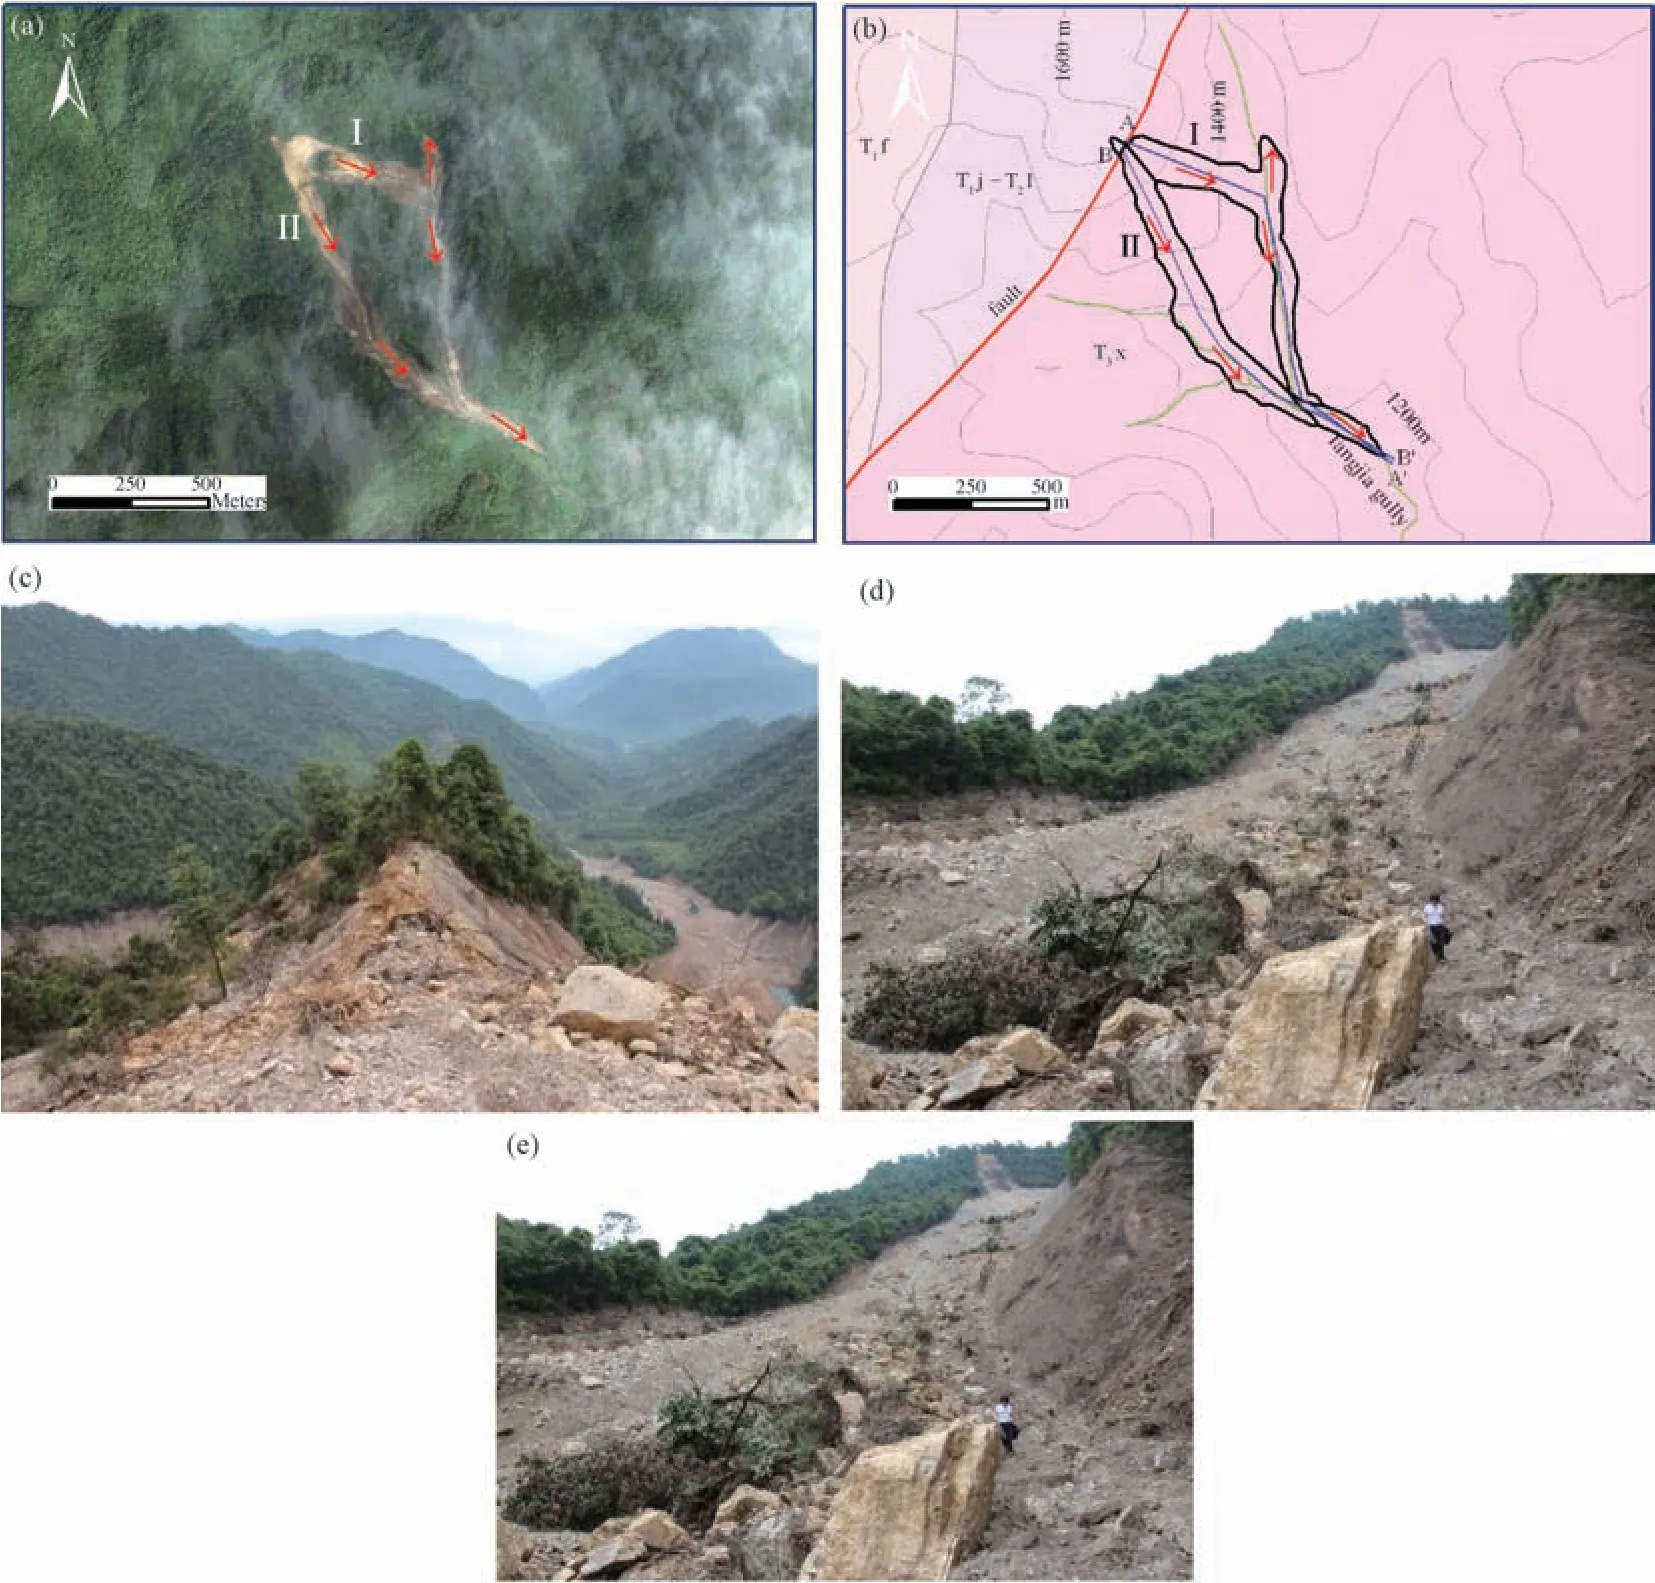
Figure 2 The Tangjiagou double rock avalanche(modified by Xu Chong et al.,2015a)
2 NUMERICAL MODEL AND BOUNDARY CONDITIONS
2.1 Models and Parameters
The surface rock mass of the Tangjiagou slope is dolomite limestone which has been strongly weathered,and the surface is covered with a layer of residual gravel soil with a thickness about 3-5 m.The sliding bed is medium-weathered dolomite limestone.For the convenience of calculation and analysis,the rock lithology of the slope is generalized,and the slope is divided into two layers,including the weathered surface layer and the bedrock layer.Furthermore,the surface layer is set to be the sliding body and the structural plane is the slipping surface in the model(Figs.3(a)and 3(b)).Vertical sections(Fig.2(b))of the two branches of the avalanche are selected to establish two numerical models(Fig.3).After precise measurements,we modify the results from Xu Chong et al.(2015a)and the new results indicate that the section length of the branch-I and branch-II are 1 450 m and 1 350 m,respectively.The extension of the periphery strongly enlarges the model size to eliminate the boundary effects on the simulation results.Therefore,the length of the models for the branch-I and branch-II are set to be 1 910 m and 1 800 m,respectively(Fig.3).A number of monitoring points are set in the sliding body and the sliding bed to monitor the stress,strain,and movement of the rock avalanche and the surroundings(Figs.3(a)and 3(b)).In detail,B-type monitoring points are set on the model boundary,M-type monitoring points are set on the sliding bed,and S-type monitoring points are set on the sliding body,respectively.Based on a previous studies(Hu Xiewen et al.,2013;Zhang Yuanjiao et al.,2012)and Handbook of Engineering Geology(Version 4,2007)(Editorial Board of Engineering Geological Manual,2007),the material parameters are obtained as shown in Tables 1 and 2.
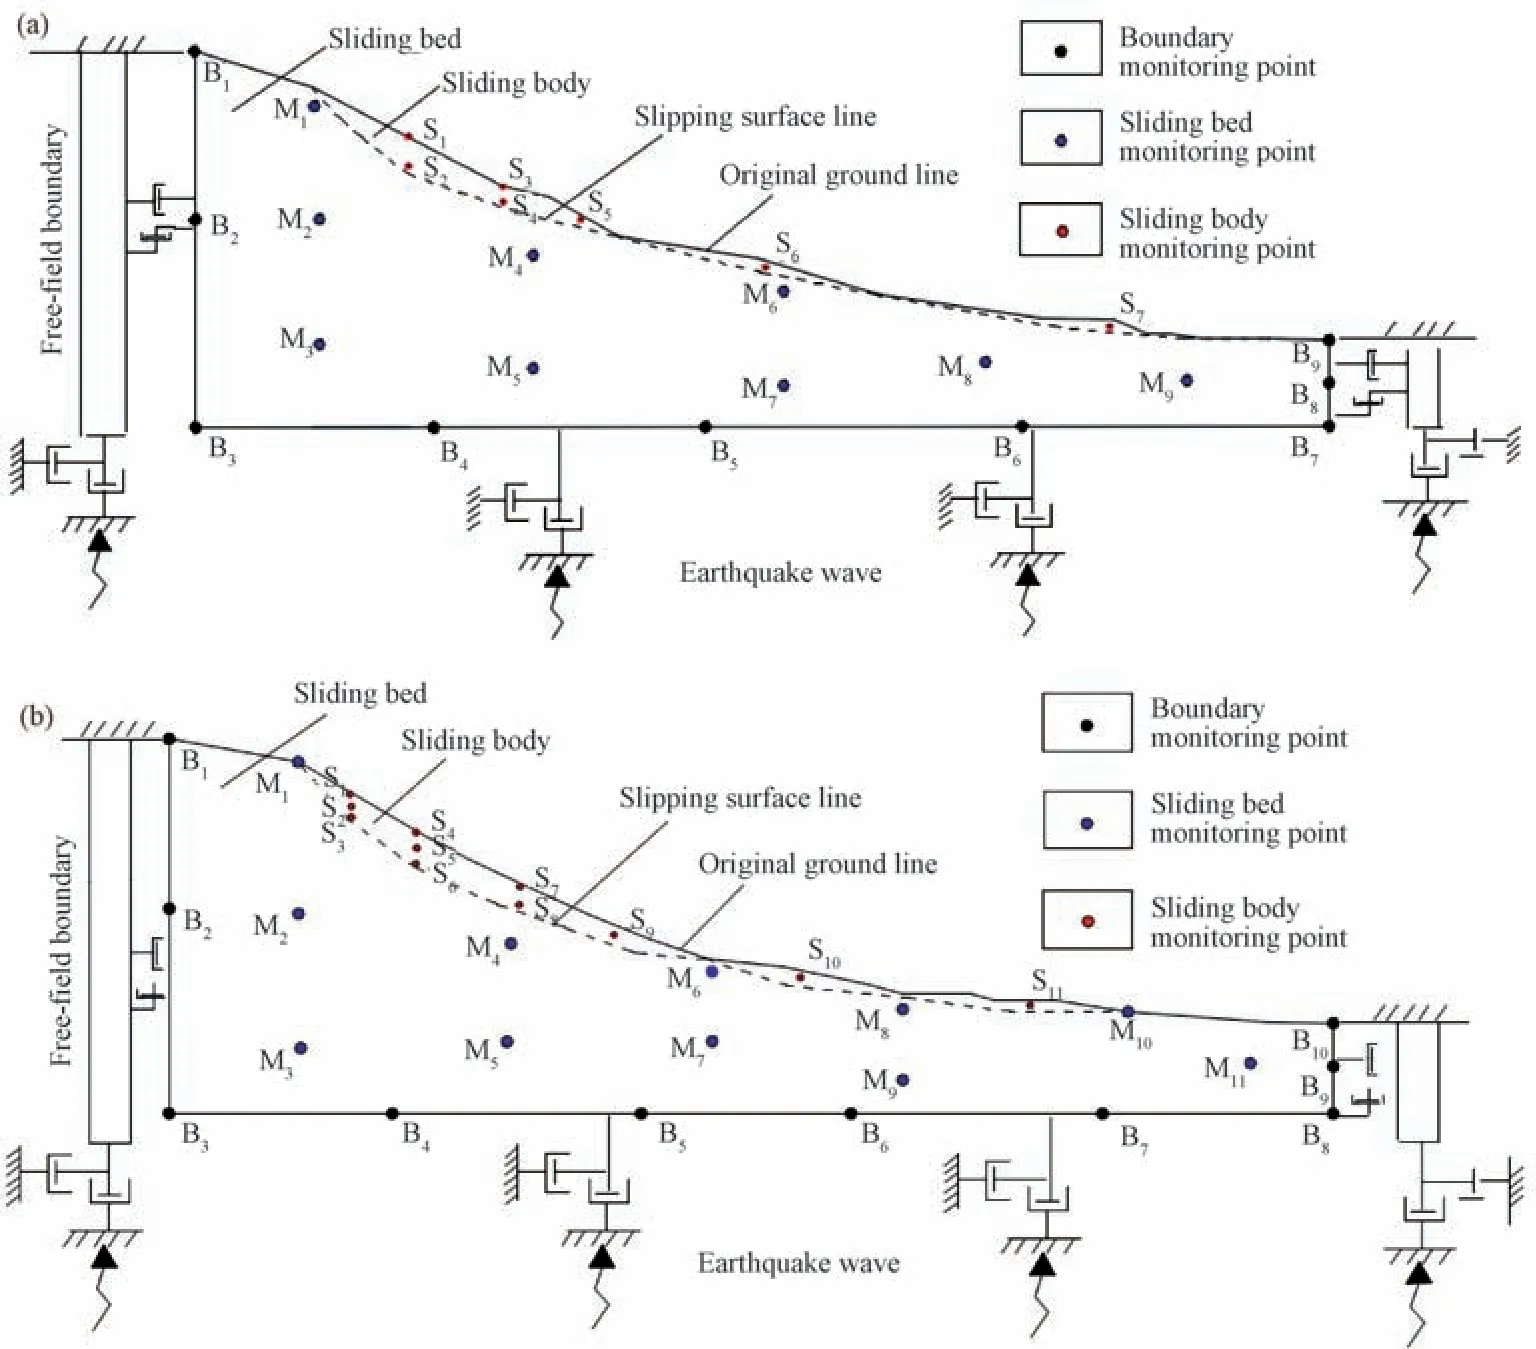
Figure 3 Distribution of monitoring points in the numerical model of Tangjiagou rock avalanche

Table 1 Material parameters of Tangjiagou two-branch rock avalanche

Table 2 Mechanical parameters of structural planes
2.2 Boundary Conditions
The deformation of the slope before failure is small,and both the sliding body and the sliding bed of the two-branch avalanche are set as plastic constitutive models.When the slope fractures,the deformation of the sliding body relative to its movement displacement is tiny and should be ignored.Therefore,in this stage,the sliding body is transformed to a rigid constitutive model whereas the sliding bed remains unchanged.For setting the model boundary conditions,we restrict the boundary on both sides in the horizontal direction and the bottom boundary in the vertical direction.The model reaches equilibrium under gravity with the finish of calculation.After that,the left and right boundaries are changed to free field boundaries,while the bottom boundary is changed into a viscous boundary(Figs.3(a)and 3(b)).In this case,the seismic dynamic load is added to the bottom boundary of the model.
2.3 Seismic Dynamic Input
In UDEC(Universal Distinct Element Code)software,seismic acceleration cannot be directly applied to the viscous boundary,but needs to be converted into stress instead and applied to the bottom boundary(Itasca Consulting Group,2004).The energy of this earthquake is mainly concentrated within 60 s(Zhang Yong et al.,2013).Therefore,the first 60 s is taken as the input of seismic dynamic conditions.The seismic acceleration duration curve is converted into the speed duration curve by numerical integration(Fig.4),and then the seismic vertical and horizontal velocities can be converted into stress by the following Eqs.(1)to(4).

WhereσNis applied normal stress(MPa),σSis the applied tangential stress(MPa),ρis the density of rock(kg/m3),CPis P-wave velocity of the medium(m/s),CSis S-wave velocity of the medium(m/s),vNis vertical vibration velocity of input particle(m/s),vSis horizontal vibration velocity of input particle(m/s),Kis bulk modulus,andGis shear modulus.
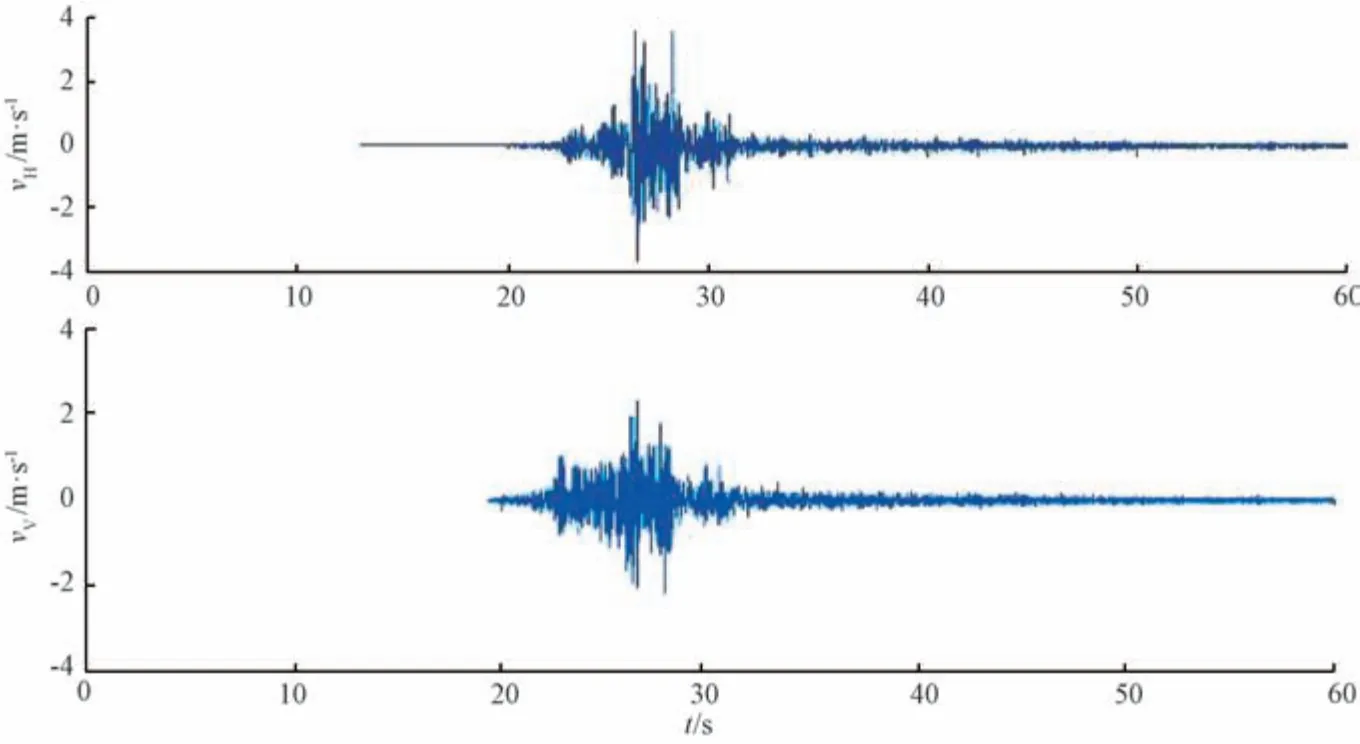
Figure 4 Horizontal velocity(vH)and vertical velocity(vV)duration curves inputted in models
3 RESULTS AND ANALYSES
3.1 Branch-I Avalanche
3.1.1 Testing of Maximum Imbalance Force and Boundary Conditions
The input time of dynamic load is 60 s and the calculation time is 90 s.The duration curve of the maximum unbalanced force of the model is shown in Fig.5.The unbalanced force becomes very small when the dynamic load continuously inputs for 50 s,while the equilibrium force approaches 0 after 55 s.Such results indicate that the calculation converges and the model system is stable(Fig.5).The horizontal and vertical velocity duration curves of the boundary monitoring points B2and B8are obtained through calculation(Fig.6).The two groups of waveforms from Figs.4 and 6 are basically matched,suggesting that the dynamic boundary conditions of the model are set correctly.
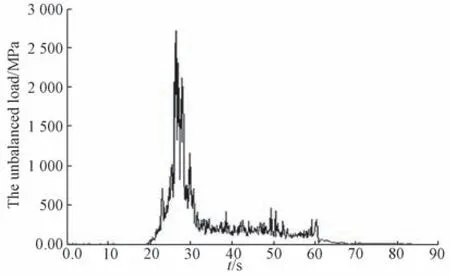
Figure 5 Variation of the maximum unbalance force with time under seismic loading

Figure 6 Durations of velocity on the model boundary
3.1.2 Slipping Surface Shear Strain Cumulative Effect
An avalanche is a complex dynamic process which includes deformation,failure,movement,and the transition from accumulation of deformation to qualitative change.The plastic body is basicly adopted in the first stage calculation.The slope starts moving at 27 s by inputting seismic dynamics,thus,only the first 27 s are selected to analyze the shear strain cumulative effect of the slipping surface.By analyzing the changing process of the slipping surface shear strain(Figs.7(a)-7(f)),we find that the slope failure is not an instantaneous process.After inputting the seismic force,a tensile crack is formed on the top of the mountain ridge(Fig.7(a)).With the increase of seismic load,the deformation continuously accumulates and expands along the slipping surface toward the shear outlet(Figs.7(b)and 7(c)).The discontinuity of the deformation then forms a locking segment(Figs.7(d)and 7(e)).When the seismic power input exceeds 27 s,the locking segments begin undergoing asymptotic failure.Finally,the slipping surface is penetrated and the slide mass starts moving and slides down with high speed.
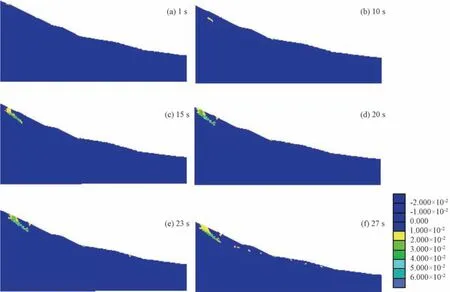
Figure 7 Variation of shear strain by seismic loading
3.1.3 Topographic Amplification Effect
Monitoring points M1,M2,and M3are set up vertically on the sliding bed to study the response of elevation to earthquake acceleration and velocity.The acceleration and velocity peaks of the monitoring points M1-M3in the model are shown in Table 3.Comparing the input acceleration and velocity peaks,the acceleration,velocity amplification factors of the monitoring points M1-M3can be obtained(Table 4 and Fig.8).It shows that there are topographic amplification effects in both acceleration and velocity.The horizontal acceleration and velocity amplification factor of the monitoring point M1increase sharply relative to the monitoring point M2,indicating that the amplification effect is more remarkable near the slope surface.

Table 3 Peak values of velocity and acceleration

Table 4 Amplification of velocity and acceleration
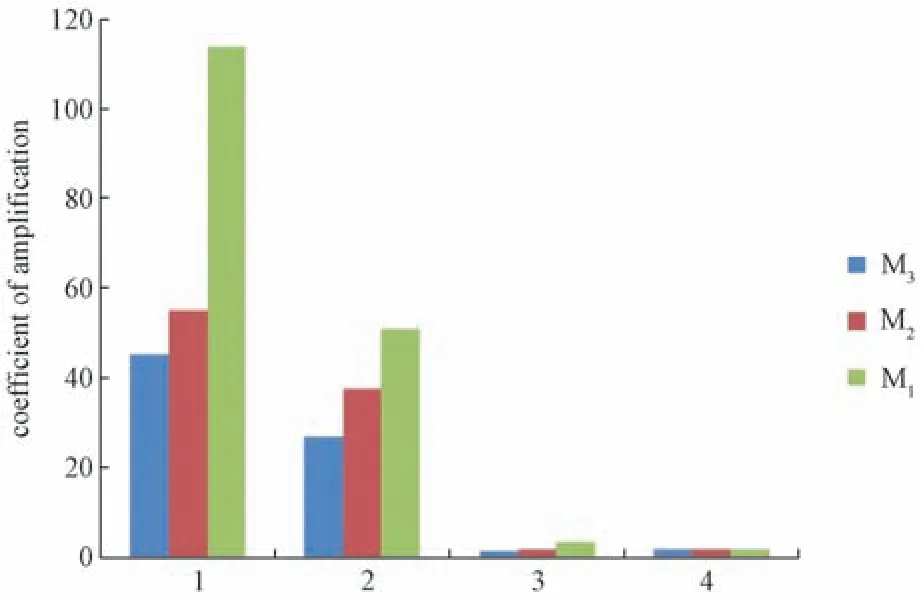
Figure 8 Amplification of velocity and acceleration of left rockslide
3.1.4 The Rock Avalanche Movement
In order to study the movement of Tangjiagou branch-I avalanche,the sliding body is changed into a rigid constitutive model for calculation(Fig.9(a)).The simulation results are shown in Fig.9.After 25 s input of the earthquake power,the top of the slope ridge is ripped and some rock blocks begin to collapse(Fig.9(b)).At 30 s,a small number of rock blocks are vibrated and destroyed,and the slipping surface is penetrated and begins to fracture(Fig.9(c)).During the process of seismic load inputting from 35 s to 50 s,the sliding body enters the high-speed sliding stage,in which a large number of rocks roll and slip on the slope surface,and even a small number of rocks are thrown up.It shows that the blocks have horizontal ejection under the earthquake horizontal force,which is consistent with the investigation on landslides triggered by the 2008 Wenchuan earthquake(Xu Qiang et al.,2008).The slid blocks continue to roll and scrape the groove materials and the volume of the landslide continue to increase(Figs.9(d)-9(g)).After 60 s seismic power inputting,the landslide materials slip to the downstream where a large amounts of the materials accumulate and deposit(Fig.9(h)).At 85 s,all the landslide materials stop moving and maintain a steady state(Fig.9(i)).
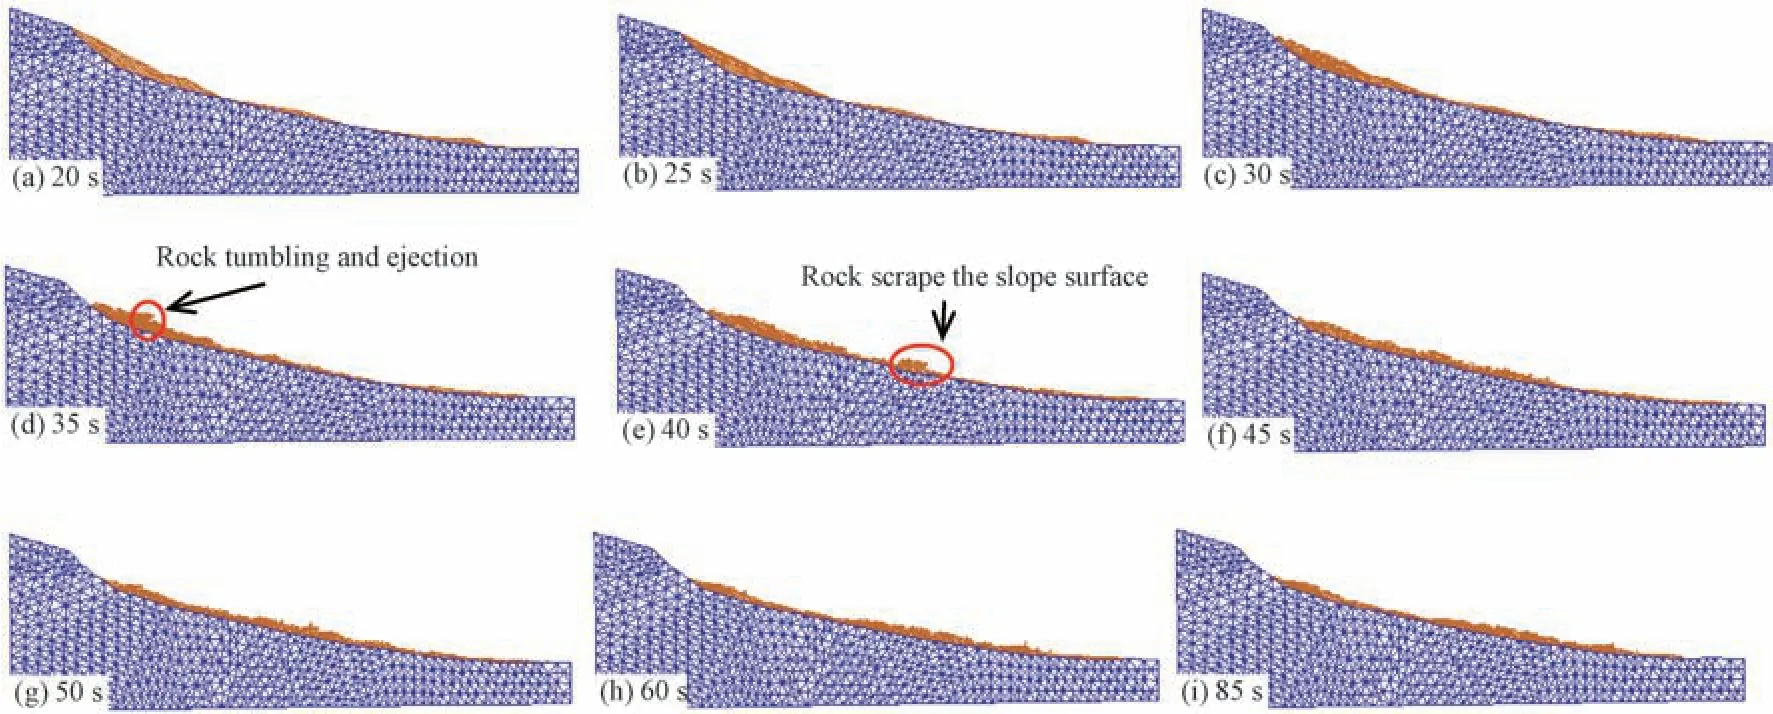
Figure 9 Modeled movement of the branch-I avalanche
Comparing the displacement duration curves in the horizontal and vertical directions of the monitoring points S1,S3,S5on the surface of the sliding body with those of the monitoring points S2,S4,S6and S7in the sliding body(Fig.10),the horizontal and vertical sliding distance of the surface monitoring points is much longer than those of the internal monitoring points.The sliding duration time of the surface monitoring points is also longer than those of the internal monitoring points.In addition,the displacement duration curve shows that the landslide starts to accelerate from 27 s,and basically stops at 60 s.
3.2 Branch-II Avalanche
Branch-II monitoring point setting is shown in Fig.3(b).The calculations verify that the dynamic boundary conditions of the model are set correctly.Branch-II model velocity and acceleration amplification effects show similar performance as branch-I.The mechanism of slipping surface shear strain cumulative effect is also the same as branch-I.Therefore,the following analysis is only focused on its movement mechanism.
In order to investigate the movement of branch-II avalanche,the sliding body is changed to a rigid constitutive model for calculation(Fig.11(a)),which is similar to the operation for branch-I.The simulation results are shown in Fig.11.Similar to the results from branch-I,when the accumulation of deformation reaches a qualitative change,the failure occurs(Fig.11(b)).When the seismic load inputting lasts for 30 s,a small number of rock blocks start vibrating and being destroyed,and the slipping surface is penetrated and begins to move(Fig.11(c)).During the earthquake power input period from 35 s to 50 s,the sliding body enters into a high-speed sliding stage.In this stage,a large number of rock blocks are rolling and sliding(Fig.11(d)),the sliding materials in the back are pushed forward in a wavy shake(Fig.11(e)).The sliding materials continue to roll and scrape the grooves and the slope materials on both sides,the volume of the landslide continue to increase(Fig.11(f)).We can clearly see that the horizontal and vertical phenomena of the rock blocks on the surface(Fig.11(g)).After 60 s,the landslide materials slip to the downstream and merge with the branch-I landslide materials(Fig.11(h)).Numerous landslides materials finally stop and accumulate in the river below.The similar state between 60 s and 85 s(Figs.11(h)&11(i))indicates a steady state as last.
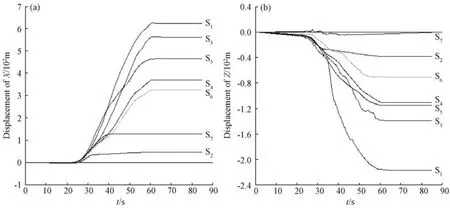
Figure 10 Modeled duration displacement of monitoring points in the sliding body
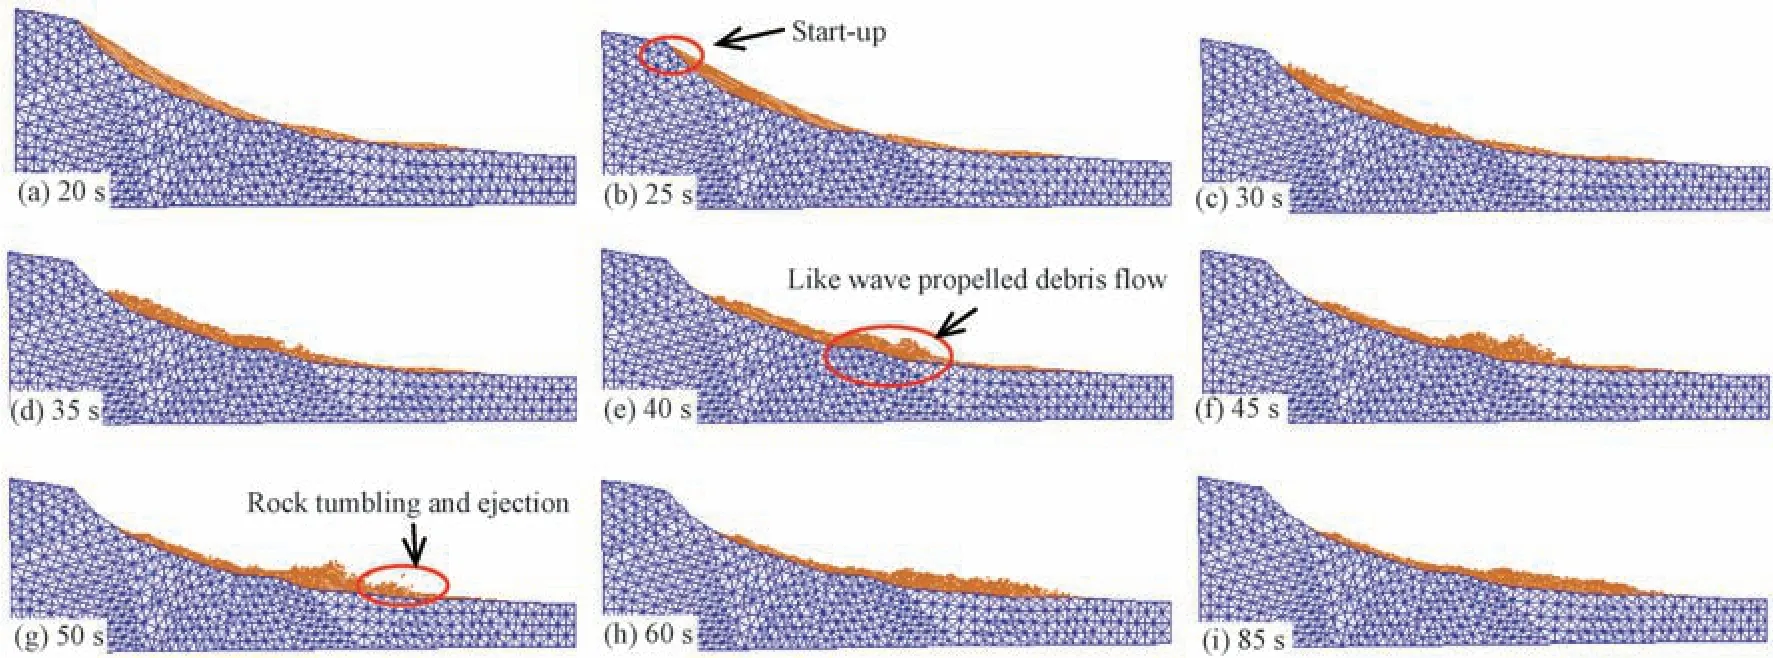
Figure 11 Runout modeling of the branch-II avalanche
The displacement duration curves inXandZdirections of the monitoring points S1,S4,and S7on the surface of the sliding body and the monitoring points S3,S6,and S8in the sliding body are shown in Fig.12.The vertical displacement duration curves of the surface monitoring points are wavy,while the displacement duration curves of the monitoring points in the slide body are relatively smooth,indicating that there is a vertically vibrated phenomenon on the surface due to the vertical seismic longitudinal wave during the sliding process.This phenomenon also verifies the simulation results of the moving process in Fig.11.
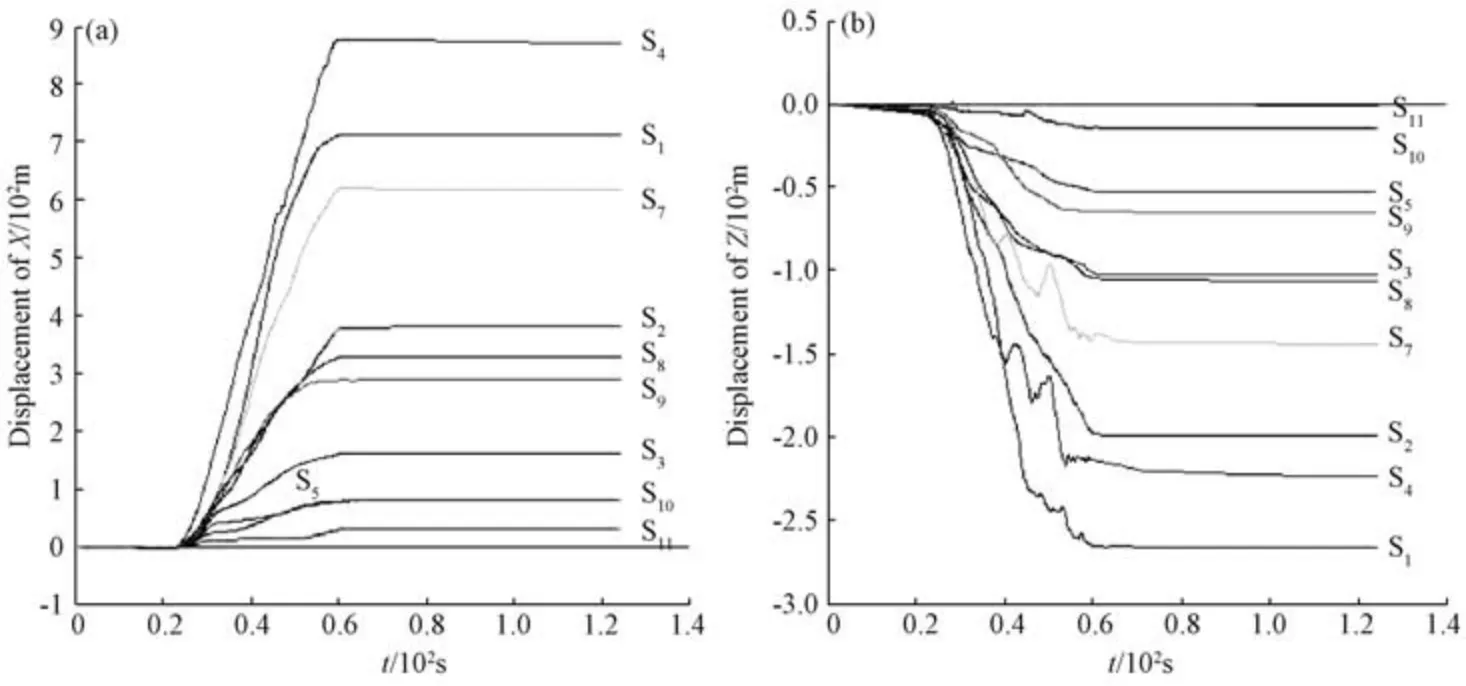
Figure 12 Modeled branch-II rockslide duration displacement of monitoring points in the sliding body
3.3 Comparisons of the Two Branches
The deformation and failure-movement modes of the two branches are similar.Both of them begin with stress concentration from the top of the ridge and tensile crack deformation.The strain concentration zone and deformation extend in the forward and backward directions,forming a locking segment.Eventually,the slipping surface is penetrated,and the sliding body enters into a high-speed sliding stage.After 60 s,both landslide materials of two branches slip to the downstream and merge together.
Compared with the movement state when the two branches of the avalanche run at different times,the deformation and damage scale as well as intensity of branch-II are larger than those of branch-I under the condition of the same calculation parameters.The possible reason is that the slope of branch-II is straighter and steeper than that of branch-I slope so that the energy accumulation of branch-II will be larger.Fig.10 and Fig.12 exhibit that the final displacement of the branch-II(982 m)is larger than that of the branch-I(739 m),which is consistent with the results of field investigations.
4 CONCLUSIONS
With the support of DEM simulation technology and the information provided from investigations,the whole process which includes deformation,runout,and accumulation of Tangjiagou rock avalanche is simulated.The analysis of slipping surface shear strain cumulative effect suggests that the deformation and failure-movement modes of the two branches are similar.In detail,both of them begin with stress concentration from the top of the ridge where the tensile crack deformation occurs.The strain concentration zone and deformation extends in the forward and backward directions,forming a locking segment.Finally,the slipping surface is penetrated,and the sliding body enters into a high-speed sliding stage.The simulation study of the movement process of the landslides shows that most of the blocks on the surface of the slope have a horizontal ejection and vertical dropping phenomenon due to the earthquake horizontal force and vertical force during the sliding process.When the landslide ran for 25 s-30 s,the sliding body begins to move with high-speed.The sliding materials continuously roll and scrape the grooves and the slope materials on both sides.At 60 s,the two branches merge together.Therefore,we suggest that the movement of the rock avalanche is a multi-stage process,including formation of the two branches,high-speed sliding,transformation into debris flows,further movement and collision,accumulation,and the final steady state.Topographic amplification effects are also revealed from both acceleration and velocity of the special monitored points.The horizontal and vertical sliding distances of the surface materials are larger than those of the internal materials.Besides,the sliding duration is also longer than that of the internal rock mass.The purpose of this paper is to intuitively simulate the entire process from deformation to movement and final accumulation with the assistance of UDEC software which can fully implement this simulation process.3DEC software is not able to observe this process from a certain section very intuitively.However,3DEC software can still be used to simulate the landslide failure process in 3D scene.Therefore,future work should focus on the comprehensive analysis of failure process obtained from 3DEC and results from UDEC,for the purpose of simulating the movement and accumulation process of the Tangjiagou rock avalanche in a more authentic way.
 Earthquake Research Advances2020年1期
- Earthquake Research Advances的其它文章
- Spatial Distribution of Seismic Landslides in the Areas of 1927 Gulang M8.0 Earthquake
- The Spatial Distribution and Attribute Parameter Statistics of Landslides Triggered by the May 12th,2008, MW7.9 Wenchuan Earthquake
- Distribution of Landslides in Baoshan City,Yunnan Province,China1
- Hazard Assessment of Co-seismic Landslides Based on Information Value Method:A Case in 2018 MW6.6 Hokkaido Earthquake,Japan
- A Discrete Element Analysis of the Sliding Friction Heat in High-Speed and Long-Runout Landslides
- A Statistical Estimation Model for the Impact Force of Dry Granular Flow Against Rigid Barrier1
