Hazard Assessment of Co-seismic Landslides Based on Information Value Method:A Case in 2018 MW6.6 Hokkaido Earthquake,Japan
WEN Boyu ,XU Chong ,HE Xiangli,MA Siyuan,SHAO Xiaoyi,LI Kai,ZHANG Zhongjian and LI Zhengfang
1)Key Laboratory of Active Tectonics and Volcano,Institute of Geology,China Earthquake Administration,Beijing 100029,China
2)School of Engineering and Technology,China University of Geosciences(Beijing),Beijing 100083,China
3)Institute of Crustal Dynamics,China Earthquake Administration,Beijing 100085,China
An MW6.6 earthquake occurred in eastern Hokkaido,Japan on September 6th,2018.Based on the pre-earthquake image from Google Earth and the post-earthquake image from high resolution(3 m)planet satellite,we manually interpret 9 293 coseismic landslides and select 7 influencing factors of seismic landslide,such as elevation,slope,slope direction,road distance,flow distance,peak ground acceleration(PGA)and lithology.Then,9 293 landslide points are randomly divided into training samples and validation samples with a proportion of 7∶3.In detail,the training sample has 6 505 landslide points and the validation sample has 2 788 landslide points.The hazard risk assessment of seismic landslide is conducted by using the information value method and the study area is further divided into five risk grades,including very low risk area,low risk area,moderate risk area high risk area and very high risk area.The results show that there are 7 576 landslides in high risk area and very high risk area,accounting for 81.52%of the total landslide number,and the landslide area is 22.93 km2,accounting for 74.35%of the total area.The hazard zoning is in high accordance with the actual situation.The evaluation results are tested by using the curve of cumulative percentage of hazardous area and cumulative percentage of landslides number.The results show that the success rate of the information value method is 78.50%and the prediction rate is 78.43%.The evaluation results are satisfactory,indicating that the hazard risk assessment results based on information value method may provide scientific reference for landslide hazard risk assessment as well as the disaster prevention and mitigation in the study area.
Key words:Hokkaido earthquake;Co-seismic landslides;Hazard risk assessment;Information value method
INTRODUCTION
At 03∶07 local time on September 6th,2018,anMW6.6 earthquake struck Hokkaido Eastern Iburi,Japan.Although this earthquake occurs in a sparsely populated area,it still kills 44 people and more than 80% of the deaths are caused by co-seismic landslides(Japan Meteorological Agency,2019;Wang Fengrui et al.,2019).It can be seen from recent earthquake events that co-seismic landslides often result in a large number of casualties and property losses.The damage caused by landslides cannot be neglected and sometimes is even more destructive than the original earthquake itself(Yin Kunlong et al.,2001;Xu Chong et al.,2010;Xu Chong,2018).Therefore,numerous studies has been made concerning the spatial distribution characteristics and rules,influencing factors and hazard mapping of co-seismic landslides under different magnitudes and geological conditions(Keefer D.K.,2002;Khazai B.et al.,2004;Chigira M.et al.,2006;Huang Runqiu,2007;Yin Yueping,2009;Huang Runqiu,2009;Xu Chong et al.,2012b,2013b,2014;Papathanassiou G.et al.,2013;Yin Zhiqiang et al.,2013;Xu Chong,2014;Budimir M.E.A.et al.,2015;Tsangaratos P.et al.,2017;Singh K.et al.,2018;Chen Xiaoli et al.,2018).These studies provide massive valuable information for understanding the complex relationship between co-seismic landslides and factors such as earthquakes,topography,geology and hydrological conditions,and provide important references for determining the mechanism of co-seismic landslides.However,few of these research cases are similar to this scenario,where a large number of landslides are concentrated in a small area.The Hokkaido earthquake in Japan has triggered more than 9 000 landslides within a range of about 600 km2.This is a landslide group with the largest number and total area since Meiji era in Japan(Osanai N.et al.,2019).Previous studies focus on exploring several possible causes of the large number of landslides triggered by earthquakes,besides,there is no detailed study on the division of the risk areas of earthquake landslides.Finally,compared with several previous studies(Yamagishi H.et al.,2018;Osanai N.et al.,2019;Wang Fengrui et al.,2019;Zhang Shuai et al.,2019),we use and analyze an unprecedented quantity of landslides in this paper.
In order to make a more objective landslide hazard risk assessment in the Hokkaido Earthquake Research Area and provide a more effective basis for disaster prevention and control in the earthquake area.In this paper,a total of 9 293 landslides are manually interpreted by comparing the pre-earthquake remote sensing image from Google Earth with the post-earthquake planet satellite image with high resolution(3 m).The hazard risk assessment of the earthquake landslides in the east of Hokkaido Iburi is conducted by using the information value method with the spatial data analysis and processing function of GIS.Seven factors including elevation,slope,aspect,distance from the river,distance from the road,lithology of the ground,and peak ground acceleration(PGA)are selected as the influencing factors of the landslide hazard.The high-risk area prone to landslides in the study area is explored,for the purpose of providing effective data support for landslide hazard risk assessment in the study area,and providing reference for future earthquake secondary disaster prevention and mitigation work.
1 OVERVIEW OF THE STUDY AREA
Japan is located at the junction of the Eurasian,Pacific,North American and Philippine Plates.Due to the collision and compression between these Plates,seismic and volcanic activities are very active.The earthquake occurs in the east of Iburi Hokkaido,the junction of Eurasian and Pacific Plate with actively abundant tectonic activities.Here the Pacific Plate subducts beneath the Eurasian Plate northwestward at Kuril Kamchatka Trench with a convergence rate of approximately 87 mm/year relative to the North American Plate.In addition,the Pacific Plate sinks from the Japan Trench almost in front of the land side,and sinks from the Kuril Trench from a rather oblique direction.(United States Geological Survey,2018)
On September 6th,2018,the focal coordinates of theMW6.6 earthquake in the eastern part of Hokkaido's biliary occurred at 42.686°N,141.929°E with a depth of 35 km and the maximum magnitude of 7.0(Japanese standard).The maximum peak ground acceleration(PGA)recorded is 1797.39 gal(three-component synthesis).On September 30th,277 aftershocks occurred(Japan Meteorological Agency,2019),leading to massive power outages and construction damage in some areas of Hokkaido.It also injures more than 600 people and kills 44 people.The inversion fault occurs in a collision zone and its structure is formed by the convergence of the Pacific plate,Eurasian plate,and North American plate.Besides,the seismic focal mechanism solution indicates that the source fault model is a high-angle inversion fault in the N-S direction.The fault pressure axis is NEE-SWW,and faulting process occurs on either a moderately dipping reverse fault striking northwest,or on a shallow-to-moderately dipping fault striking southeast(United States Geological Survey,2018).The main active fault near the study area is the eastern marginal fault zone of Ishikari Lowland,with a near S-N direction.It is located near the boundaries between the Ishikari Plain in the west of Hokkaido and the Kurizawa Hills and Mawari Hills in the east.It is the reverse fault zone on the east side relative to the uplift on the west side.The eastern boundary fault zone of the Ishikari lowland is divided into the main part and the southern part according to its distribution regularity.The main part lies throughout Iwamizawa,Yubari-gun,and Chitose from Bibai,Hokkaido.The southern part covers the area from Chitose to Hidaka-cho,Saru-gun,with an estimated length of 54 km or more(The Headquarters for Earthquake Research Promotion,2019)(Fig.1).
2 DATA AND METHODS
2.1 Data Sources and Interpretation Methods
This study uses high-resolution(3 m)Planet satellite images obtained within five days after the earthquake covering the entire area affected by the earthquake.At the same time,pre-seismic satellite remote sensing images from the Google Earth platform are used to ensure that co-seismic landslides can be well distinguished.We also make manual interpretation using Google Earth to ensure accuracy.The morphology,texture,and color of the landslide itself are significantly different from the non-slide bodies in the image.Furthermore,the new landslides have clearly detectable variations of spatial and spectral characteristics(Shi Jusong et al.,2008;Tong Liqiang et al.,2013).Therefore,the landslide interpretation is mainly conducted by comparing the shape and color of the landslides before and after the earthquake(Fig.2).
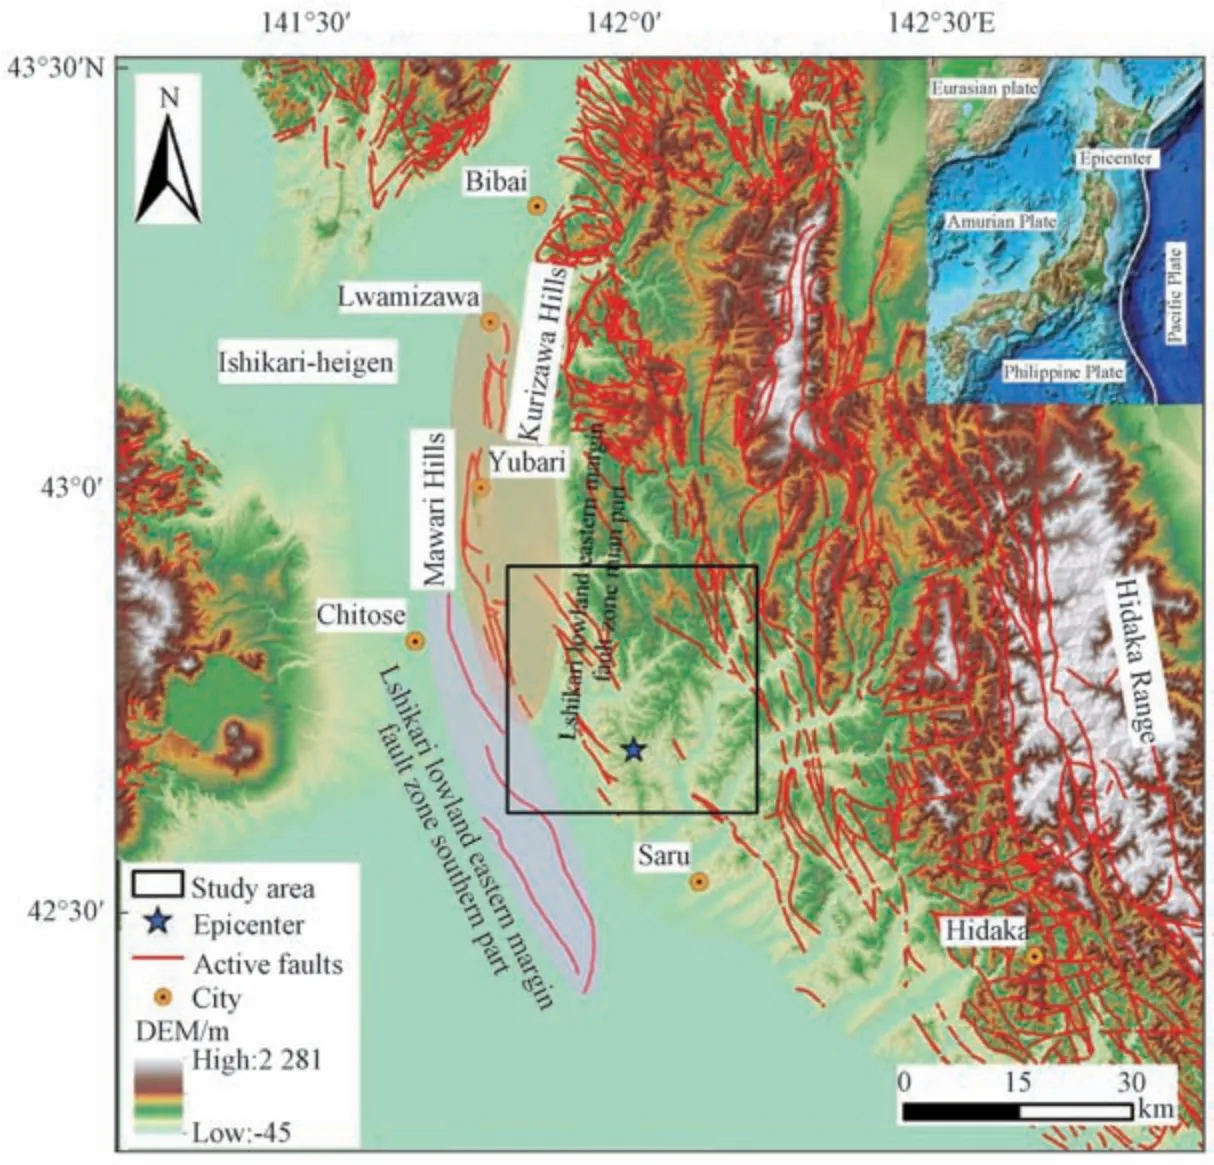
Figure 1 Map showing topography and tectonic setting of Hokkaido earthquake in Japan
The basic elements of a landslide are the landslide back wall,landslide body,sliding surface,sliding belt,and landslide bed.Since the remote sensing image cannot directly see the underground structure of the landslide,the interpretation of the landslide is mainly on the basis of the two basic elements:landslide body and landslide back wall(Yao Xin et al.,2006).Most of the landslides have obvious topographical and geomorphic features.For instance,on the smooth hillside,there are several abrupt chair-shaped scarps or steep walls which have downward slope shapes with concave top and convex bottom surfaces.In addition to the stepped flat land,the lower part is undulating tongue-like sloping land which protrudes from the gully or river.In the remote sensing images,the planar shape of the landslides are various,including oval,dustpan,long tongue,inverted pear,and triangle patterns,for larger landslides,obvious landslide back walls,landslide steps,closed depressions,landslide tongue etc.can be seen(Wu Zhongfang et al.,2008;Xu Chong et al.,2009;Wang Yunnan et al.,2017).Additionally,the images exhibit a broad zone of vegetation coverage in the earthquake-affected area,in which the vegetation area without landslides is filled with dark green,water body is colored with light green,and landslide area is shown as light yellow or dark brown.Compared with the non-slip area,the color tone is significantly different(Fig.2(b)).
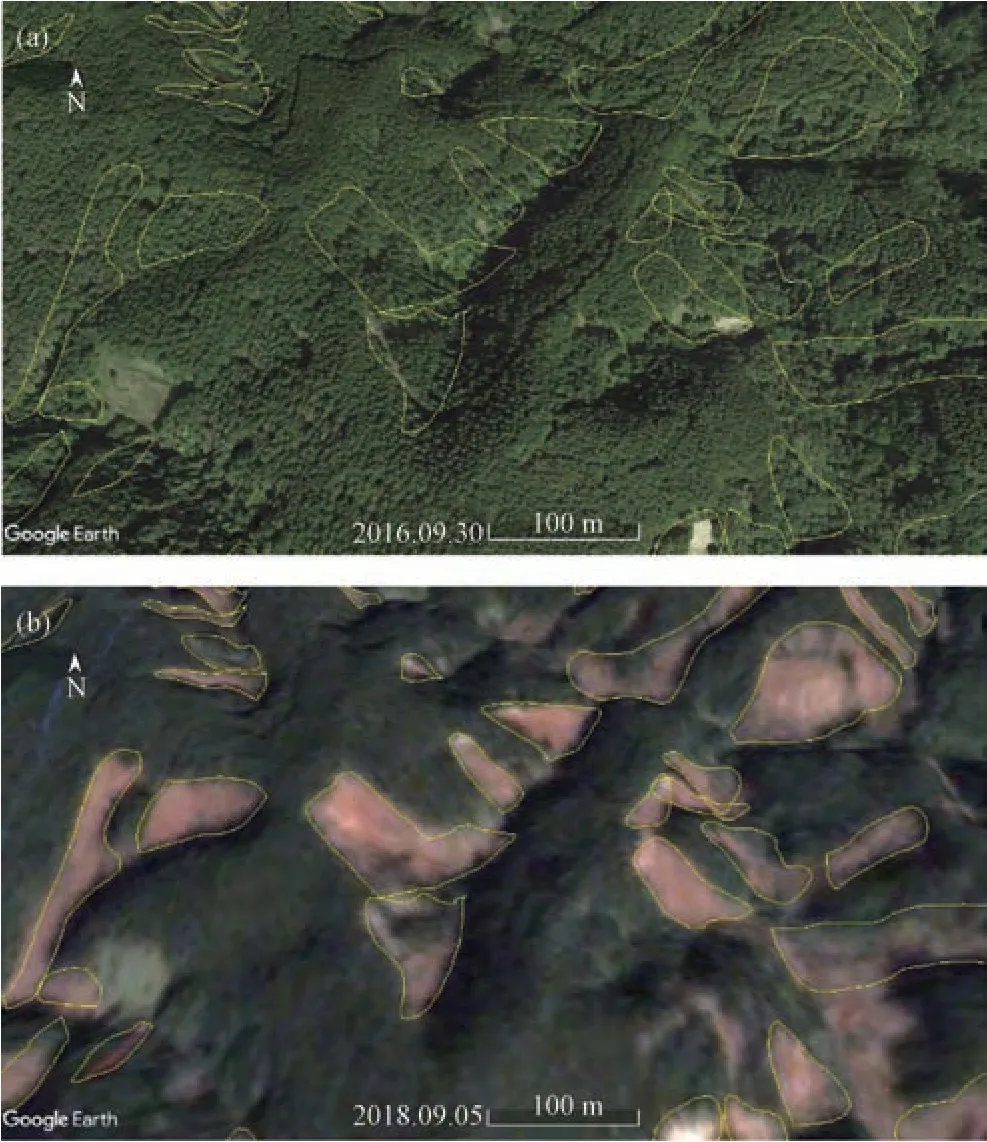
Figure 2 Remote sensing satellite images before and after the Hokkaido earthquake in Japan
Based on the above principles,we interpret 9 293 landslides in total(Fig.3).These landslides are mainly distributed in the region south of Chitose,Hokkaido.The study area is framed according to the area where landslides occur.The total area is about 599.60 km2and the area hit by landslides is about 30.84 km2accounting for 5.13% of the study area.Besides,the density of landslide point is 15.45/km2.
The occurrence of seismic landslides is affected by numerous reasons such as topographical factors,geological factors,seismic factors and human factors.After comprehensive consideration of these factors,the final influencing factors are selected.The topographical factors include elevation,slope,and aspect.There are differences in vegetation coverage,rock and soil moisture content,and human activities at different elevations;Besides,different slopes may generate different free face;different aspect may have different radiation degree,which may further affect the water content,weathering,and vegetation coverage.All the aforementioned factors may have a significant impact on the occurrence of landslides.Geological factors include the distance to rivers and lithology.The infiltration of the river into the slope may reduce the friction between the soil particles and result in easier occurrences of landslides;lithology is the fundamental material for landslides,and the types and sizes of landslides with different lithology are quite different.The main seismic factor is PGA,which reflects the intensity of the ground vibration during an earthquake.The stronger the PGA,the easier the earthquake landslide will occur(Xu Chong et al.,2013a).The human factor includes the distance to roads.Besides,slope cutting,foundation excavation,and slope top loading construction may damage the stability of the slope structure when the road is constructed,making the slope more prone to landslides under earthquake conditions.Using the surface of Arcgis spatial analysis tools,the slope and aspect data are extracted from the digital elevation model(DEM)data in the study area.Using the buffer analysis tool,the distance to rivers and roads are obtained.The size of the selected raster data unit is 20 m×20 m(Fig.4).
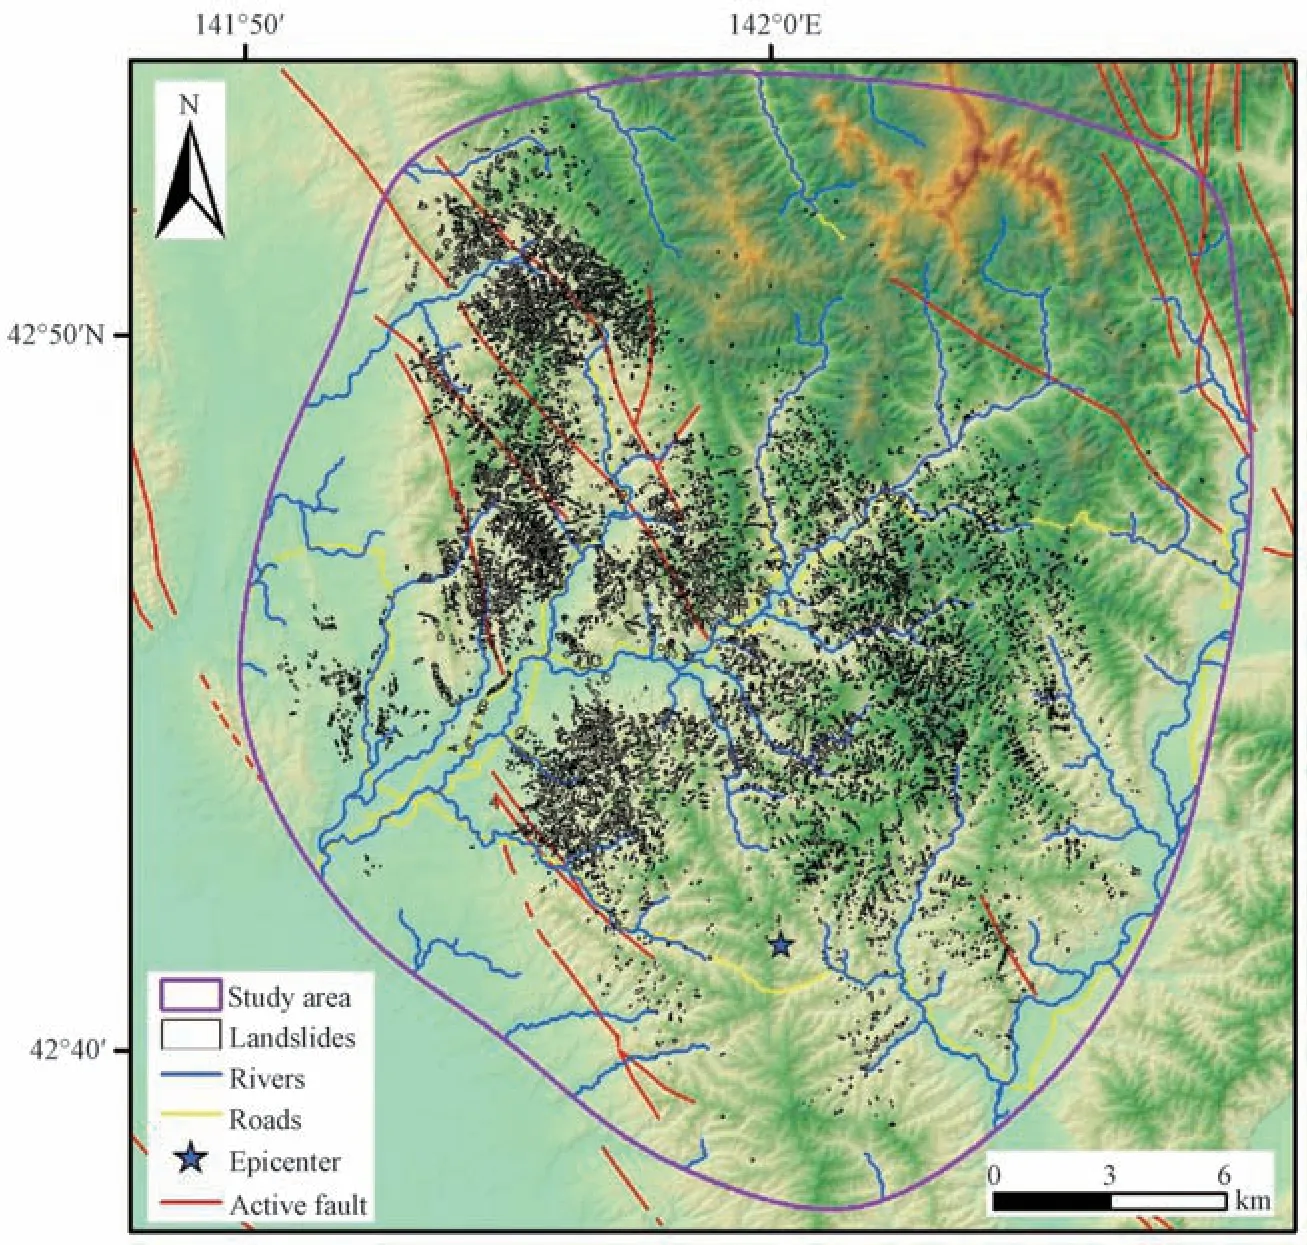
Figure 3 The spatial distribution map and study area of Hokkaido earthquake-triggered landslides in Japan
The DEM used in the study area comes from SRTM 30 m with a resolution of 20 m×20 m and a DEM range of 8-625 m.According to the interval of 100 m,the DEM is divided into five sections:<100 m,100-200 m,200-300 m,300-400 m,>400 m.The slope range is 0-54.138°,and the gradient is divided into 5 sections according to the interval of 10°:<10°,10°-20°,20°-30°,30°-40°,>40°.After reclassification,the slope direction is further divided into nine directions,namely flat(0°),N(337.5°-0°,0°-22.5°),NE(22.5°-67.5°),E(67.5°-112.5°),SE(112.5°-157.5°),S(157.5°-202.5°),SW(202.5°-247.5°),W(247.5°-292.5°),NW(292.5°-337.5°).
The River data are obtained from the DEM data using hydrology of the spatial analysis tools in ArcGIS.The distance from the river is divided into 6 sections with an interval of 300 m:<300 m,300-600 m,600-900 m,900-1200 m,1200-1500 m,>1500 m.Besides,some road data are downloaded from the internet,while other road data are manually drawn on Google Earth with a following conversion from KML to SHP format.All of these data are then processed and analyzed using ArcGIS.The distance from the road is divided into 6 sections with an interval of 1 km:<1 km,1-2 km,2-3 km,3-4 km,4-5 km,>5 km.
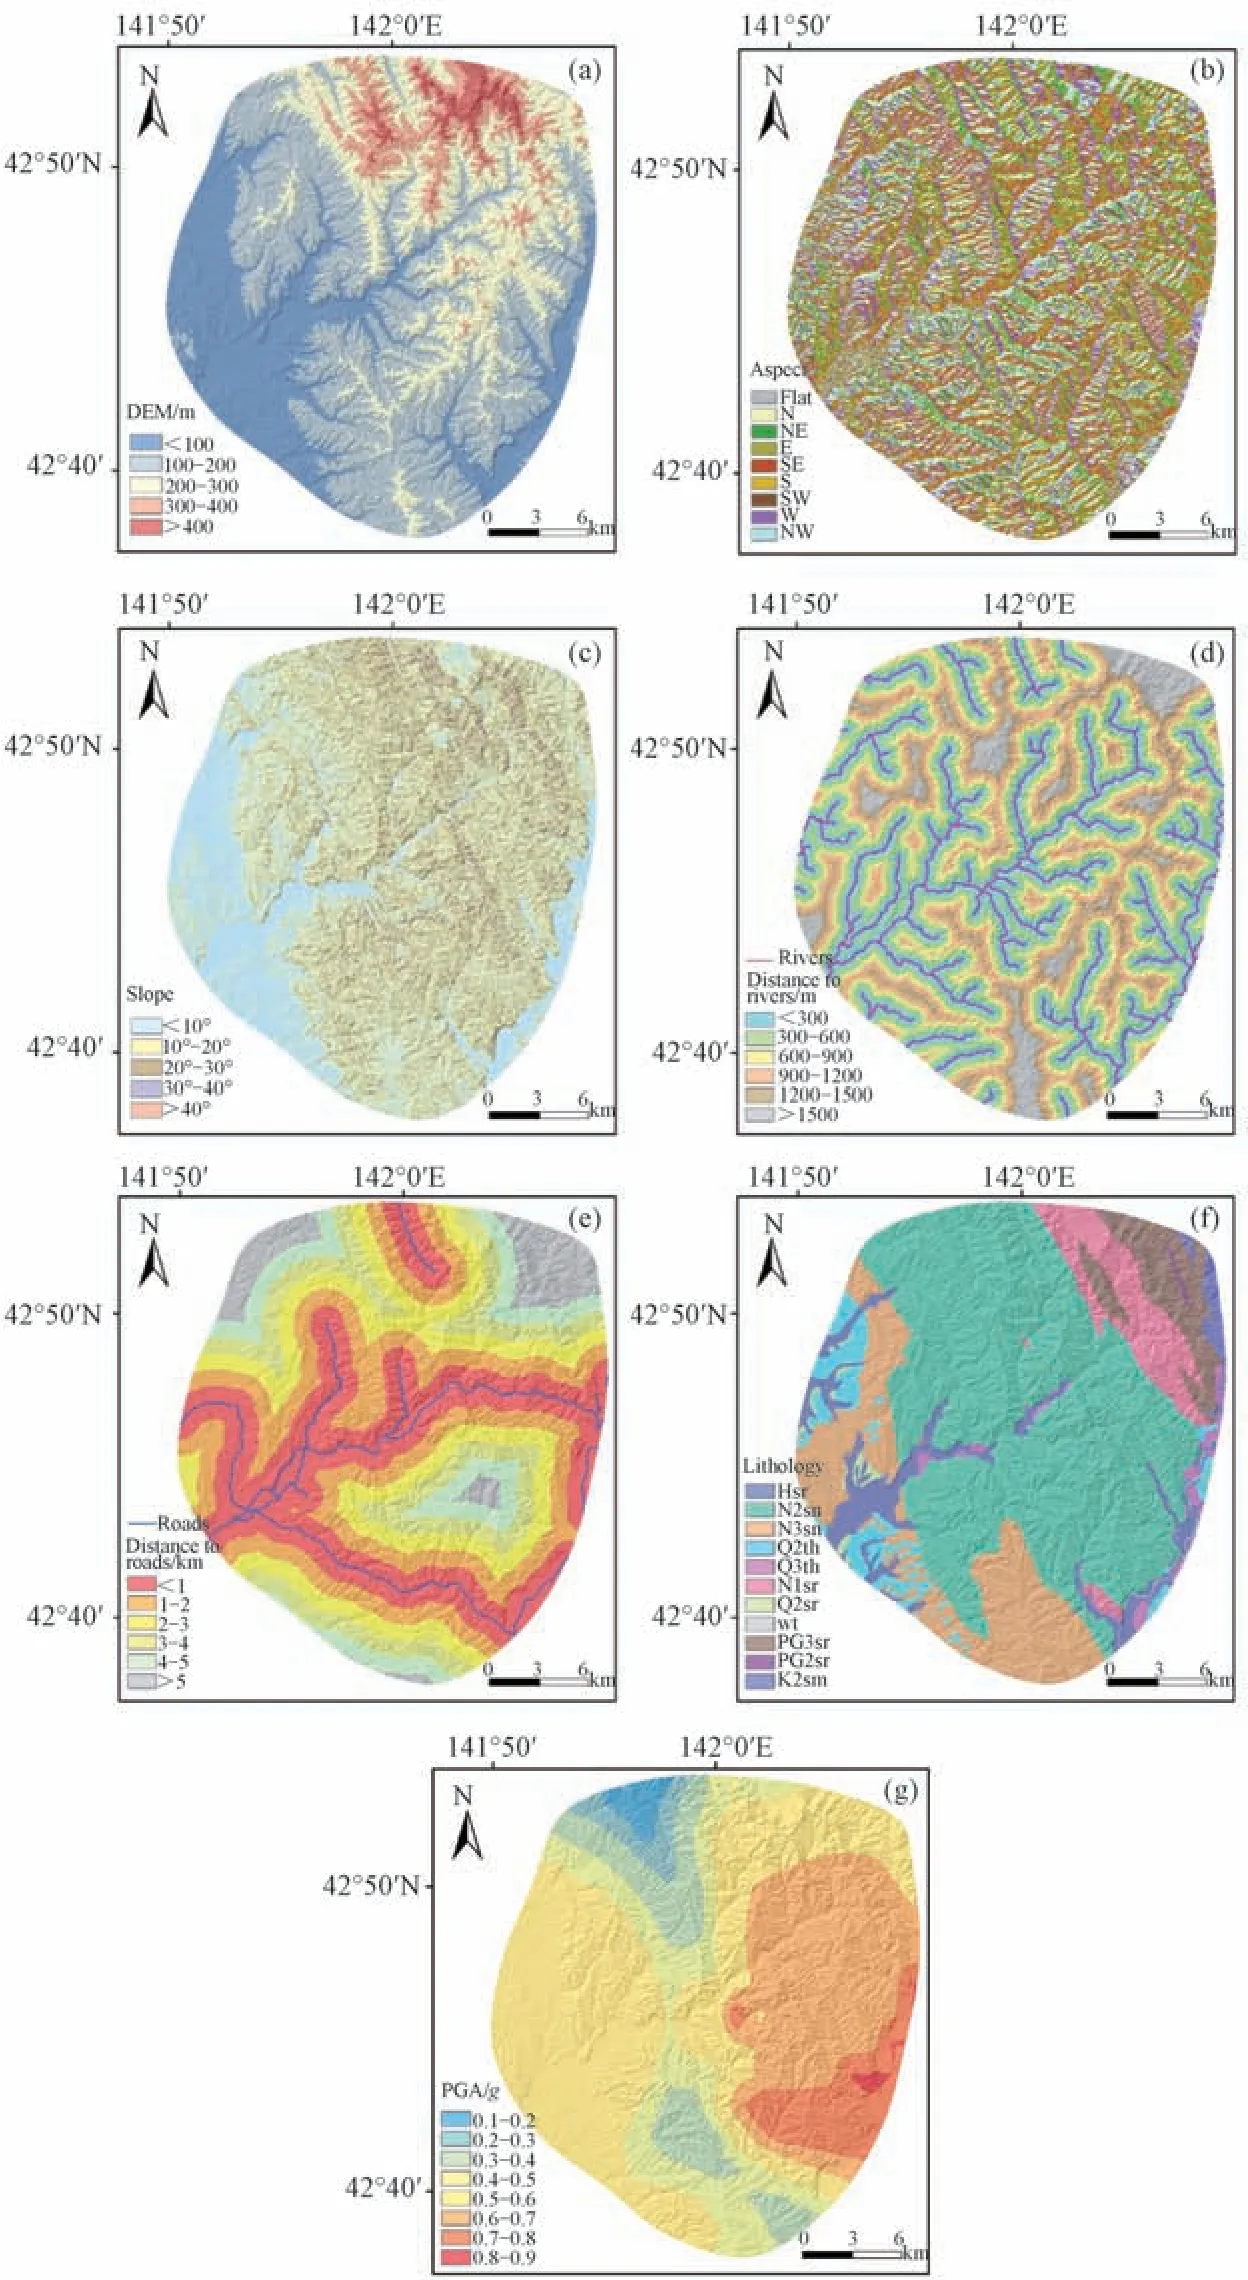
Figure 4 Impact factors and their classifications
The formation of lithology has an internal influence on the occurrence of landslides,which is an important factor affecting the earthquake landslides.The stratigraphic lithology data of the study area are obtained from the 1∶200 000 seamless digital geological map of Japan issued by the Geological Survey of Japan(Geological Survey of Japan,2017).There are 10 types of lithology in the study area,which are listed in Table 1.The peak ground acceleration(PGA)is derived from the PGA contour data published by the U.S.Geological Survey.The PGA is divided into 8 sections:0.1-0.2g,0.2-0.3g,0.3-0.4g,0.4-0.5g,0.5-0.6g,0.6-0.7g,0.7-0.8g,0.8-0.9g.The peak acceleration of the maximum ground motion reported by Japan Meteorological Agency is 1 797.39 Gal,about 1.8g,which is different from the data provided by USGS,because the data provided by USGS are the theoretical values obtained by simulating the seismic environment.The value reported by the Meteorological Agency are measured values.The theoretical value obtained from the simulation may have some deviations,and the measured value reported by Japan Meteorological Agency is a three-component PGA,which is larger than the one-component PGA.Because the measured value is only a high degree of accuracy of the PGA value measured at the control point,which extends to the entire area,the theoretical value controls the PGA intensity better than the measured value.Therefore,in this study,we choose the PGA data provided by USGS.
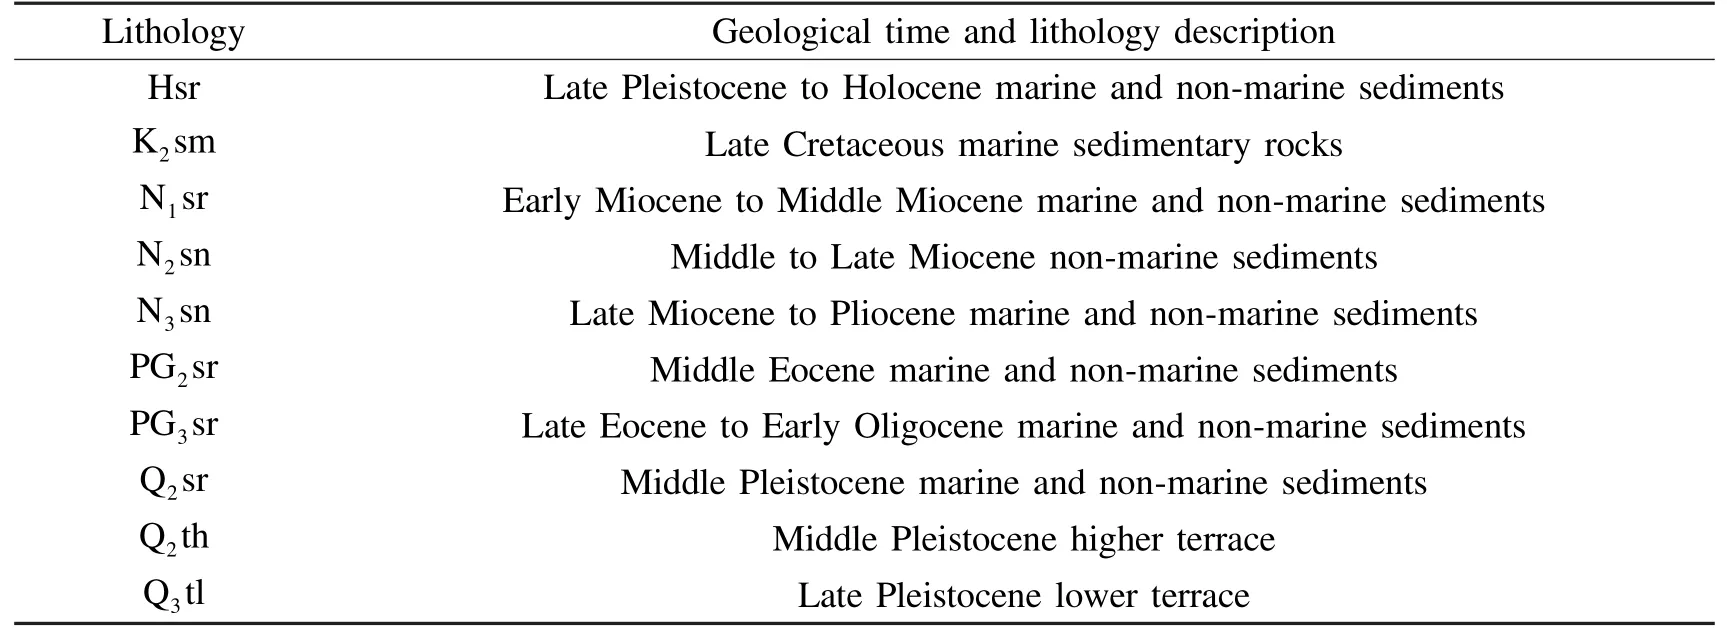
Table 1 The lithology in the study area
After obtaining the landslide point data,9 293 landslide points are randomly divided into training samples and verification samples with a proportion of 7∶3.In detail,6 505 landslide points are used as training samples,and 2 788 landslide points are used as verification samples.Based on the selected impact factors,the training samples and information method are used to assess the landslide hazard risk in the study area,and the verification samples are used to test the evaluation results.
2.2 Evaluation Method
The information value method applied to the evaluation of geological hazards is based on the actual situation and information of the geological area that has been deformed or destroyed,and the measured values of various factors that evaluate the stability of the geological area are converted into informational values reflecting the stability of the geological area.The information of each influencing factor is used to measure the magnitude of the effect of an influencing factor on the deformation and destruction of the geological region(Guang Lei,2005;Gao Kechang et al.,2006).It is more practical for landslide hazard risk assessment in small and medium-sized areas due to its easier operability whereby the evaluation results and maps are quickly obtained(Chen Xiaoli et al.,2008).
The specific operation is to perform the spatial analysis of each factor layer,and then calculate the amount of information of each impact factor classification according to the following equation:

In Eq.(1),Iiis the total information amount of the evaluation unit;Sis the total area of the study area unit,Nis the number of landslide units in the study area;Niis the number of landslide units in the classificationxi,andSiis the total area of the unit in the classificationxi.The contribution of the impact factors to the occurrence of landslides increase with the increase of the information value.
In this way,the information amount value under the classification of each factor layer can be obtained.According to the relationship between each category and the corresponding information amount,the corresponding information amount value is assigned to each category,and the information amount value of the single factor layer can be obtained.By superimposing each impact factor layer,a new grid layer is obtained,which is a comprehensive information map of the entire research area,which is also a landslide hazard index map.
2.3 Research Process
In order to complete the map of the landslide hazard risk assessment of Hokkaido,Japan,we establish a workflow shown in Fig.5.
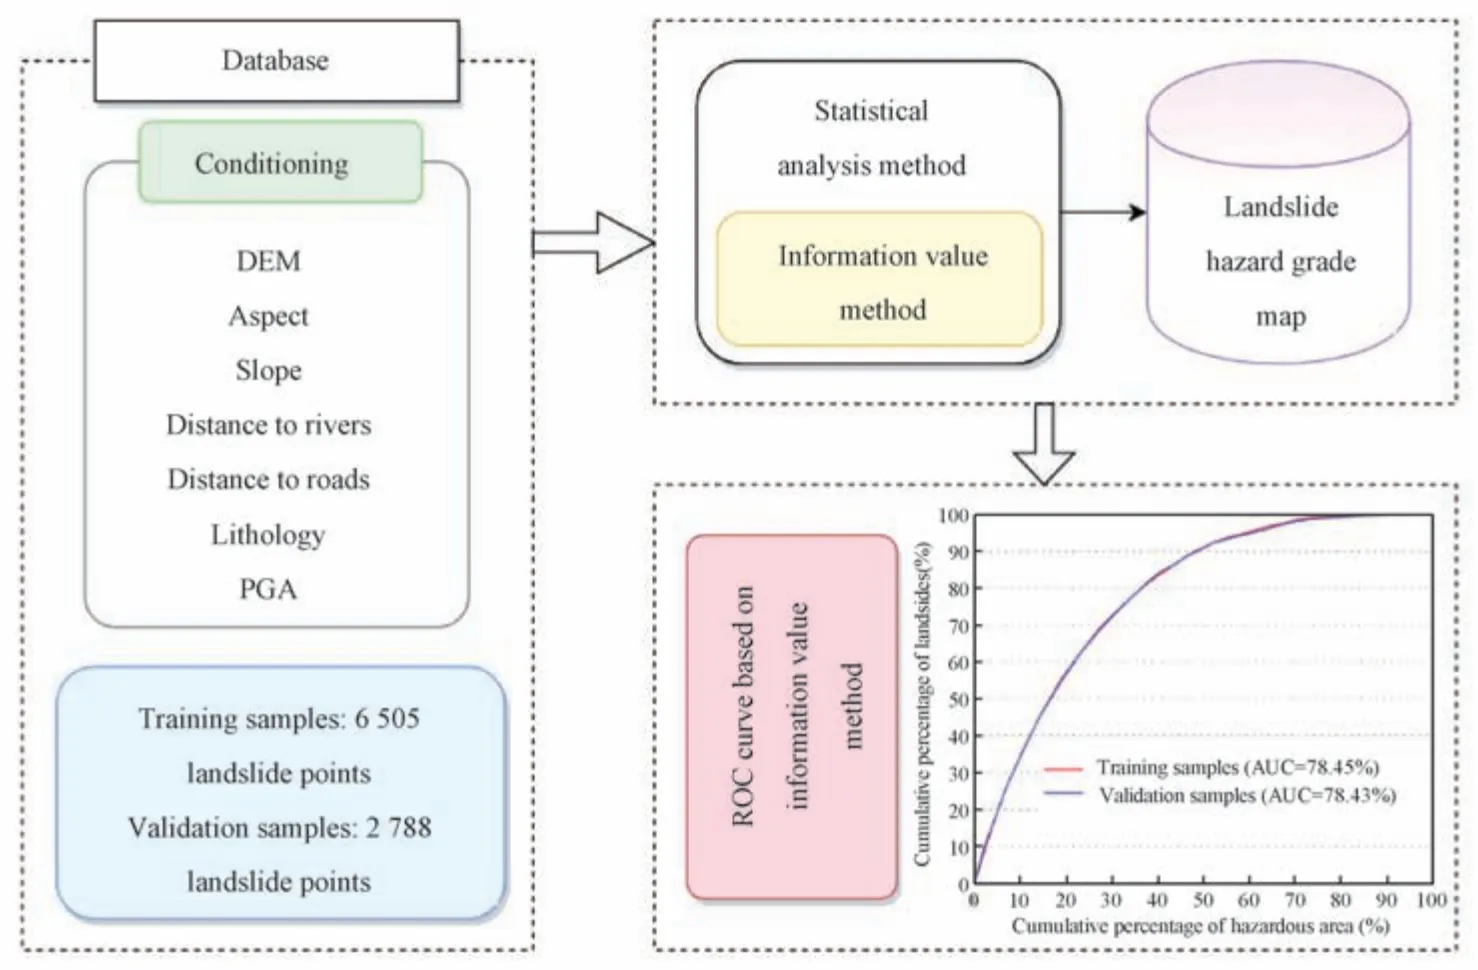
Figure 5 The technical circuit diagram of this study
3 RESULTS AND ANALYSIS
3.1 Information Amount Value of Impact Factors
Table 2 shows the calculation results of the information amount value of each classification of the seven influence factors.The information amount value of the DEM of 100-200 m is 0.43,which is the highest information amount of all categories.Therefore,the decline of the elevation classification mainly occurs between 100-200 m.The number of landslides in this category is 5 843,with an area of 20.42 km2,accounting for 66.23% of the total area of landslides.In general,as the DEM increases,the number of landslides may first increases and then decreases.This is because the area with DEM in the range of 200-625 m is basically distributed in the northeast corner of the study area,which is far away from the epicenter and active faults.The impact is small and not conducive to the occurrence of landslides.The information amount values of 10°-20°,20°-30°,30°-40°,and>40°under the slope classification are 0.22,0.39,0.32,and-0.23,respectively.They generally increase first and then decrease.Among them,20°-30° has the largest amount of information value.Compared with other slope ranges,landslides occur more in this range.The number of landslides in this category is 2 444,with an area of 6.82 km2,accounting for 22.11% of the total area of landslides.According to previous studies,higher slopes are more likely to trigger landslides(Xu Chong et al.,2012a;Fan Xiaoyi,2013;Sun Yanping et al.,2018;Yang Genyun et al.,2018).However,this time the landslides are more distributed on low slopes rather than high slopes.Because the high slopes are concentrated in higher altitude areas,the region far from the epicenter and active faults,which is not conducive to the occurrence of landslides.
The landslides are concentrated in four directions:Northeast(NE),East(E),Southeast(SE),and South(S).Among them,the SE direction has the highest information amount value,which is the high occurrence area of earthquake landslides.The number of landslides in this direction is 1 802 and the area is 5.73 km2accounting for 18.58% of the total area of the landslide.Under the classification of distance to roads,the largest amount of information is 1-2 km,indicating that the distance of 1 to 2 km to the roads is conducive to the occurrence of landslides.The landslide density within this distance range is 21.04 units/km2,and the landslide area is 10.20 km2,accounting for 33.07% of the total landslide area.Similarly,landslides occur most when the distance to rivers is 900-1 200 m.The density of landslide points in this distance range is 20.45 units/km2,and the landslide area is 5.46 km2,accounting for 17.72% of the total landslide area.
The lithology in this study which occupies most part of the area is Middle to Late Miocene non-marine sediments(N2sn).Therefore,landslides are also mostly distributed in this lithology,and the information amount value is also the highest.The number of landslides is 8 759,with an area of 28.04 km2,accounting for 90.93% of the total area of landslides.Among them,no landslide occurs in Middle Eocene marine and non-marine sediments(PG2sr)and river(wt).The hazard index of landslides in these two classifications is extremely low,leading to a-10 information amount value.The PGA factors are divided into eight categories.Among them,the amount of information is the largest in the range of 0.6-0.7,where the landslides also occur most.The area of this classification accounts for 21.97% of the study area.The density of landslide points is 25.32 units/km2and the area of landslides is 5.69 km2,which accounts for 18.45% of the total landslide area.
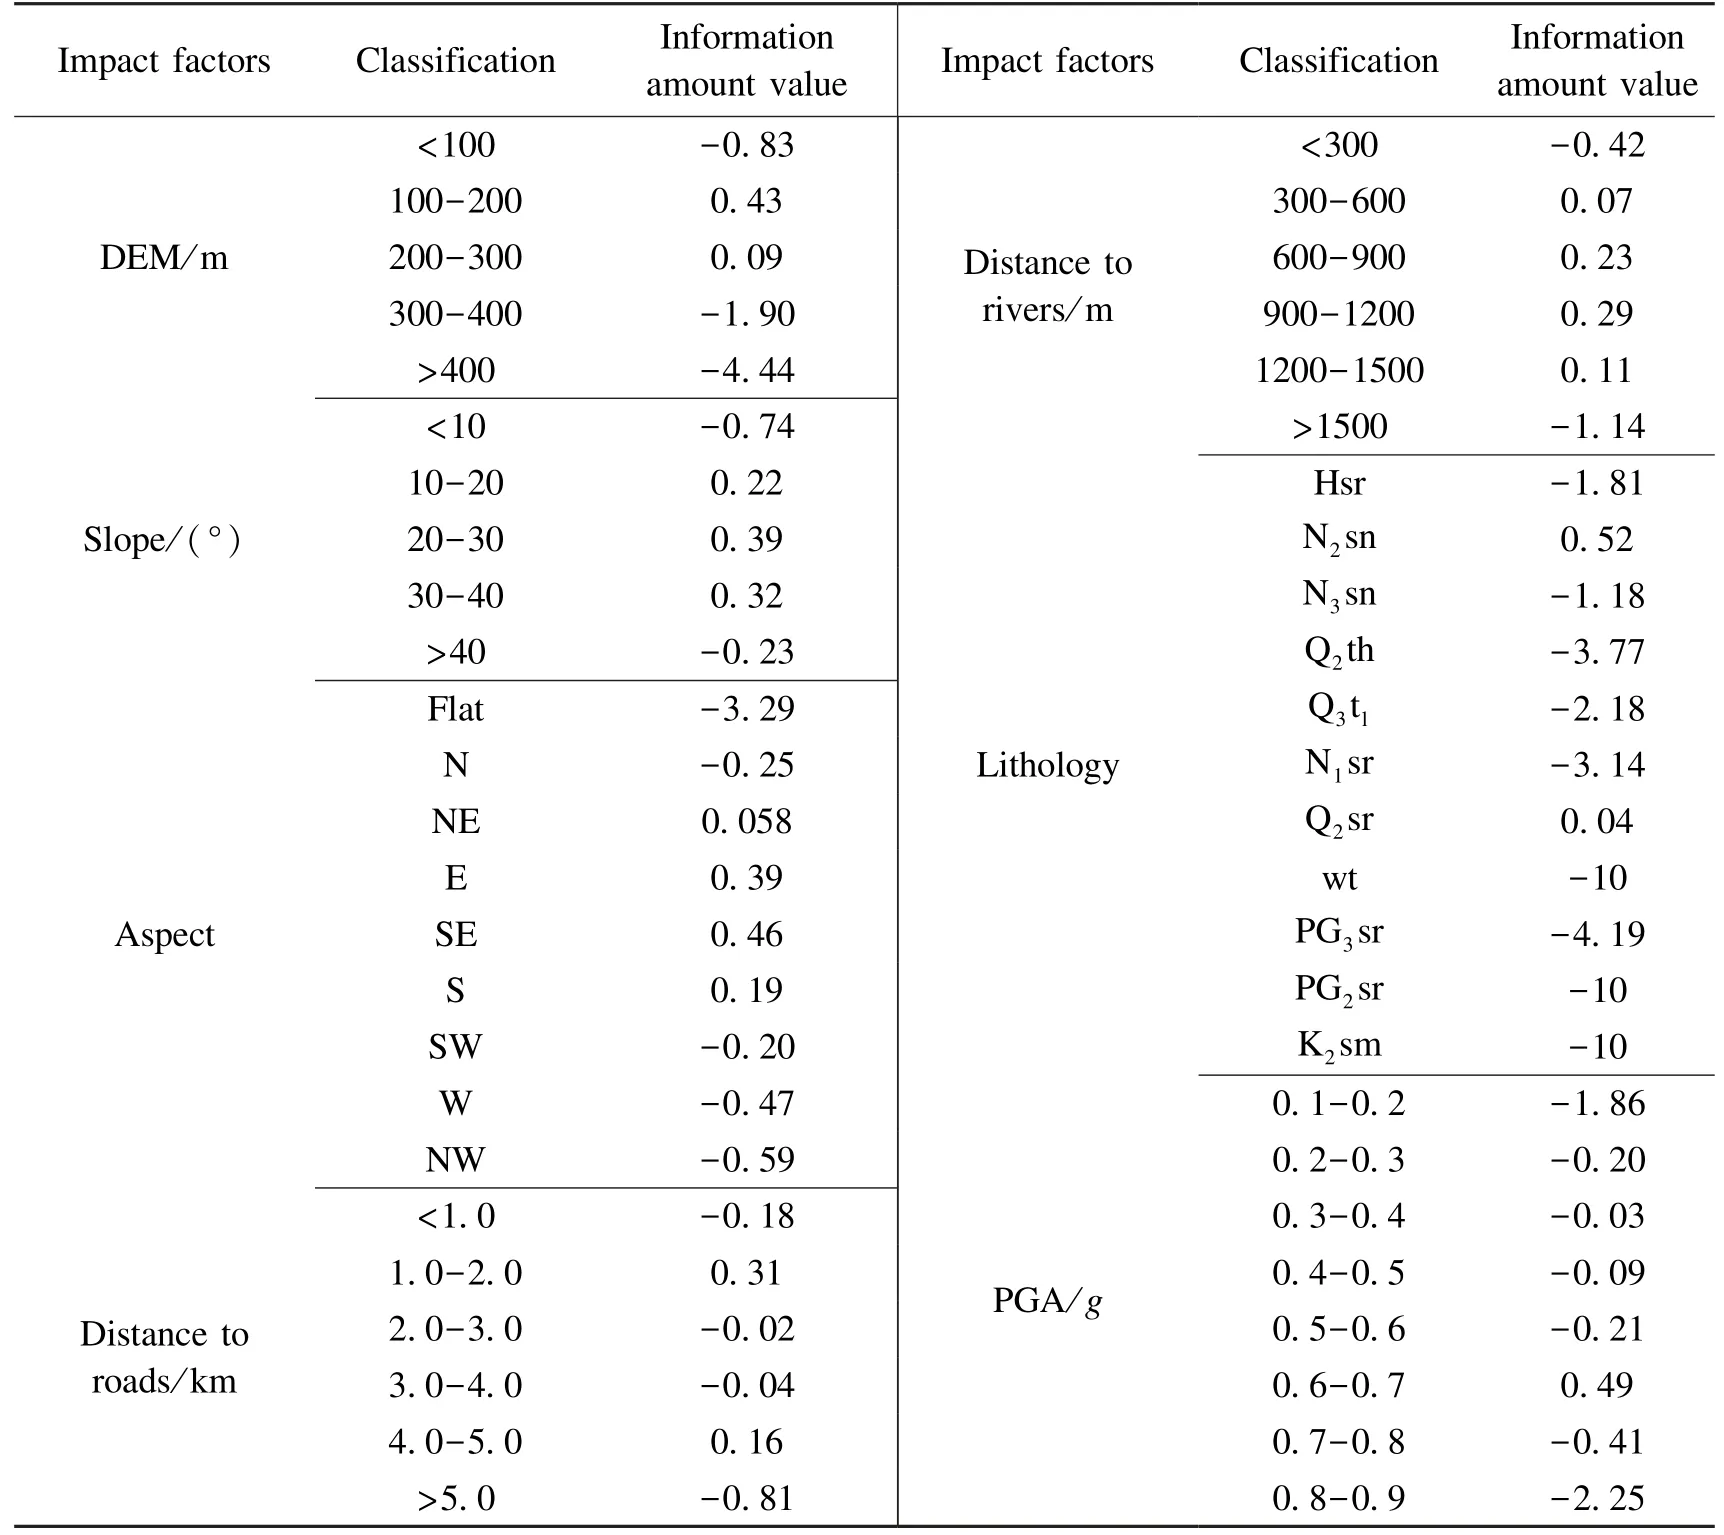
Table 2 The information amount value of each classification of impact factors
According to the foregoing,the regional earthquake landslides that are more likely to occur with stronger PGA,but in this study,landslides with a PGA of 0.7-0.9gdecrease instead.The reason may be some deviations in the PGA data or the limitations of the information method.In the vicinity of the northeast corner of the study area,the risk level evaluation chart shows that the area is of high and very high risk,but the number of landslides in this area is much less than other equally dangerous areas.This is the same as the case of PGA,because the impact factor is not a single factor that affects the occurrence of landslides,but rather the interaction between each impact factor to jointly promote or restrict the occurrence of landslides.However,the information method is a binary statistical method,which cannot reflect the interaction between factors,resulting in unavoidable deviations.
3.2 Hazard Risk Assessment Result
After assigning the information amount value to each classification layer,we superimpose each influence factor layer to obtain the distribution map of seismic landslide risk index in the study area(Fig.6(a)),and further divide the risk index value into 5 levels by using natural break method of ArcGIS:the very low risk area(-17.69-7.16),the low risk area(-7.16-1.50),the moderate risk area(-1.50-0),the high risk area(0-1.50),the very high risk area(1.50-2.91),and then the final seismic landslide risk evaluation result chart(Fig.6(b))is obtained.
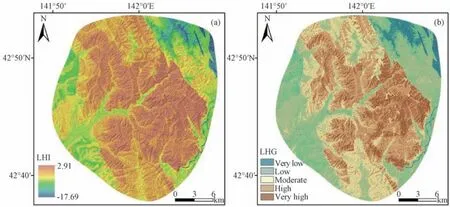
Figure 6 Landslide hazard index(LHI)map and landslide hazard grade(LHG)map of Hokkaido earthquake in Japan
The specific information of each risk level is shown in Table 3(Fig.7):

Table 3 Information for each risk level
3.3 Verification of Assessment Results
Fig.7 shows that with the increase of risk level,the area of landslide in the study area also increases,among which the high-risk and very high-risk area accounts for 37.95% of the total study area.The landslide area in these two grades is 22.93 km2,accounting for 74.35% of the total landslide area.However,the area from the very low risk area to the moderate risk area only accounts for 25.65% of the total landslide area.In total,7 576 landslides are distributed in high-risk areas and very high-risk areas,accounting for 81.52%of the total number of landslides.The risk zoning map is highly consistent with the actual situation of landslides.
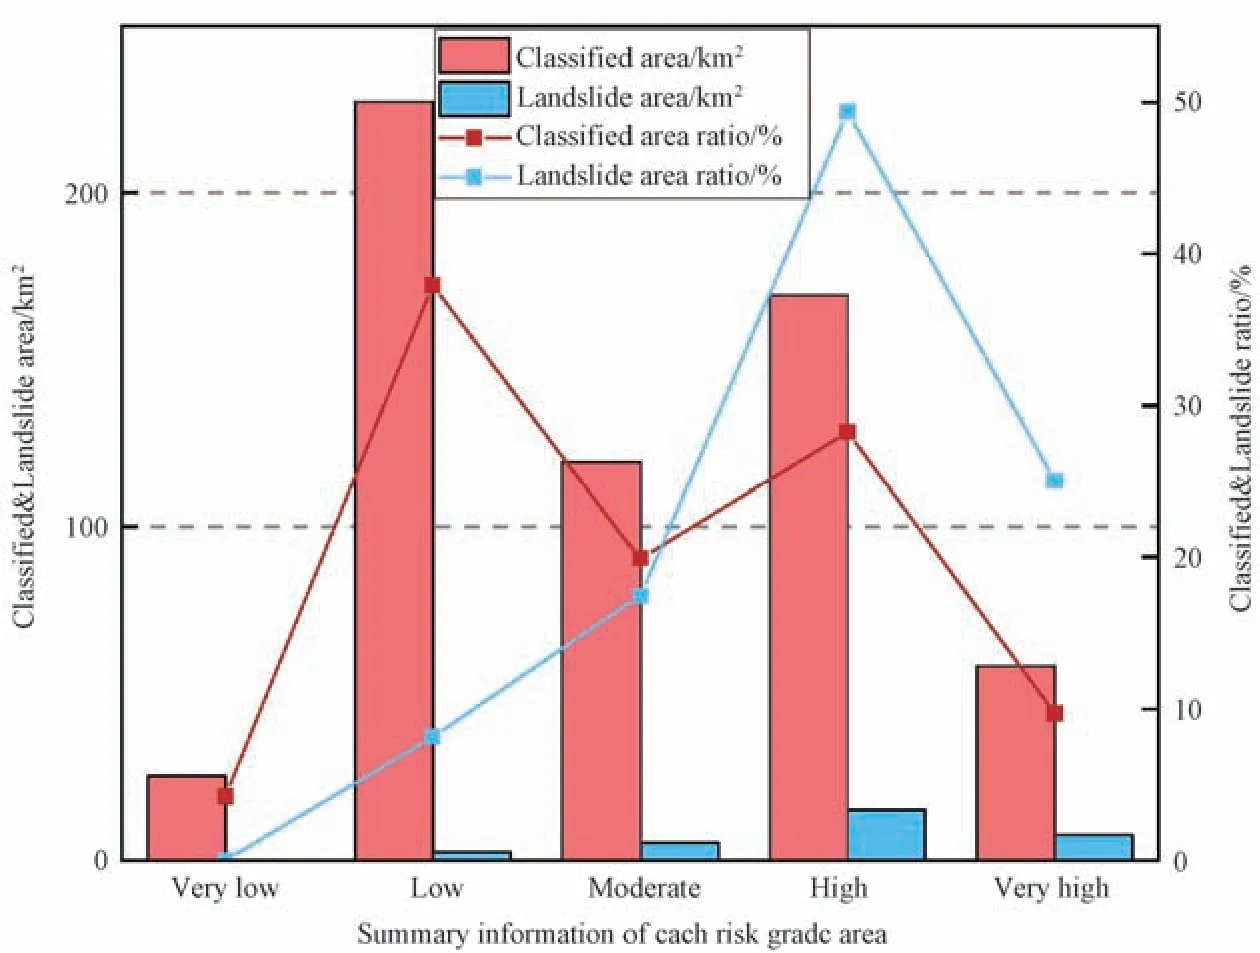
Figure 7 Summary information map of each risk grade area and landslide area
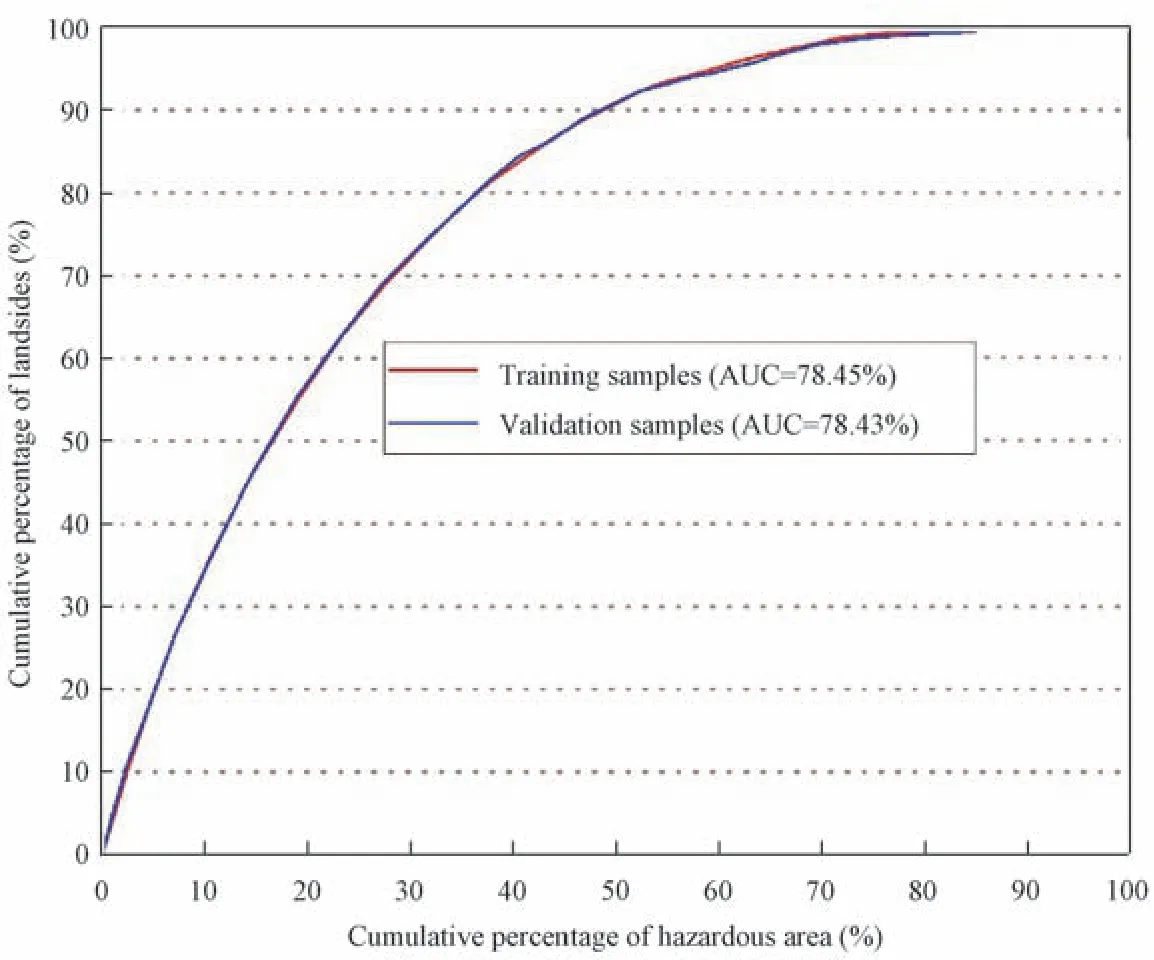
Figure 8 Area under curve(AUC)representing the success rate and prediction rate accuracy of the Information Value method
We quantitatively compare the training samples and verification samples with the risk grade assessment chart,and use the comparison results for the test of success rate and predication rate.Xu Chong et al.(2013a)use the method of area under the curve of cumulative percentage of both hazardous area and landslides number to test the accuracy of the result.The Hokkaido earthquake landslide hazard index is divided into 100 parts from high to low,the number of raster in each part and the percentage of the total raster number are obtained.Correspondingly,the number of landslides in the training samples and those in the verification samples in each part are calculated as a percentage of the total number of these two samples landslides.We construct the curve of cumulative percentage of hazardous area and number of landslides for the training and validation samples,and finally obtain the assessment curve of the hazard result(Fig.8).The area percentage under the curve(AUC)is used to evaluate the accuracy of the assessment results.Fig.8 shows that the success rate of information value method is 78.45%,and the prediction rate is 78.43%.The assessment results of information value method are relatively ideal,suggesting that the information value method based on GIS plays a more important role in spatial prediction and prevention of landslide.
4 CONCLUSIONS
This paper selects seven influence factors including elevation,aspect,slope,distance to flow,distance to road,lithology,and PGA.The information value method is used to calculate the amount of information value of each influence factor classification.The landslide hazard index map in the study area is obtained by assigning information values to influence factors and superimposing the calculation in ArcGIS.As a result,the hazard index is divided into five risk grades and the landslide hazard risk assessment results are obtained.Finally,the accuracy of the evaluation method is verified by using the verification curve,and the following conclusions are drawn:
(1)Landslide is most prone to occur with the following requirements:①The elevation is within 100-200 m;②The slope is within 20°-30°;③The slope direction is SE;④The distance to roads is within 1-2 km;⑤The distance to rivers is within 900-1 200 m;⑥The lithology is Middle to Late Miocene non-marine sediments(N2sn);⑦PGA is within the range of 0.6-0.7g.
(2)According to the hazard risk assessment results,the landslide area ratio in the highrisk and the very high-risk area is 74.35% and the number of landslide amount ratio is 81.52%.Most of the landslides in the study area are distributed in the high-risk and the very high-risk area,which is consistent with the actual situation.The evaluation results are tested by using the curve of cumulative percentage of both hazardous area and landslides number,indicating that the success rate of the information value method is 78.50% and the prediction rate is 78.43%.The information value method is evaluated by using the curve of percentage accumulation of hazardous results and the number of landslides.The results suggest that the success rate of the method is 78.50% and the prediction rate is 78.43%.In conclusion,the assessment results of the information value method are ideal.Besides,the results obtained in this paper may provide new insights and information for future research.The landslide hazard grade map of Hokkaido earthquake in Japan is also beneficial for future disaster prevention and mitigation work.
(3)The advantage of the information value method is that it can quickly obtain the landslide risk assessment results with high accuracy.However,it belongs to a binary statistical model and cannot solve the problem of mutual interference between impact factors.The internal comparative analysis cannot comprehensively evaluate which is the most favorable factor for landslide occurrence.For the assessment of the landslide risk in Hokkaido,a multivariate statistical model can be used for further research.
ACKNOWLEDGMENT
The authors thank for the suggestions from Xu Jixiang and Huang Yuandong from China University of Geosciences(Beijing)and Zhang Pengfei from the Institute of Geology,China Earthquake Administration.
 Earthquake Research Advances2020年1期
- Earthquake Research Advances的其它文章
- Spatial Distribution of Seismic Landslides in the Areas of 1927 Gulang M8.0 Earthquake
- The Spatial Distribution and Attribute Parameter Statistics of Landslides Triggered by the May 12th,2008, MW7.9 Wenchuan Earthquake
- Distribution of Landslides in Baoshan City,Yunnan Province,China1
- Discrete Element Modeling of Tangjiagou Two-Branch Rock Avalanche Triggered by the 2013 Lushan MW 6.6 Earthquake,China
- A Discrete Element Analysis of the Sliding Friction Heat in High-Speed and Long-Runout Landslides
- A Statistical Estimation Model for the Impact Force of Dry Granular Flow Against Rigid Barrier1
