A Statistical Estimation Model for the Impact Force of Dry Granular Flow Against Rigid Barrier1
ZHAO Binbin and JIANG Yuanjun
1)Faculty of Engineering,China University of Geosciences,Wuhan,430074,China
2)China Electric Power Research Institute Co.,Ltd.,Beijing 100055,China
3)Institute of Mountain Hazards and Environment,CAS,Chengdu 610041,China
The impact force on retaining structure,which is caused by granular flow comprised of dry particles originated from shallow landslide failure,still lacks systematic studies.In order to support the potential design requirement of structure used to resist this kind of impact,a series of dry granular impact experiments are conducted on one rigid barrier model.According to parametric analysis results,one nonlinear regression model is proposed to correlate total normal impact force at critical time(Fcr)with its influential parameters.Further,we complete a systematic statistics analysis and obtain a subsequent optimum regression equation based on the proposed model.According to experience and dimension balance,the equation is modified and finally transformed into one non-dimensional equation,which shows good agreement between predicted and observed results.
Key words:Granular flow;Impact force;Rigid barrier
INTRODUCTION
In recent years,increasingly frequent occurrence of intense earthquakes have drawn more and more attention;for instance,M8.0 Wenchuan earthquake on May 12th,2008,China(Cui Peng et al.,2008);M8.8 Chile earthquake on February 27th,2010,Chile(Serey A.et al.,2019).As a result,either big or small shallow slope failures triggered by earthquakes become a common consequent disaster which may lead to severe destruction to mountainous roads as well as local residences,and are commonly reported from previous studies(Yang Zongji et al.,2017).Fig.1 shows the severe shallow landslide failure along a main road located in Yingxiu County,the epicenter of Wenchuan earthquake,China,2008.Sometimes,debris produced by shallow landslides which contain a large amount of gravels and stones travel down to the foot of mountain,destroying and blocking important roads.In order to guarantee the safety of roads and transportations in the disaster area,protection structures against dry granular flow should be constructed.Therefore,the intensity of impact load exerted on those structures has attracted the concern of engineering designs and relevant researche.
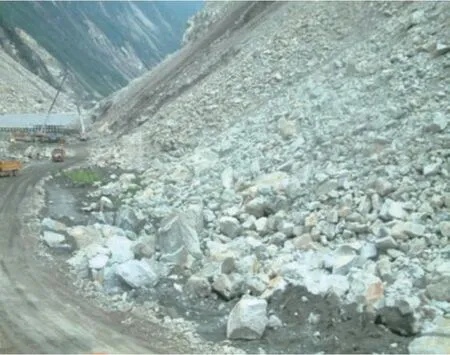
Figure 1 Dry granular flow along the road in Yingxiu County,the epicenter of Wenchuan earthquake,2008,China
Protection structures constructed against rockfall,including metal fence,cable net,rigid barrier are deployed along important roads or in the vicinity of residences.Currently,those structures are designed only for preventing the falling of a single rock particle,and several load calculation theories or methods of rockfall are developed.Among them,the most frequently used empirical equation is that in Japanese Rockfall Protection Measures(Japan Road Association,2000)as shown in Eq.(1).

in whichmis the rockfall mass,λrepresents the Lame constant,His the fall height,andβstands for the factor defining the relation between the thickness of cushioning layer and the diameter of the impacting rock particle.Besides,some relevant research are conducted by Gerber W.(2001).All the previous studies mainly have the similar goal to address the relationship between impact force and kinetic energy of a falling rock.
The fluid-like and solid-like contingency of dry granular flow makes its impact behavior essentially different from the impact of water-saturated debris flow and the impact of a single rock particle(Jiang Yuanjun et al.,2015).During the impact force on retaining structure,granular material cannot easily escape from the narrow slots or drainage channels,instead most of them may deposit in front of the retaining structure(Jiang Yuanjun et al.,2018).This specific feature causes a problem that the impact force calculation of dry granular flow cannot easily rely on the current equations for wall or fence of a single rockfall resistance,or the equations based on classic fluid mechanics for sabo dam design.
Considering that the distinct feature of dry granular flow,the authors conduct model tests for the purpose of finding the relation between impact force and several common and basic parameters which may describe the basic features of the interested shallow landslide,and also shed light on the vacancy in impact force calculation of dry granular flow.
1 TESTED MATERIALS,EXPERIMENT APPARATUS AND METHODOLOGY
Four kinds of very uniform gravels are selected and designated as gravel 1,gravel 2,gravel 3,gravel 4.Table 1 shows the bulk densityγ,mean particle diameterD50,angle of reposeθ,and basal friction angleδ.Among them,angle of repose is measured by referring to the method introduced by Carrigy M.(1970).The basal friction angles between material and sheet are calculated referring to Pudasaini S.P.et al.(2007)and Mancarella D.et al.(2010).

Table 1 Physical characteristics of experimental materials

Table 2 Test configuration
One flume,which is 2.93 m in length,0.35 m in height and 0.3 m in width,is constructed to reproduce the flow environment of dry particles as shown in Fig.2.The side walls of the flume are covered by 1 mm-thick polyethylene sheets for protection.The base of the flume could be covered by acrylic sheet or one kind of coarse paper sheet to separately simulate different base friction.A rigid barrier instrumented with six load cells is installed at the bottom end of the flume,perpendicular to the flume base,which is able to measure impact force in normal and tangential directions.The sketch of flume is shown in Fig.2,while the arrangement of load cells is shown in Fig.3.
The test configuration is varied in a parametric fashion.For a kind of material its initial deposition is described by initial deposition lengthLand heightH,in whichLchanges approximately from 0.1 m to 0.4 m by a 0.1 m interval,as height changes from 0.05 m to 0.2 m by a 0.05 m interval.The set of slope angles(α)are selected as 30°,35°,40° and 45° to the horizon line.In addition,a trigger gate is used to control the start of granular flow,whose distance to the rigid barrier may change like 0.37 m,0.72 m,2.19 m,or 2.56 m.The configuration can be seen in Fig.2.Therefore,for a material at one gate distance,by varyingL,Handα,64 tests are conducted.By changing the tested material,gate positions,and base frictions,eight cases with a total of 512 of tests are run.Accordingly,those eight cases of experiments generally can reflect the effects of common influential parameters in granular flow,which are also feasible to be measured by field tests.
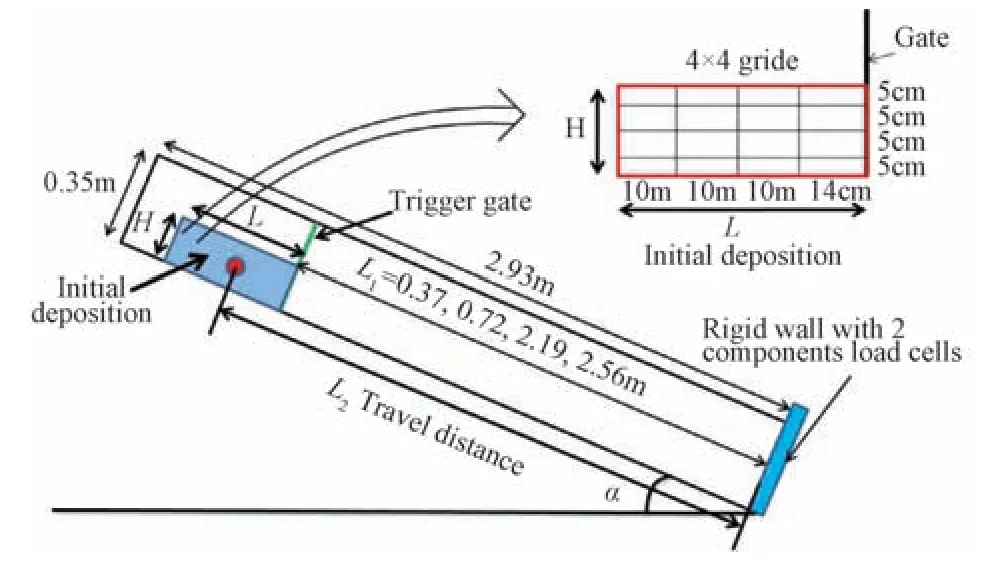
Figure 2 Sketch of experimental flume
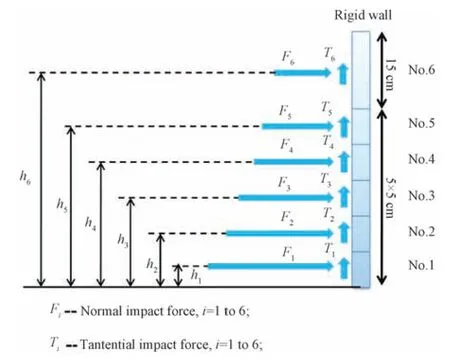
Figure 3 Sketch of rigid wall and positive directions of impact forces
2 EXPERIMENTAL RESULTS
Normal and tangential forces with respect to the surface of rigid barrier are recorded by load cells,the positive directions are shown in Fig.3.Fig.4 shows the impact force history of test gravel 1-L44-H15-45-24.59-2.19,which represents the test of gravel 1 with initial deposition 44 cm in length and 15 cm in height.Besides,the slope angle is 45°,bed friction angle is 24.59°,and gate position is 2.19 m.It is clear that both normal and tangential forces achieve peak values during impact,and the magnitude of peak force is obviously larger than static forces.Since normal impact force is the dominating component for the safety of a retaining structure,and the magnitude of tangential force is not comparable to normal force as shown in Fig.4,we mainly focus on the normal impact force in this study.
3 PARAMETRIC ANALYSIS
By using the impact force on each load cellFi,and its distance to the bottom of rigid barrierhi,the total normal impact forceFand its bending momentMnear the bottom of the rigid barrier are calculated by Eqs.(2)and(3).The time of the maximum bending moment is used to define critical time of rigid barrier.Accordingly,the total normal impact force at the critical time is determined asFcr.Fig.5 shows the time histories ofFandM.
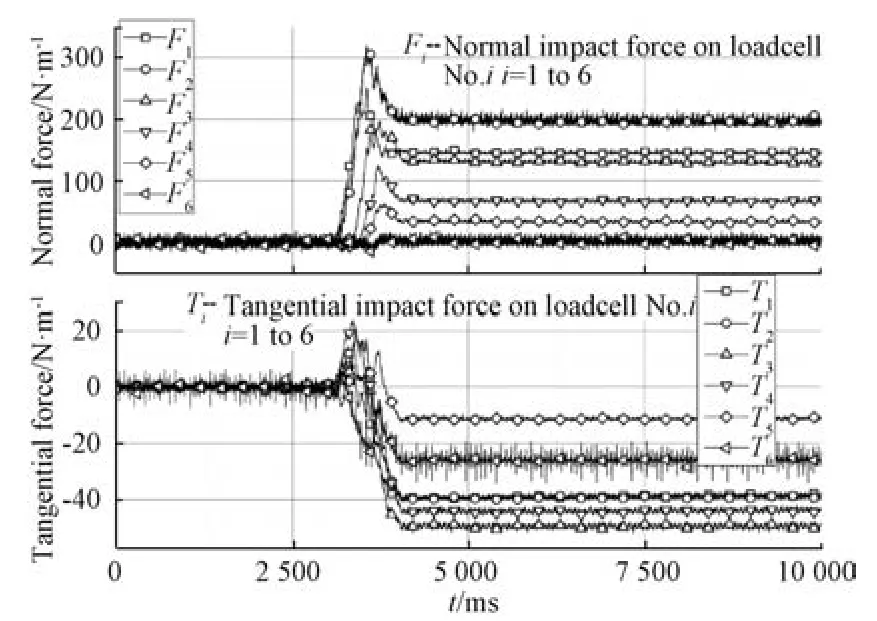
Figure 4 Impact force history of test gravel 1-L44-H15-45-24.59-2.19
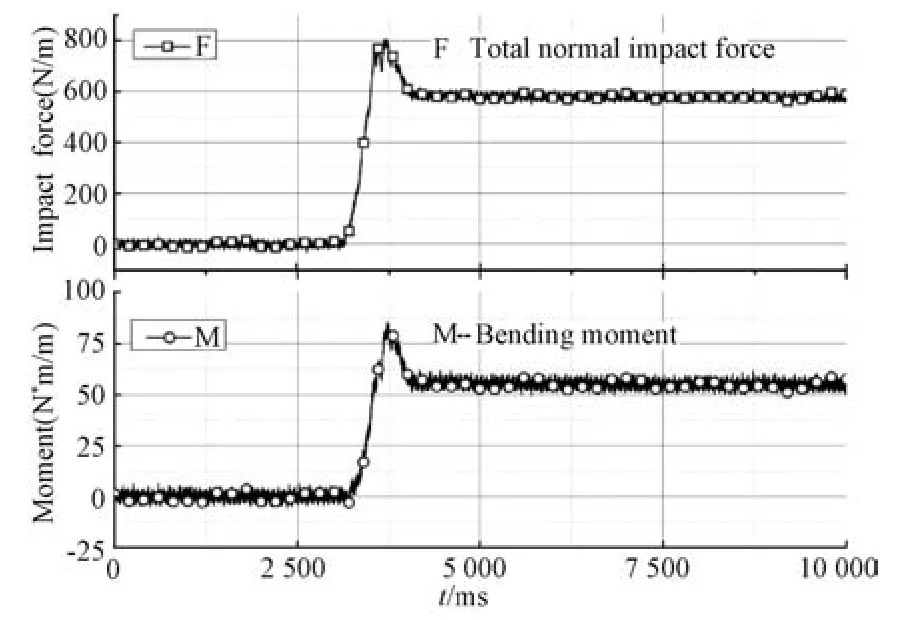
Figure 5 Total normal impact force and bending moment history
The influences of eight parameters,which are namely slope angleα,angle of reposeθ,bed friction angleδ,travel distanceL2,initial deposition lengthL,initial deposition heightH,mean particle diameterD50and specific weightγ,onFcrare plotted from Fig.6 to Fig.13 for the purpose of exhibiting the influence of each individual parameter.
Normally when showing the influence of one specific parameter,other parameters are supposed to be fixed to promise that only the parameter of interest can change.It is possible to do this rigorous analysis forα,L2,L,Handδin one kind of tested material.However,this ideology cannot be completely implemented in all analyses,because the actual physical parameters of different materials are always uncontrollable.Takeθas an example,materials of differentθalso have differentD50andγ,it is impossible to show the influence ofθonFcrwithout changingD50andγ.Therefore,the parametric analyses ofθ,D50andγas shown in Fig.11 to Fig.13 are less accurate to be referred.
Regardless of the low accuracy in the parametric analyses ofθ,D50andγ,Fig.6 to Fig.13 generally show the trends ofFcrtowards other influential parameters exceptγ,although it is not yet enough to get quantitative conclusions from those scatter plotting.According to naked eye judgment all the eight parameters can be divided into two categories according to their influences onFcr.In general,Fcrincreases withα,θ,L2,L,H,D50,while it decreases withδ.The influence ofγcannot be distinguished by the current plotting.
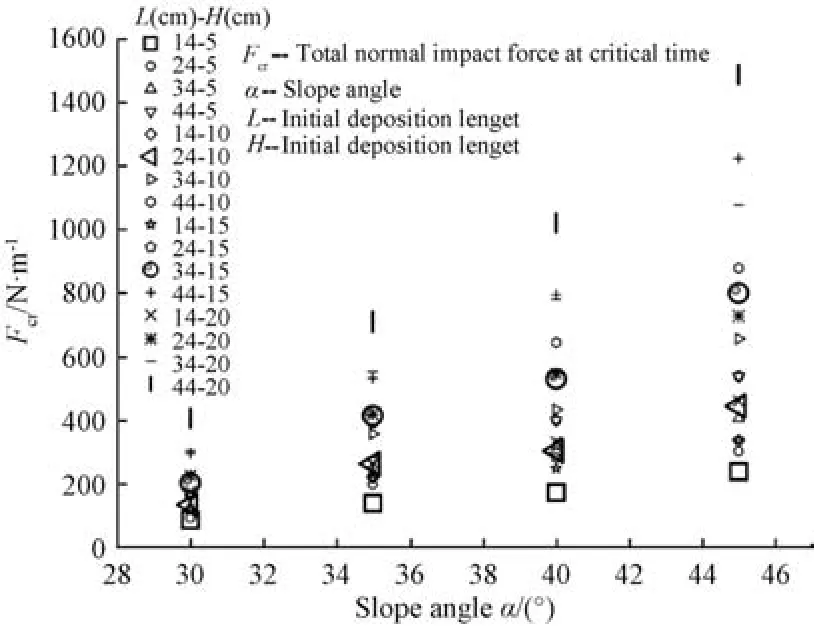
Figure 6 Influence of α on Fcr,test gravel 1-L44-H15-45-24.59-2.19
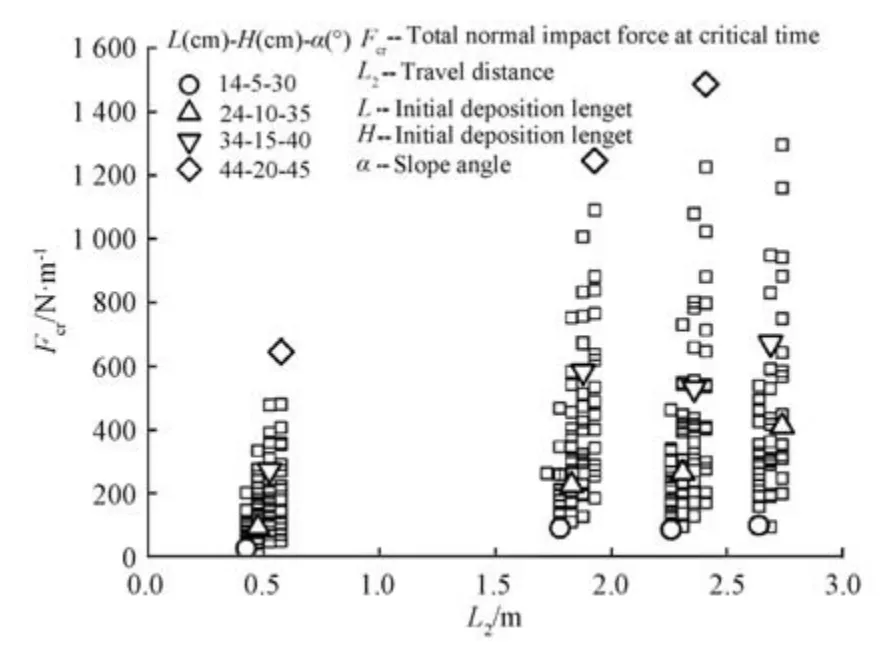
Figure 7 Influence of L2 on Fcr,gravel 1,gate position 2.56 m,2.19 m,1.76 m,0.34 m
4 STATISTICAL AND REGRESSION ANALYSIS
Since direct scatter plotting cannot lead to quantitative description of the influences of those parameters onFcr,statistical analysis is resorted.First of all,one regression model is assumed forFcrand its influential parameters based on the previous scatter plotting as shown in Eq.(4).Based on this regression model,a systematic regression analysis is completed,including:(1)dependency analysis;(2)main factors analysis;(3)empirical modification.

In order to eliminate the mutual interference between certain pairs of parameters,which is caused by the strong correlation between them,dependency analysis is made.Furthermore,it is found thatθandD50has a correlation coefficient larger than 0.98,suggesting a strong linear dependency between them.Subsequently,only one of them can appear in the final regression equation.
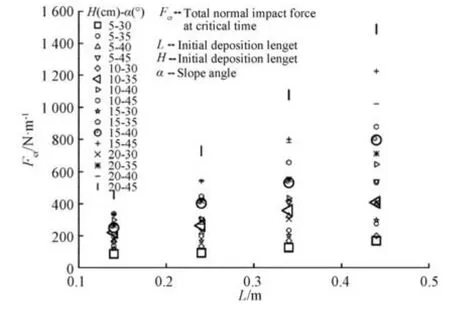
Figure 8 Influence of L on Fcr,gravel 1-L44-H15-45-24.59-2.19
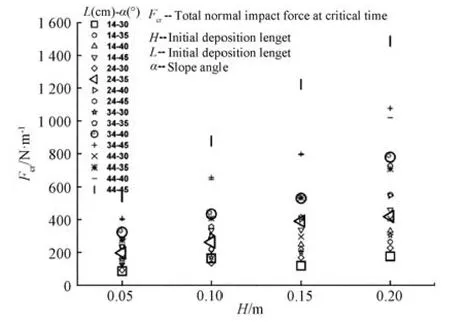
Figure 9 Influence of H on Fcr,gravel 1-L44-H15-45-24.59-2.19
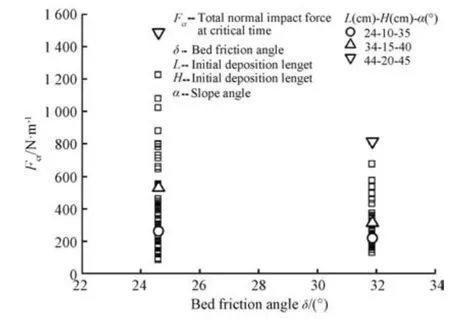
Figure 10 Influence of δ on Fcr,gravel 1 with bed friction angle 24.59°,31.85°
Main factor analysis is used to select influential factors from all the available parameters by stepwise regression method proposed by Efroymson M.A.(1960).Combined with experience and the requirement of dimension balance in regression equation,finally one empirical equation is gained as Eq.(5),whoseR2is 0.9572.
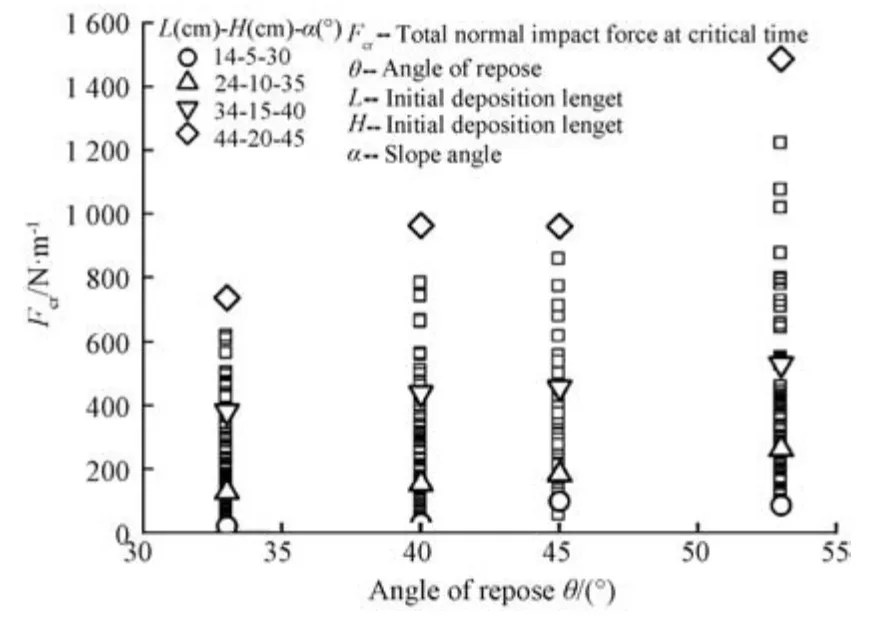
Figure 11 Influence of θ on Fcr,gravel 1,gravel 2,gravel 3,gravel4 at gate position 2.19 m,bed friction angle 24.59°
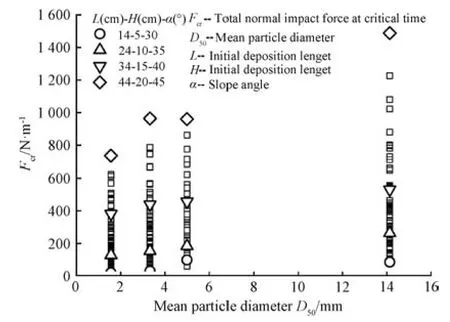
Figure 12 Influence of D50 on Fcr,gravel 1,gravel 2,gravel 3,gravel 4 at gate position 2.19 m,bed friction 24.59°
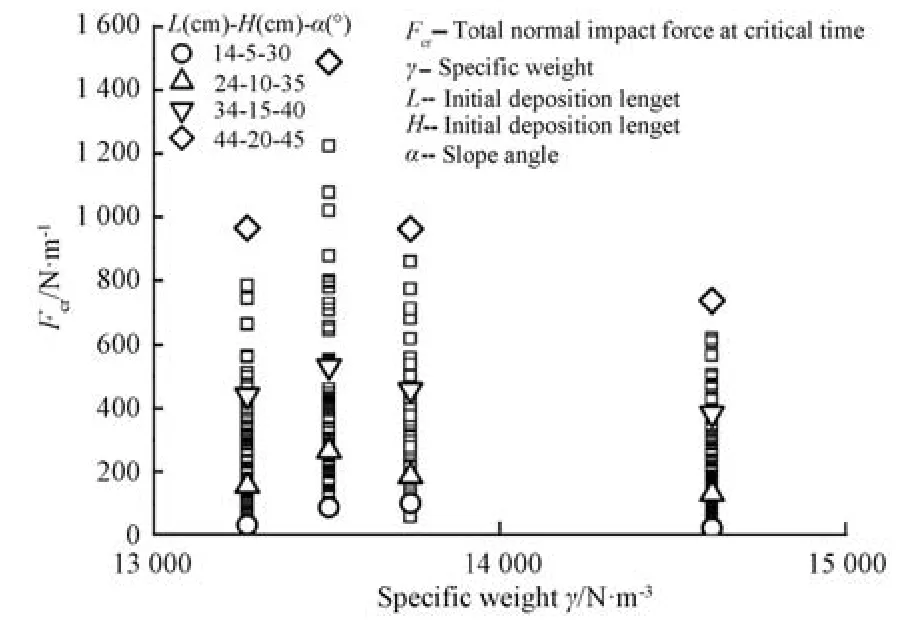
Figure 13 Influence of γ on Fcr,gravel 1,gravel 2,gravel 3,gravel 4 at gate position 2.19 m,bed friction 24.59°
5 NONDIMENSIONALIZATION ANALYSIS AND RESULT
In order to keep the dimension balance on the two sides of regression equation,a nondimensional model is proposed based on Eq.(5).Besides,the equation and its coefficients are determined as shown in Eq.(6).TheR2of Eq.(6)is 0.910 2,which is smaller than the previous direct regression results.Transforming Eq.(6)into the equivalent form as Eq.(7)and compare it with Eq.(5),we observe that the new exponent ofγis overestimated by more than one times.This is the price to get the non-dimensional relation.Although theR2of the non-dimensional equation decreases compared with Eq.(5),the quality of this regression equation is still satisfied.The estimated term and predictive terms of Eq.(6)are plotted in Fig.14,which shows a good agreement between the two sides of Eq.(6).Based on Eq.(6)or Eq.(7)the predicted results ofFcrnamed asFcrp,is compared with the observed results ofFcrin Fig.15.It shows that the predicted error is limited within±20% for most time,even though the maximum error is within±50%.
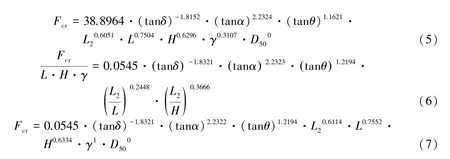
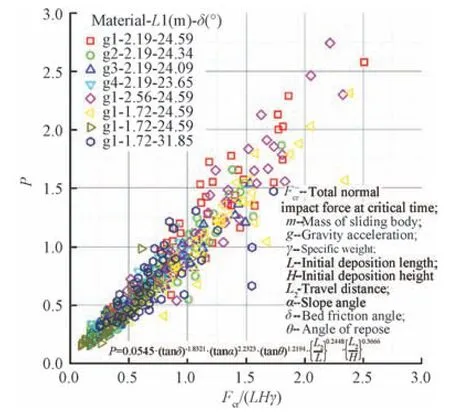
Figure 14 Normalized Fcr vs.the predictive terms of Fcr
6 DISCUSSION
The impact force of dry granular flow on the retaining wall is essential because the potential energy of initial deposition is converted into kinetic energy,and then acts on the rigid barrier to form the impact force.The aforementioned previous studies always aim to correlate impact force with potential energy or kinetic energy.Taking outL·H·γ·L2·sinαfrom the right side of Eq.(7),which is the potential energy of initial deposition,the obtained equation may reveal the relation between impact force and potential energy.
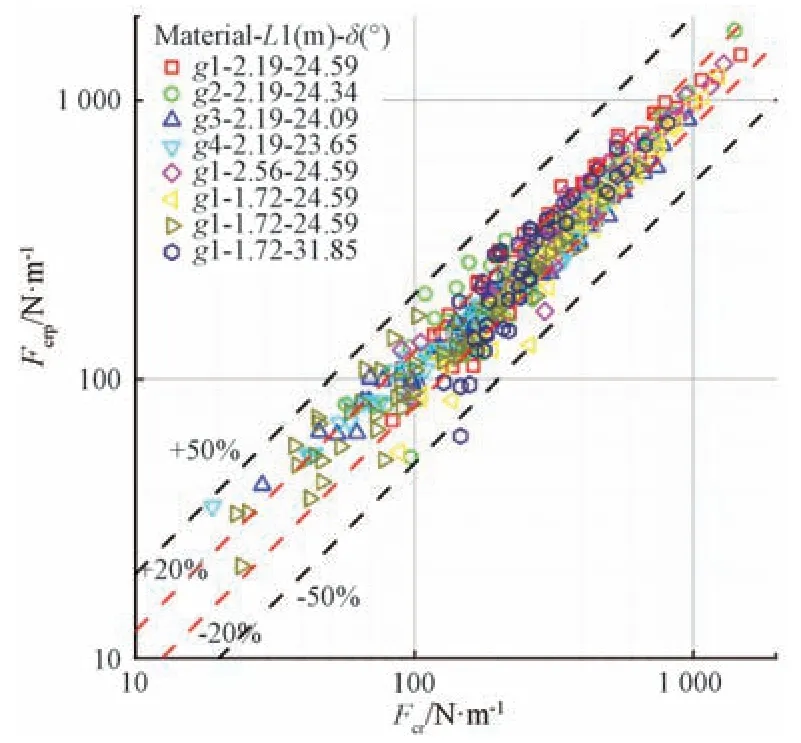
Figure 15 The prediction of Fcr vs.the observation of Fcr
7 CONCLUSION
By conducting a series of experiments of dry granular impact against a rigid wall,the impact force on the wall is studied.It is found that the normal impact force component is much larger than the tangential impact force component,therefore,the normal impact force could be the dominating component for the rigid barrier safety.On the basis of a systematic statistical analysis,the relationship between the impact force and a set of parameters was investigated.It is found that the slope angle,the angle of repose,the travel distance,the initial volume of the graunular material,the particle size of the material and its density have positive influence on the increase of impact force;while the basal friction has negative effect on impact force.From a complete systematic statistics analysis,it is obtained an optimum regression equation to estimate the imapct force.Accordingly,the equation is modified and finally transformed into one non-dimensional equation,the imapct forces estimated by this equation show good agreement with experimental results.The result shows the regression equation is sufficient to correlate the impact force with its influential parameters.The predicted results have good agreement with the observed results due to the low prediction errors which are mostly less then±20% even though the maximum error range reaches±50%.
 Earthquake Research Advances2020年1期
- Earthquake Research Advances的其它文章
- Spatial Distribution of Seismic Landslides in the Areas of 1927 Gulang M8.0 Earthquake
- The Spatial Distribution and Attribute Parameter Statistics of Landslides Triggered by the May 12th,2008, MW7.9 Wenchuan Earthquake
- Distribution of Landslides in Baoshan City,Yunnan Province,China1
- Hazard Assessment of Co-seismic Landslides Based on Information Value Method:A Case in 2018 MW6.6 Hokkaido Earthquake,Japan
- Discrete Element Modeling of Tangjiagou Two-Branch Rock Avalanche Triggered by the 2013 Lushan MW 6.6 Earthquake,China
- A Discrete Element Analysis of the Sliding Friction Heat in High-Speed and Long-Runout Landslides
