The Spatial Distribution and Attribute Parameter Statistics of Landslides Triggered by the May 12th,2008, MW7.9 Wenchuan Earthquake
DU Peng,XU Yueren∗,TIAN Qinjian,ZHANG Weiheng and LIU Shuang
1)Key Laboratory of Earthquake Prediction,Institute of Earthquake Forecasting,China Earthquake Administration,Beijing 100036,China
2)Heilongjiang Earthquake Agency,Harbin 150090,China
A complete landslide inventory and attribute database is the importantly fundamental for the study of the earthquake-induced landslide.Substantial landslides were triggered by the MW7.9 Wenchuan earthquake on May 12th,2008.Google Earth images of preand post-earthquakes show that 52 194 co-seismic landslides were recognized and mapped,with a total landslides area of 1 021 km2.Based on the statistics,we assigned all landslide parameters and established the co-seismic landslides database,which includes area,length,and width of landslides,elevation of the scarp top and foot edge,and the top and bottom elevations of each located slope.Finally,the spatial distribution and the above attribute parameters of landslides were analyzed.The results show that the spatial distribution of the co-seismic landslides is extremely uneven.The landslides that mainly occur in a rectangular area(a width of 30 km of the hanging wall of the Yingxiu-Beichuan fault and a length of 120 km between Yingxiu and Beichuan)are obviously controlled by surface rupture,terrain,and peak ground acceleration.Meanwhile,a large number of small landslides(individual landslide area less than 10 000 m2)contribute less to the total landslides area.The number of landslides larger than 10 000 m2 accounts for 38.7%of the total number of co-seismic landslides,while the area of those landslides account for 88% of the total landslides area.The 52 194 co-seismic landslides are caused by bedrock collapse that usually consists of three parts:source area,transport area,and accumulation area.However,based on the area-volume power-law relationship,the resulting regional landslide volume may be much larger than the true landslide volume if the landslide volume iscalculated using the influenced area from each landslide.
Key words:Wenchuan MW7.9 earthquake;Earthquake-induced landslide;Inventories database;Landslide parameters;Landslide area
INTRODUCTION
At 14∶28,May 12th,2008,anMW7.9 earthquake occurred in the Longmenshan area with Yingxiu Town,Wenchuan County,Sichuan Province,China at the epicenter(31.0°N,103.4°E).The earthquake,characterized by high magnitude,shallow source,large release energy,and long duration,has become the largest earthquake in the Chinese mainland since 1950.The field investigations after the earthquake indicate that the earthquake produced 240 and 90 km surface rupture zones,along the Yingxiu-Beichuan fault(YBF)and the Guanxian-Jiangyou fault(GJF)respectively,(Fig.1).The maximum vertical and horizontal displacements are 6.8 m and 4.8 m respectively(Xu Xiwei et al.,2008;Tian Qinjian et al.,2009;He Honglin et al.,2008).The earthquake has caused serious casualties and huge loss of social and economic properties.According to official statistics,the earthquake killed 69 229 people in total with 17 923 missing.The earthquake also resulted in abundant geological disasters because of the relatively fragile geological environment and the long duration and high peak acceleration(Huang Runqiu et al.,2008a,2008b),such as landslides,bedrock collapse,etc.According to preliminary statistics,these geological disasters killed approximately 20 000 people(Yin Yueping,2008),accounting for more than a quarter of the number of people missing.In addition to ground motions,landslides are the most destructive factor to constructions.Numerous research studies have been conducted related to the landslides triggered in the earthquake-stricken areas.After the earthquake,the Land and Resources department comprehensively investigated the geological disasters that occurred in the areas affected by earthquake relief and post-disaster reconstruction,and they detected about 15 000 landslides,collapses,and mudslides in total(Yin Yueping,2008).Besides,some scholars described the basic characteristics of the landslides that occurred in earthquake-affected areas(e.g.hanging wall effect,topographic effect,development along the river valley and fault,the dominant sliding direction being the same as the SE direction of the upper plate thrust)and the landslide mechanism.(Xu Qiang et al.,2008;Huang Runqiu et al.,2008;Huang Runqiu,2009;Huang Runqiu et al.,2009;Yin Yueping,2009;Han Jinliang et al.,2009)
With the development of remote sensing,aerial photographs and remote sensing images of pre-and post-earthquake has played a key role in investigating and mapping landslides triggered by theMW7.9 Wenchuan earthquake.Many research results,including the visual interpretation and automatic identification of landslides have occurred using this technology.
First,based on the manual visual interpretation,Huang Runqiu(2009)obtained a deterministic landslide point of 16 704,according to the emergency investigation and the visual interpretation of various remote sensing data after the earthquake.Huang Runqiu(2009)also ascertained that a total of 35 000 collapsed landslides were induced by the Wenchuan earthquake,which was estimated by typical sample statistics.Xu Chong et al.(2014a)suggested that 197 481 landslides occurred in a region of approximately 110 000 km2based on a visual interpretation of high-resolution remote sensing images from post-earthquake and preearthquake,with a total landslides area of approximately 1 160 km2.
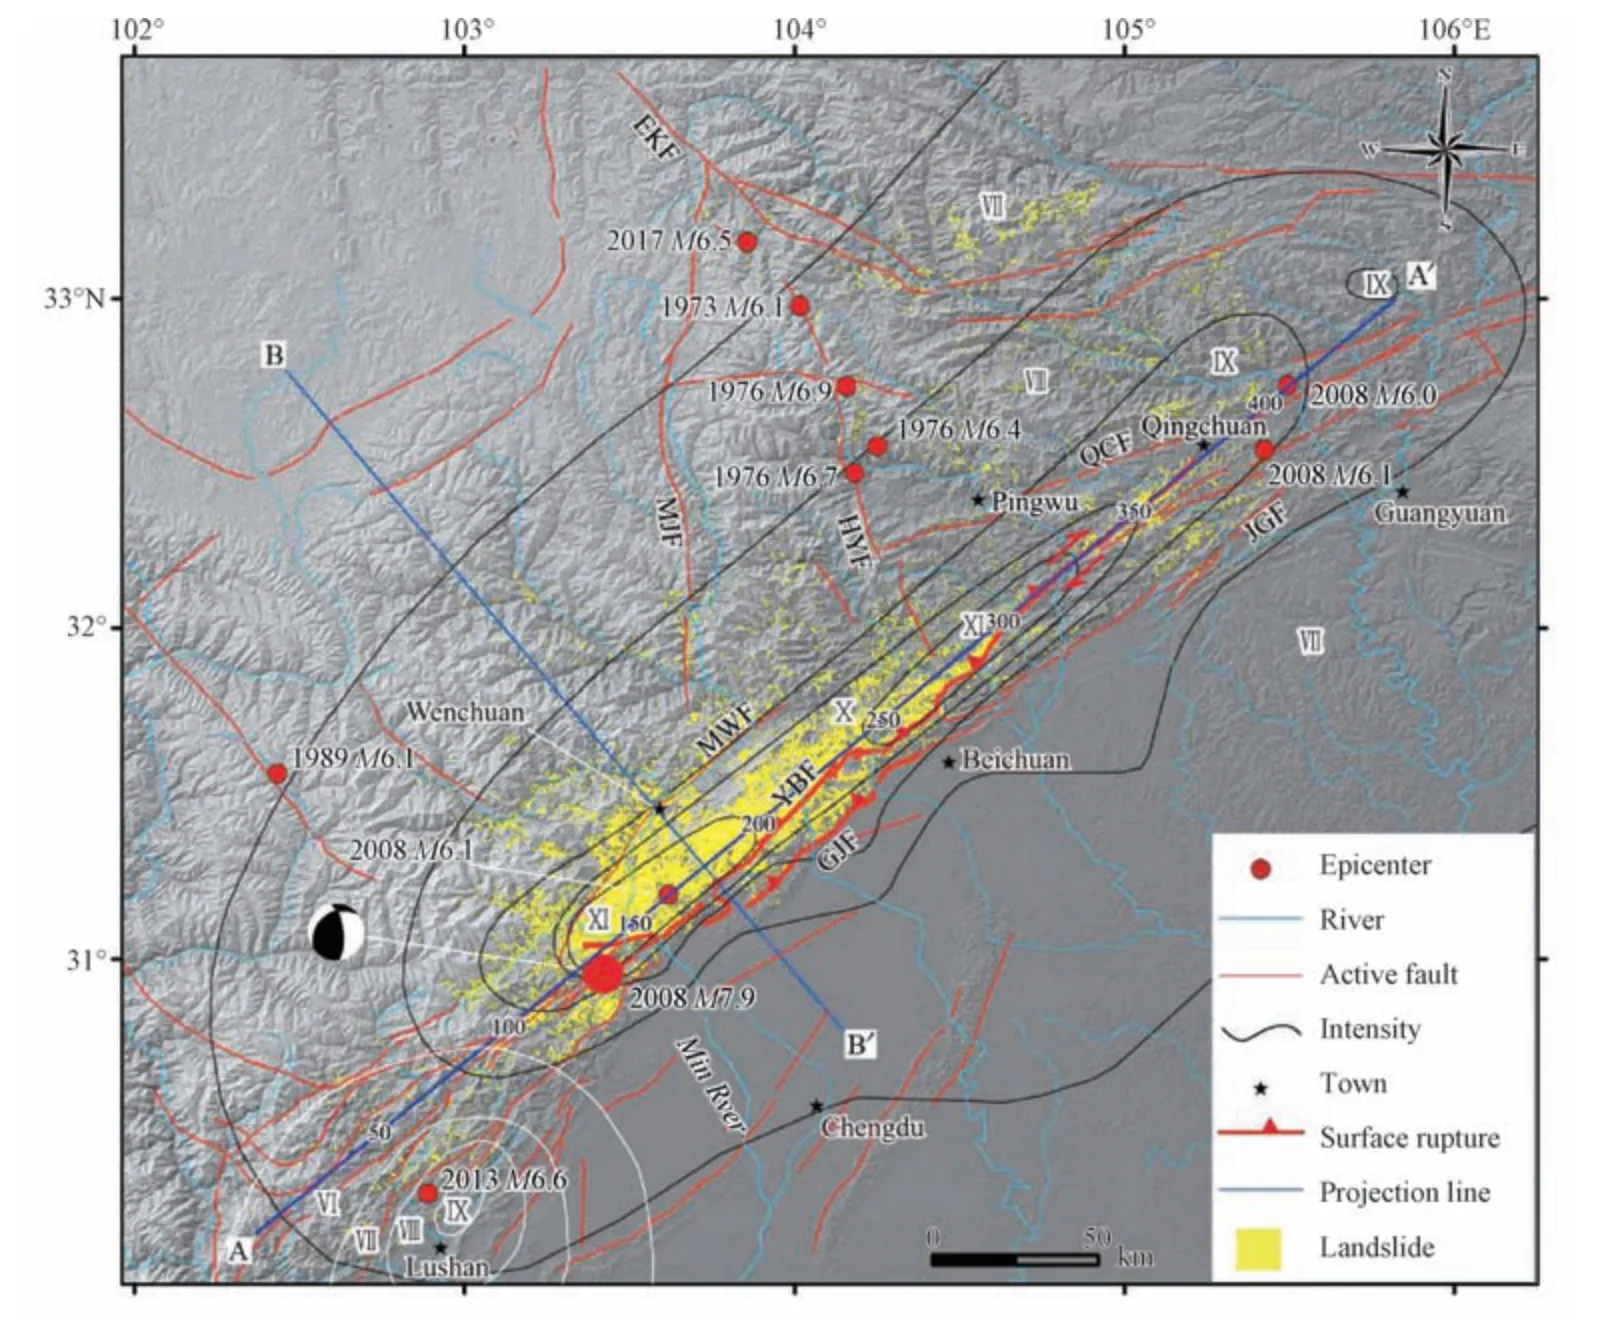
Figure 1 Structure of study area and the distribution of 2008 Wenchuan earthquake-induced landslides
In addition,Dai F.C.et al.(2011)estimated 56 000 landslides,with a total landslides area of 811 km2.Li Weile et al.(2013)used multi-resolution remote sensing images and estimated 43 842 landslides,with a total landslides area of 632 km2.Chen Xiaoqing et al.(2009)identified 1 135 725 landslides in the seismic region based on a 32 m resolution multi-spectral remote sensing image from Beijing No.1 satellite,with a total landslides area of 2 264.53 km2.Li Zhiguang et al.(2009)used the same method to identify 11 700 collapses and landslides,with a total landslides area of 2 275.42 km2.
Based on the automatic identification method from remote sensing images combined with manual correction,Parker R.N.et al.(2011)identified 73 367 co-seismic landslides,with a total landslides area of 565.8 km2.Li Gen et al.(2014)first used the high-resolution image to automatically identify the landslides,and then selected and screened according to a manual visual method.57 150 landslides were interpreted finally in the area of 38 270 km2,with a total landslides area of 396 km2.Wang Feng et al.(2009)used remote sensing technology to obtain information regarding secondary mountain disasters,including landslides,severely affected forested areas and identified 11 808 mountain disasters,with a total landslides area of 3 287 km2.Ouyang Zhiyun et al.(2008)used remote sensing data combined with field survey to find that the Wenchuan earthquake caused an area of ecosystem loss of 122 136 km2.Su Fenghuan et al.(2008)identified 5 700 landslides and analyzed their distribution patterns using the automatic extraction method based on ETM+as the main data source(Table 1).
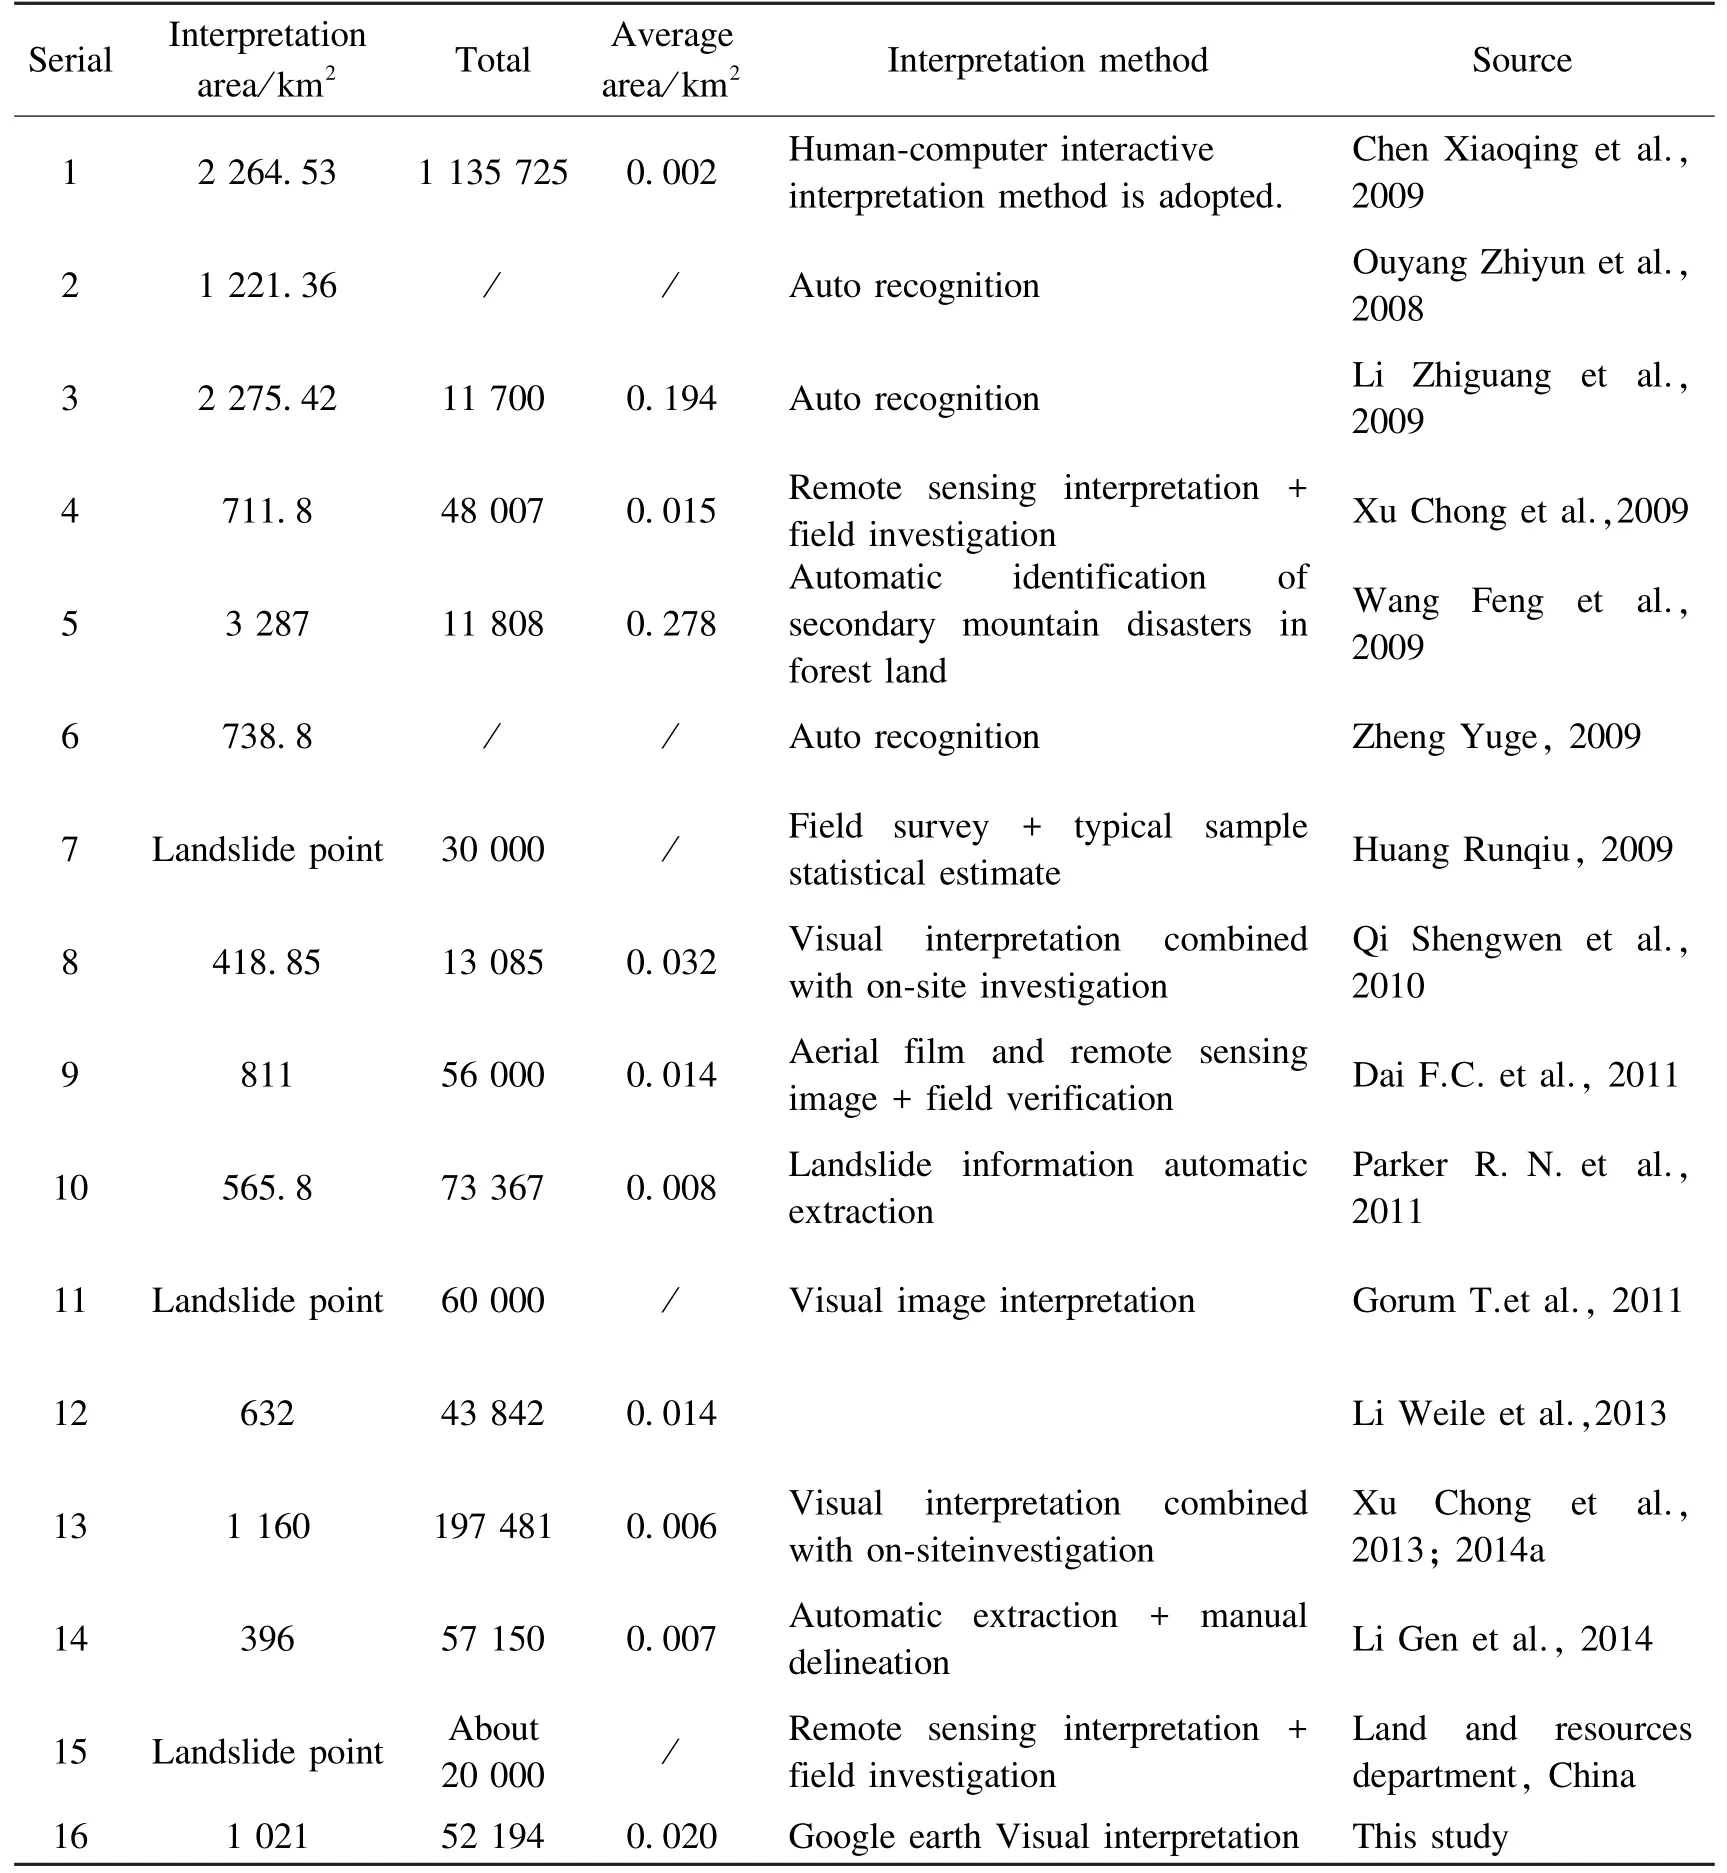
Table 1 Co-seismic landslides cataloging results from 2008
Furthermore,based on investigated and interpreted landslide distribution maps,some scholars indicate a correlation between the spatial distribution of landslides and various influencing factors,These research show that seismic parameters(seismic intensity/peak ground acceleration,distance from the fault fault)and geological(structure,lithology)and topographical conditions(slope angle,slope aspect,slope curvature,elevation)play more significant roles in controlling the formation of earthquake-induced landslides and collapses(Hou Jingrui et al.,2011;Li Xiuzhen et al.,2010;Wang Xiuying et al.,2010;Xu Chong et al.,2013;Chen Xiaoli et al.,2011;Dai F.C.et al.,2011;Qi Shengwen et al.,2010;Li Weile et al.,2013;Yin Jinhui et al.,2010).Several major earthquake events in recent years also have corresponding landslide catalogue data(Xu Chong et al.,2009,2012,2013,;Xu Chong,2013;Xu Chong et al.,2014a,2014b).The above studies on earthquake-triggered landslides either identify the boundaries of each landslide or represent the location of the landslide by points.Xu Chong et al.(2014a)also marked the top points of landslides triggered by theMW7.9 Wenchuan earthquake.Landslide catalogue has contributed greatly to the analysis of landslide spatial distributions and their correlations with various influencing factors.However,these studies have not statistically analyzed the length,width,and height of landslides.Length,width,and height are the basic geometric characteristics of landslides.Statistically analyzing morphological characteristics of earthquake-induced landslides may provide important theoretical and practical information for understanding and evaluating the risk of landslides.
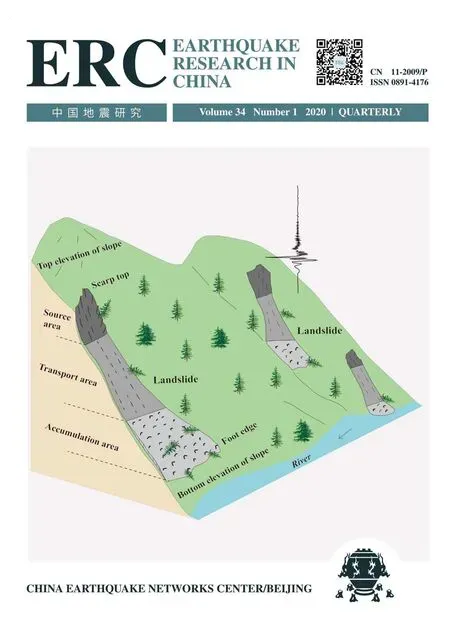
According to the IAEG(International Academy of Engineering Geology)definition of landslide terminology,the length of a landslide is defined as the minimum distance along the sliding direction from the scarp top to its foot edge.The width of a landslide is perpendicular to the maximum length direction.And,the height of a landslide is referred to as the elevation difference between the scarp top and the foot edge of the landslide tongue.The difference between the highest elevation of a located slope and that of the scarp top,and between the lowest elevation of the slope and its foot edge represent the position of the landslide on the slope.The difference between the elevation of the foot edge and that of the lowest point on the located slope also reflect the flow ability of the landslide and the valley at the bottom of the slope.
Based on pre-and post-earthquake Google Earth images,this study uses the manual visual interpretation method,combined with field investigation and verification,to interpret landslides triggered by theMW7.9 Wenchuan earthquake and establish a complete co-seismic landslide map(Fig.1).The parameters of those co-seismic landslides are assigned which include the length,width of the landslide,the scarp top and foot edge of the landslide,and the highest and lowest elevation of the located slope.A more quantitative analysis of these landslide parameters provides basic data for furthering the understanding risk-assessment of earthquake-triggered landslides.
1 DATA AND METHODS
The remote sensing images used in this paper are mainly obtained from Google Earth.The time period of the images range from 2005 to 2018 and the resolution is 1-5 m.Most regions in the study area have more than three image overlays available(Fig.2).In addition,domestic high-resolution satellite imagery GF-1,2 was used as a supplementary data source.
Google Earth supports 3-D display at any angle,thus the shape and contour of the landslide can be clearly distinguished.Based on the high-resolution Google Earth images with the 3-D DEM,the manual visual interpretation method was used to systematically identify the range of a single landslide along each basin of the seismic zone;such approach ensured the integrity of landslides.The non-co-seismic landslides were removed,ensuring the reliability of the data,by comparing the remote sensing images pre-and post-earthquake(data time is from 2005 to 2018).Then,we investigated and verified some of the co-seismic landslides in the field.As a result,we estimated that 52 194 landslides triggered byMW7.9 Wenchuan earthquake were interspersed in an area of nearly 130 000 km2,with a total landslides area of 1 021 km2.The minimum area among these landslides is only 47 m2,while the maximum is 5 611 000 m2,leading to an average of 19 556 m2.The parameters of all the landslides were assigned based on Google Earth and the co-seismic landslide database was established.

Figure 2 Local Google Earth images before and after Wenchuan earthquake and the interpretation of landslide range

Table 2 Co-seismic landslide database composition
2 RESULTS
2.1 Spatial Distribution
2.1.1 Spatial Distribution
The spatial distribution of landslides triggered by theMW7.9 Wenchuan earthquake is mainly controlled by fault distribution,topography,and the peak ground acceleration.The Wenchuan earthquake has produced two surface ruptures along the YBF and the GJF,and the co-seismic landslides were mainly distributed along the two surface ruptures and the hanging wall of the YBF(Fig.1).Along the surface ruptures,the distribution of the coseismic landslides is not uniform and the density at the southwest end of the surface ruptures is significantly larger than that at the northwest.
The length of the projection line A-A′in Fig.1 is 450 km,which is along the long axis direction of the equal intensity line of the Wenchuan earthquake.The projection line B-B′is 300 km,perpendicular to the projection line A-A′,and passes through Wenchuan County.The central point of each landslide is projected on the line A-A′ and B-B′,respectively.Then,with an interval of 10 km,the quantity and total area of the landslides are respectively counted(Fig.3).
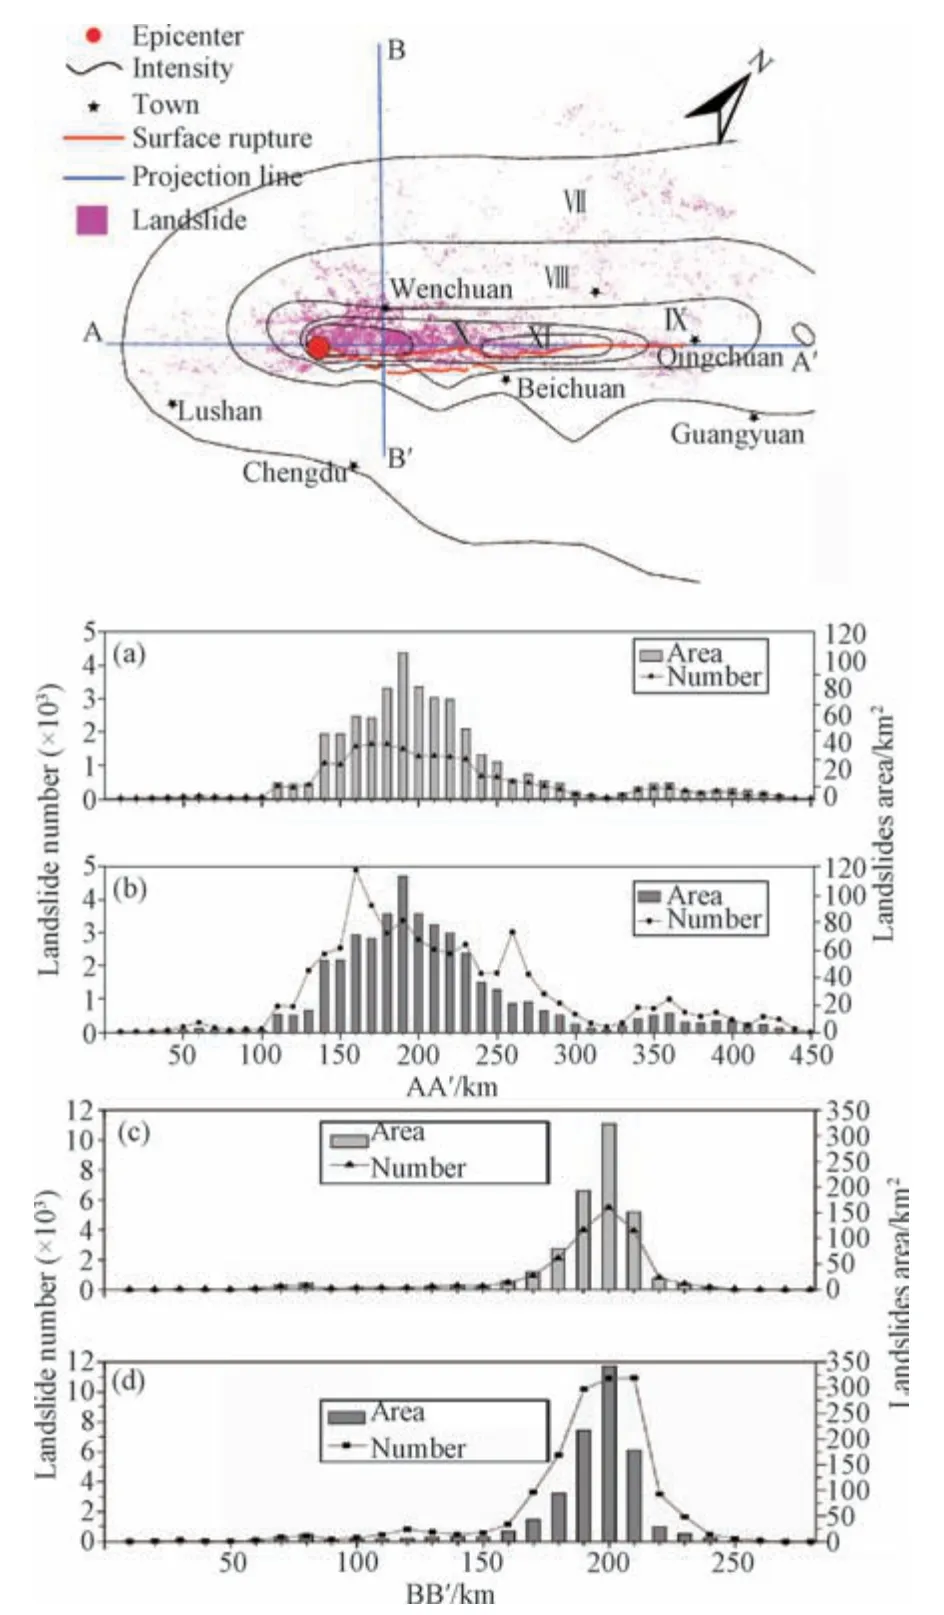
Figure 3 Statistics on the quantity and area of landslides on projection lines A-A′ and B-B′(10 km interval)
In Fig.3(b),it can be seen that on the projection line A-A′,for all landslides triggered by the Wenchuan earthquake,the quantity within the 120 km range between Yingxiu and Beichuan accounts for 64.8% of the total landslides and 78.2% of the total landslides area.In Fig.3(a),for landslides with an area larger than 10 000 m2,the quantity within the 120 km range between Yingxiu and Beichuan accounts for 72.9% of the total number of these landslides and 80.5% of their total landslides area.
In Fig.3(c),it can be seen that on the projection line B-B′,for all landslides triggered by the Wenchuan earthquake,the quantity within the 30 km range on the hanging wall of the Yingxiu-Beichuan fault accounts for 61.3% of the total landslides and 72% of the total landslides area.In Fig.3(d),the landslides with an area larger than 10 000 m2account for 66.3% of those within the 30 km range on the hanging wall of the YBF for 73.8% of their total landslides area.
2.1.2 Relationship between Landslide Distribution and Intensity
The seismic intensity of the study area is divided into XI,X,IX,VIII,VII,and≤VII and the co-seismic landslides are mainly distributed in the XI-and X-degree zones.Among the XI-degree zone landslides,the landslide area is 376 km2,accounting for 36.8%of the total estimated area.There are 17 276 landslides in this zone,accounting for 33.1%of the total number of landslides.In the X-degree zone,the landslide area is 313 km2,accounting for 30.7% of the total area.There are 14 040 landslides,accounting for 26.9%of the total number of landslides.For the area outside of the VII-degree zone,the landslide area is 5 km2,accounting for 0.5% of the total landslides area.There are 261 landslides in this zone,accounting for 0.5% of the total quantity(Fig.4).
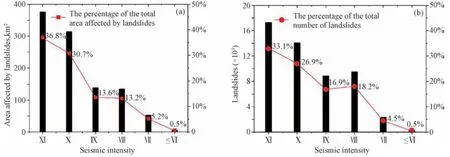
Figure 4 Statistics on landslide area(a)and landslide quantity(b)within each intensity
The landslide-area density in a certain intensity range represents the percentage of the area affected by landslides.As can be seen from Fig.5,the XI-degree zone has the highest surface density which reaches up to 16.29%,and the VII-degree zone has the smallest at only 0.06%.The landslide-point density is defined by the quantity of landslides per square kilometer.The landslide-point density of the XI-degree zone is the largest,7.5/km2,and that of the VII-degree zone is the smallest,only 0.03/km2.
It is worth noting that the Wenchuan earthquake produced two slender XI-degree meizoseismal zones:Yingxiu Town(the epicenter),and Beichuan County,which has experienced the most damage.Although they are both XI-degree meizoseismal zones,the landslide-area and landslide-point densities of the two zones are quite different.The XI-degree meizoseismal zone near Yingxiu Town has a landslide-area density of 25.87% and a landslidepoint density of 10.0/km2.However,in the Beichuan County's XI-degree meizoseismal zone,the landslide-area density is 5.4% and the landslide-point density is 4.4/km2.
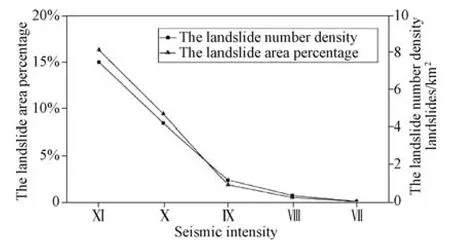
Figure 5 Statistics on landslide area percentage and quantity density within each intensity area
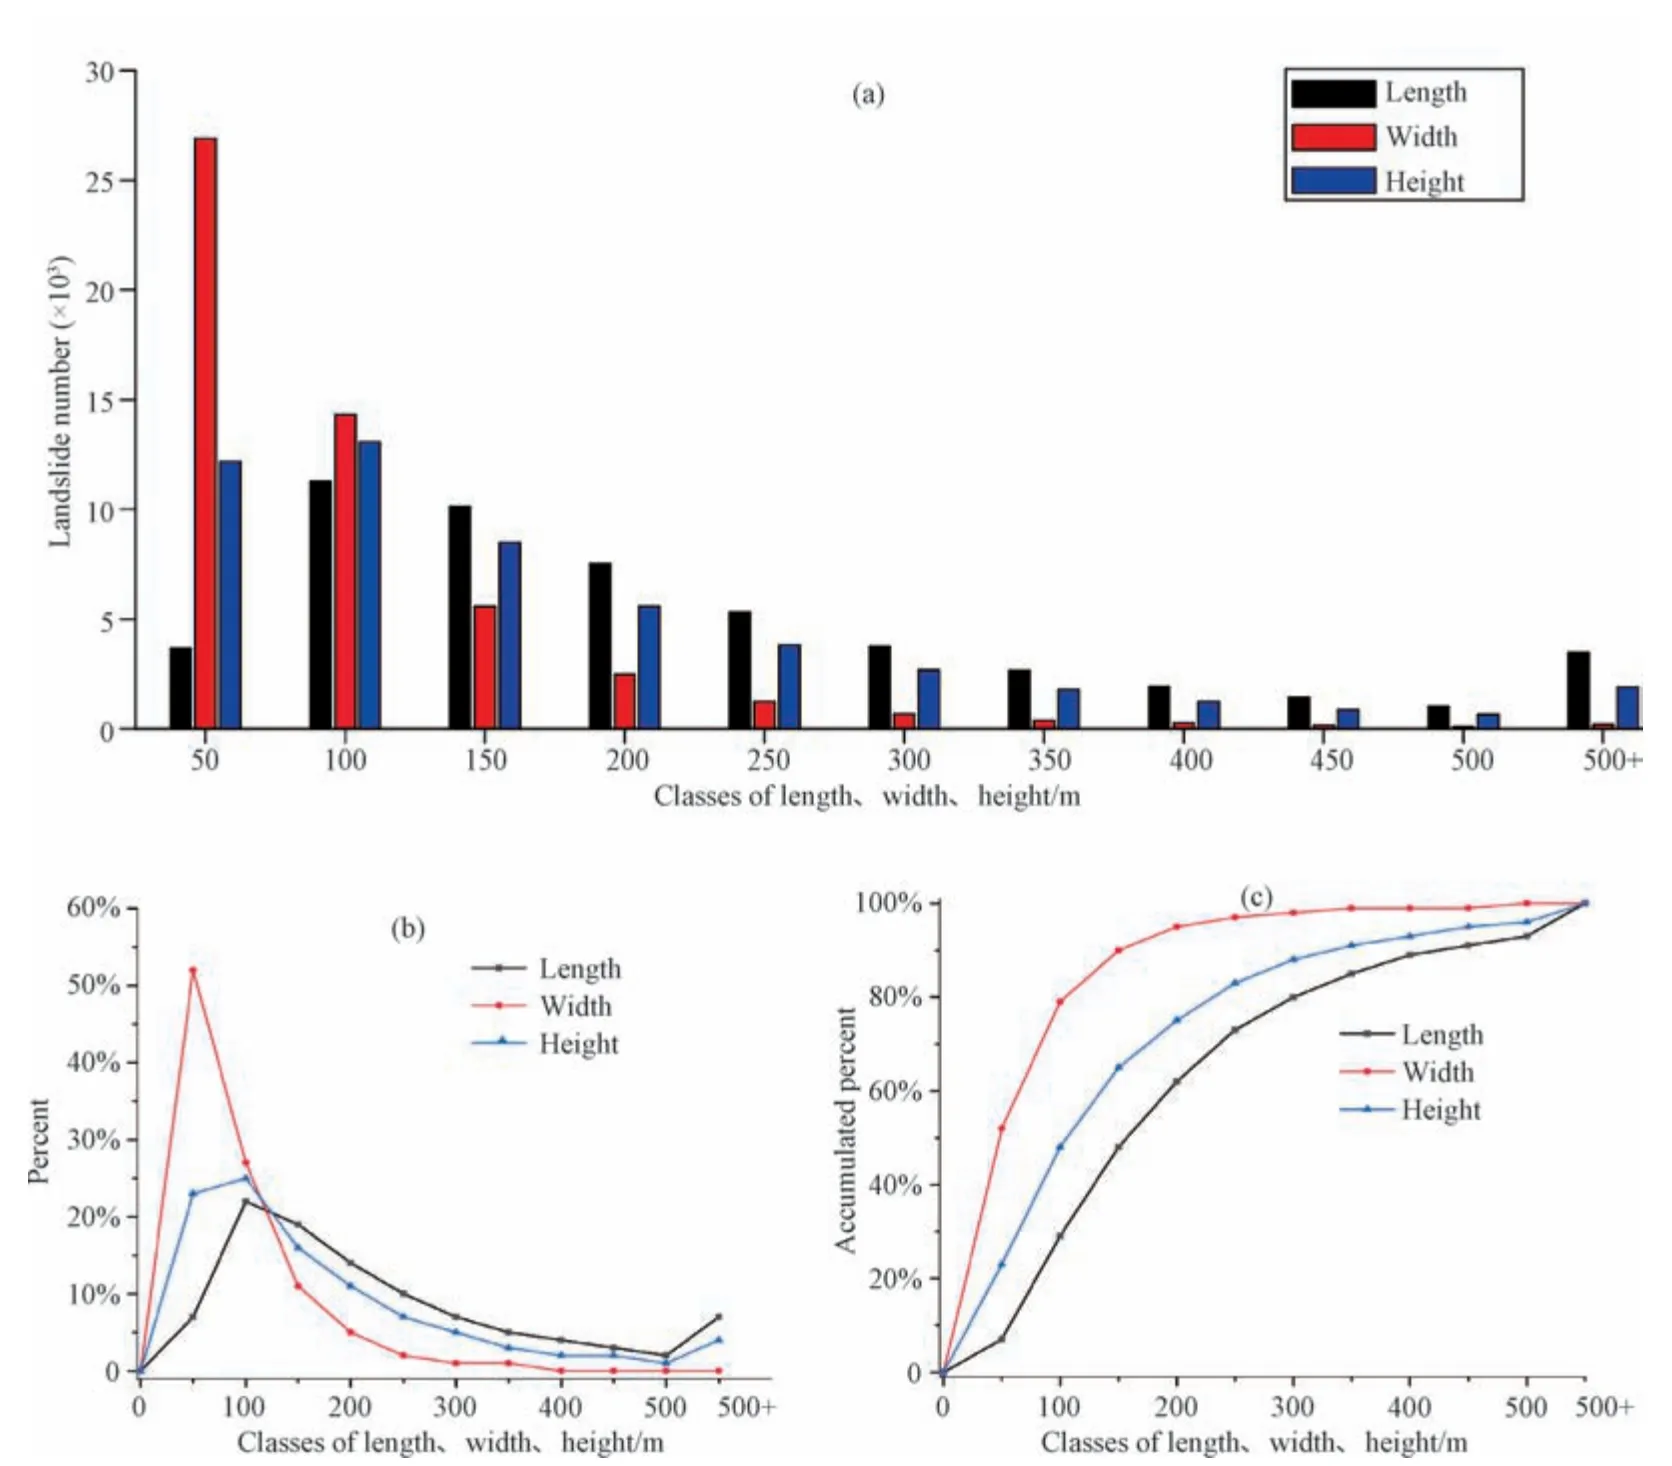
Figure 6 Statistics on length,width,and height of landslides
2.2 Landslide Database Parameter Characteristics
2.2.1 Length,Width and Height of Landslides
The length,width,and height are the basic parameters reflecting the characteristics of a landslide.We partitioned the lengths,widths,and heights of the studied landslides into 50 m intervals and conducted statistical analyses in each interval,as shown in Fig.6.The following conclusions are obtained:
(1)The lengths of landslides in the study area range from 4 to 4 527 m.The range span is large but the lengths are mainly concentrated between 4 and 300 m,with nearly 41 611 landslides,accounting for 79.8% of the total.There are 38 001 landslides between 50 and 300 m,accounting for 72.8% of the total;3 654 with length≤50 m,accounting for 7% of the total;and 10 545 with>200 m,accounting for 20.2% of the total.The average length is 210.7 m.
(2)The widths of landslides in the study area range from 2 to 1 648 m,and the range span is also relatively large but likewise,the widths are mainly concentrated between 2 and 100 m,with nearly 41 208 landslides,accounting for 78.9% of the total.The number of landslides between 10 and~70 m is nearly 33 492,accounting for 64.2% of the total landslides.There are 912 landslides with widths≤10 m,accounting for 1.7% of the total landslides,and 17 805 landslides with widths>100 m,accounting for 34.1% of the total landslides.The average width is 72.8 m.
(3)The height of the landslide is defined as the elevation difference between the foot edge and the scarp top.The statistical results show that the height range is from 2 to 1 532 m and the average value is 152.2 m.Within the range of 0-100 m,the number of landslides is nearly 25 244,accounting for 48.4% of the total;within 100-200 m,the number is nearly 14 056,accounting for 26.9%;and within 200-300 m,the number is nearly 6 485,accounting for 12.4%.
2.2.2 Length-width Ratio
The length-width ratio of a landslide represents the planar shape of the landslide.For the Wenchuan earthquake-induced landslides,the length-width ratio ranges from 0.127 to 125.87,with an average of 2.893.The length-width ratios are divided into classes of 1 and the number of landslides in each class is counted(Fig.7).The length-width ratios are mainly concentrated between 1 and 5,with 39 772 landslides,accounting for 76.2% of the total landslides.Among them,988 have a length-width ratio of≤1,accounting for 1.9%of the total;and 11 458 are>5,accounting for 21.9% of the total.

Figure 7 Statistical chart of length-width ratio of landslides
2.2.3 Elevation Statistics
2.2.3.1 Elevation of Scarp Top and Foot Edge Statistics
The elevations of the scarp tops of all the landslides in the study area range from 636 to 5 055 m,and the elevations of the foot edge range from 528 to 4 731 m.The elevation of each landslide is divided into 100 m intervals,and the scarp top and foot edge of the landslides in each interval were counted separately,as shown in Fig.10.
The elevation ranges from 1 100 m to 2 600 m,in which the number of scarp tops is nearly 37 300,accounting for 71.4% of the total;the 1 400 to 2 000 m range is especially dominant with nearly 18 734 landslides,accounting for 35.9% of the total.Among them,the interval with the greatest number of landslides is from 1 600 to 1 700 m elevation,with 3 371 landslides,accounting for 6.5%;In the elevation range from 1 000 to 2 500 m,the number of landslide foot edges is nearly 38 212,accounting for 73% of the total.The 1 300 to 1 900 m interval is the dominant elevation range for landslide foot edges,with nearly 19 048,accounting for 36.5% of the total.Among them,the range with the greatest number of landslide foot edges is between 1 500 and 1 600 m,with 3 494 landslides,accounting for 6.7% of the total(Fig.8).
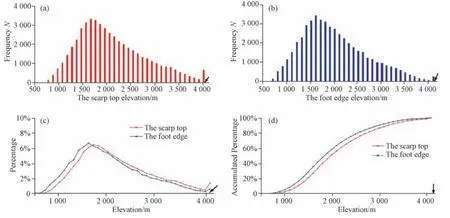
Figure 8 Statistics on elevation of scarp top and foot edge
2.2.3.2 Elevation Differences
The difference between the top elevation of a located slope and the elevation of the scarp top and between the foot edge elevation and the slope's bottom elevation reflect the position of the landslide on the slope.The difference between the foot edge elevation and the bottom elevation of a located slope(river valley)also reflects the flow of the landslide and the valley at the bottom of the slope.The difference between the slope top and scarp top elevations in the study area(ridge-top)ranges from 0 to 2 865 m,and the difference between the foot edge and slope bottom elevations(foot-valley)ranges from 0 to 3 292 m.The values are partitioned into 20 m and 100 m intervals.The difference in each interval is counted separately,as shown in Fig.9.

Figure 9 The statistical of Ridge-Top and Foot-Valley
The number of landslides with a ridge-top difference between 0 to 100 m is nearly 31 424,accounting for 60.2% of the total,of which nearly 14 548 are between 0 and 20 m,accounting for 27.9%.The number of landslides with ridge-top differences between 20 and 40 m is 6 427,accounting for 12.3% of the total;8 733 landslides are between 100 and 200 m,accounting for 16.3%;and 4 815 are between 200 and 300 m,accounting for 9.2%.
The number of landslides with a foot-valley difference between 0 to 100 m is nearly 31 424,accounting for 58.1% of the total,of which 15 839 are between 0 and 20 m,accounting for 30.5%.The number of landslides with a foot-valley difference between 20 and 40 m is nearly 5 304,accounting for 10.2% of the total;8 442 are between 100 and 200 m,accounting for 16.2%;and 5 065 are between 200 and 300 m,accounting for 9.7%.
2.2.4 Ratio of Landslide Height and Ridge-Valley Difference
H/(R-V)value refers to the ratio of the landslide height(H)to the ridge-valley elevation difference(R-V),which represents the proportion of the longitudinal length of the landslide occupying the length of the slope.The ratios range from 0 to 1.The proportion of the longitudinal length of the landslide(L)to the length of the slope increases with the increase of theH/(R-V)value.65.2% of the studied landslides have theH/(R-V)values≤0.5(Fig.10),while 13% of the studied landslides haveH/(R-V)values>0.8.

Figure 10 Height/(Ridge-Valley)
3 DISCUSSION
3.1 Landslide Catalogue and Attribute Parameter Database Characteristics and Comparison with Existing Databases
After the earthquake,most of the co-seismic landslides were catalogued by manual visual interpretation and automatic landslide identification,as shown in Table 1.The catalogue mainly relies on satellite and remote sensing image data.This study mainly uses multi-temporal high-resolution Google Earth image data,combined with post-earthquake high-resolution images,for interpretation.However,there are large discrepancies among the results of previous studies.
For data quantity,the landslides reclassified by Chen Xiaoqing et al.(2009)is the largest,with a total amount of 1 135 725,followed by the results of artificial visual interpretation by Xu Chong et al.(2013)and Xu Chong et al.(2014a),with an amount up to 197 481.Most scholars(Parker R.N.et al.,2011;Li Weile et al.,2013;Li Gen et al.,2014;Xu Chong et al.,2009;Dai F.C.et al.,2011;Gorum T.et al.,2011)have interpreted about 40 000 to 80 000 landslides,which is similar to the 52 194 landslides interpreted in this study.By contrast,the number of landslides automatically identified by Li Zhiguang et al.(2009)is the lowest,about 11 700.
For selected area,the largest total landslides area,3 287 km2is obtained by Wang Feng et al.(2009)using remote sensing automatic identification technology while the smallest area,396 km2,is the result of manual delineation based on automatic identification by Li Gen et al.(2014).The interpretation area of this paper is 1 021 km2,which is similar to Xu Chong(2013);Xu Chong et al.(2013)manual visual interpretation approach yielded an area of 1,161 km2.
The average area estimated from automatic identification by Wang Feng et al.(2009)is the largest,reaching 0.278 km2,followed by the automatic identification of Li Zhiguang et al.(2009),which yielded 0.194 km2.The average landslide area estimated in this paper is 0.02 km2,similar to those of other studies(Xu Chong et al.,2009;Li Weile et al.,2013;Dai F.C.et al.,2011;Qi Shengwen et al.,2010).
Compared with manual visual interpretation,the area obtained by automatic identification is larger,the quantity is smaller,and the average area is larger.According to the analysis,it is difficult to distinguish a single landslide boundary during automatic identification,and it is biased to identify multiple landslides concentrated on one slope as a landslide,but the manual visual interpretation method can distinguish a single landslide boundary from multiple landslides located on the same slope.
Of the 52 194 co-seismic landslides interpreted,31 996 landslides are≤10 000 m2,accounting for 61.3% of the total landslides,of which 22 087 landslides are≤5 000 m2,accounting for 42.3% of the total landslides.There are 1 765 landslides with an area more than 100 000 m2,accounting for only 3.38% of the total landslides.Therefore,although the quantity of landslides induced by the Wenchuan earthquake is large,only small landslides dominate(slope collapse and slip).The number of large landslides,such as the Wangjiayan landslide,the Beichuan middle school landslide,and the Daguangbao landslide,is relatively small.
The Wenchuan earthquake occurred in the Longmenshan area,which is a boundary between the Yangtze Plate and the Songpan-Ganzê Block.The rock was broken under the active thrust nappe structure and extrusion,providing sufficient material conditions for the collapse of the earthquake.Under the strong vibration during the earthquake,the broken rock mass collapsed along the steep slope of the seismic zone.Due to the large relief in the terrain,the fractured rock and soil body has a long collapse distance on the slope.Therefore,among the co-seismic landslides,the landslides with a length-width ratio>2 account for 73.8% of the total,of which the length-width ratio of 49.5% is>3 and the length-width ratio of only 26.2% is≤2.The average length-width ratio is 2.893,and most of them are longitudinal landslides.
The value ofH/(R-V)represents the proportion of the longitudinal length of the landslide occupying the length of the slope.TheH/(R-V)of 65.2% of the co-seismic landslides are≤0.5;most of the co-seismic landslides experienced a partial slip or collapse of the slope(Fig.10).The number of landslides that occupy most of the slope length or run through the entire slope is small,and the bedrock landslides,in a more narrow sense,are less.
Because of the ability of interfering and diffracting on steep ridges and the shoulders on both sides(Meunier P.et al.,2008;Bourdeau C.et al.,2008),seismic waves at these locations may produce significant amplification,ground motion peak acceleration,peak velocity.Besides,co-seismic displacement may also be significantly higher.The steep ridges and shoulders on both sides are often prone to earthquake landslides.This phenomenon has also appeared in several other earthquakes(Dunning S.A.et al.,2007;Owen L.A.et al.,2008).Topographic amplification caused by seismic waves can be observed in the differences between the slope top and scarp top elevations,and between the slope bottom and foot edge elevations,which represent the position of the landslide on the slope.The average differences between the top and bottom elevations of a located slope and between the slope top and scarp top elevations are 437.6 m and 139.6 m,respectively.Therefore,it can be seen that the scarp top point of the landslide is located 1/3 from the slope top in the upper middle portion of the slope.This is consistent with previous research results,suggesting that seismic waves may induce topographic amplification(Yin Yueping,2008;Han Jinliang et al.,2009).
The slope rock and soil body were broken into loose materials after the earthquake and some of them slid into the valley at the bottom of the slope,while others stopped at a certain position on the slope due to the blockage of vegetation.The difference between the foot edge and slope bottom elevations generally reflects the flow of the landslide and the bottom valley.The number of landslides with a slope bottom-foot edge elevation difference greater than 20 m accounts for 69% of the total co-seismic landslides in the study,indicating that most of the landslide debris in the earthquake is also distributed on the slope.This collapsed material may further collapse due to heavy rain and other reasons long after the earthquake,directly threatening the safety of people's life and property under the steep slope and providing sufficient material conditions for future debris flows,which also has great security risks.
3.2 Discussion on Big Landslides Larger than 10 000 m2
This study provides an opportunity to analyze the relationship between the cumulative frequencyN-areaAof the co-seismic landslides based on the relatively complete and detailed interpretation of the landslide database from Google Earth.
Fig.11 shows the relationship between the landslide area and the cumulative frequency,which can be expressed as a quadratic function of the logarithm ofNand the logarithm ofA:lgN(A)=a×lg2A+b×lgA+c,whereNis the cumulative frequency of landslides per 1 000 m2interval;a,b,and c are constant.The range ofAis 2×10³-2×10⁵m2,where the number of landslides is 47 495,accounting for 91% of the total.The fitting range does not include landslides whose area is≤103m2and>2×10⁵m2.Due to problems such as image resolution,the interpretation may be incomplete when the area is less than 103m2.Besides,the quantity of landslides with area>2×10⁵m2is small.
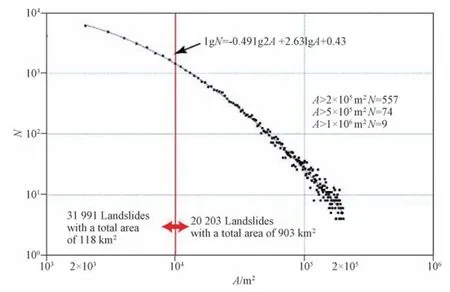
Figure 11 Relation between the cumulative landslide quantity and the landslide area
The amount of landslides triggered by theMW7.9 Wenchuan earthquake is 52 194,and the total area affected by landslides is 1 021 km2.Among them,there are 20 203 landslides with an area larger than 10 000 m2,accounting for 38.7% of the total.The area affected by these landslides is 903 km2,accounting for 88% of the total area affected.The area affected by landslides less than 10 000 m2,which makes up 61.3% of the total quantity,only accounts for 12% of the total affected area,as shown in the Fig.12.
Consistent with the distribution law of all landslides interpreted,landslides with an area greater than 10 000 m2are mainly distributed within 120 km between Yingxiu and Beichuan,and within 30 km of the hanging wall of the YBF.Therefore,the distribution of landslides with an area greater than 10 000 m2follows the distribution law of all landslides(Fig.1 and Fig.3).A small landslide(area<10 000 m2)has a small contribution to the total landslides area,an interpreted large landslide(area>10 000 m2)can basically represent the whole landslide(Fig.12).Due to the image resolution and several other reasons,the landslides with small areas in the interpretation have a very small contribution to the total landslides area and thus will not affect the distribution rule of the overall landslide.
3.3 Discussion on Regional Landslide Volume
At present,the regional landslide volume is generally obtained by collecting seismic landslide sample points,measuring the landslide area and landslide volume,and then establishing a power-law relationship between the volume and area of a landslide.The proportional indexγand the intercept α are constant(Parker R.N.et al.,2011;Li Gen et al.,2014).For bedrock landslides,γis generally 1.3-1.6.
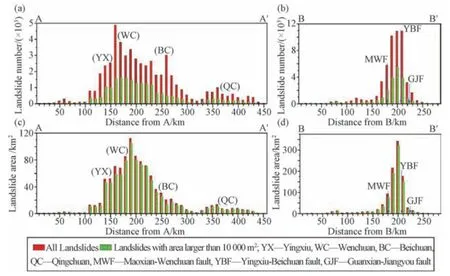
Figure 12 The comparison of all landslides and landslides larger than 10 000 m2 in quantity and area
Generally,the area which is used to calculate the regional landslide volume in the power-law relationship is the area referred to as those affected by each landslide interpreted from the remote sensing image;however,most of the co-seismic landslides are collapses(generalized landslide),which consist of three parts:source area,transport area,and accumulation area(Figs.13,14,15).Although the damage in the transport area is very serious,there is no material deficit in it and only a small quantity of landslide material remains.Therefore,the area of the transport area cannot be counted when calculating the scale of the landslide using the area-volume power-law formula.Moreover,under normal circumstances,the transport area will basically“disappear”in a few years and restore vegetation(Fig.14).
Ideally,the volume of the material in the accumulation zone is equal to the volume of the material in the source zone.When the calculation of total landslide is performed,the aforementioned two volumes cannot be calculated repeatedly.If the landslide volume is calculated from an area influenced by a landslide—(interpreted from remote sensing images and based on the area-volume power-law relationship)—and the areaAis too large,then the estimated regional landslide volume may be much larger than the true landslide volume.
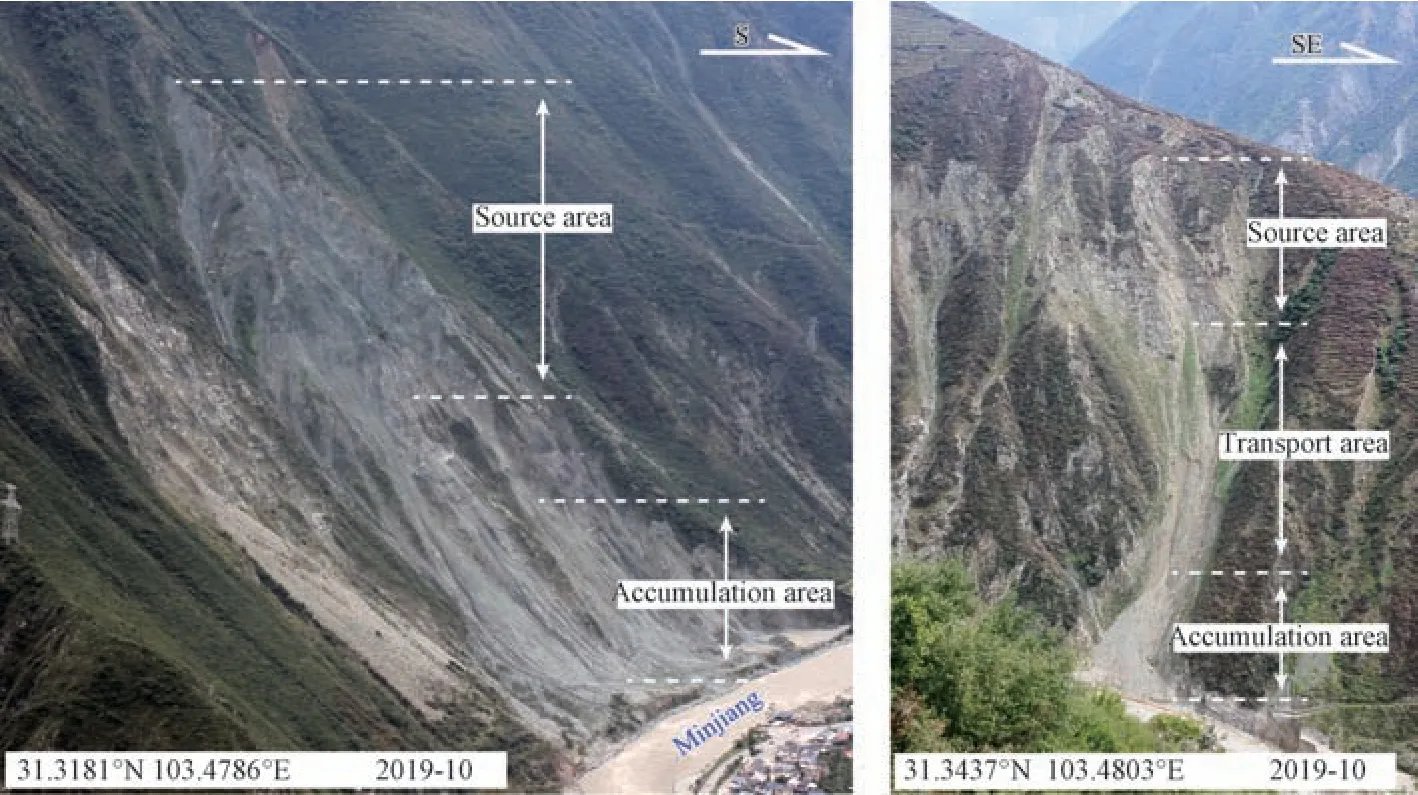
Figure 13 Photos of landslides 10 years after the earthquake
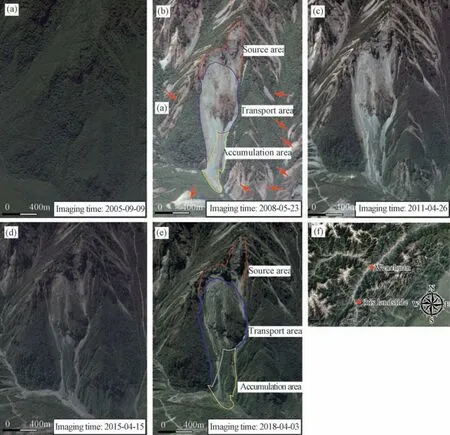
Figure 14 Evolution map of landslide source area,transport area,and accumulation area on Multi-stage images from Google Earth
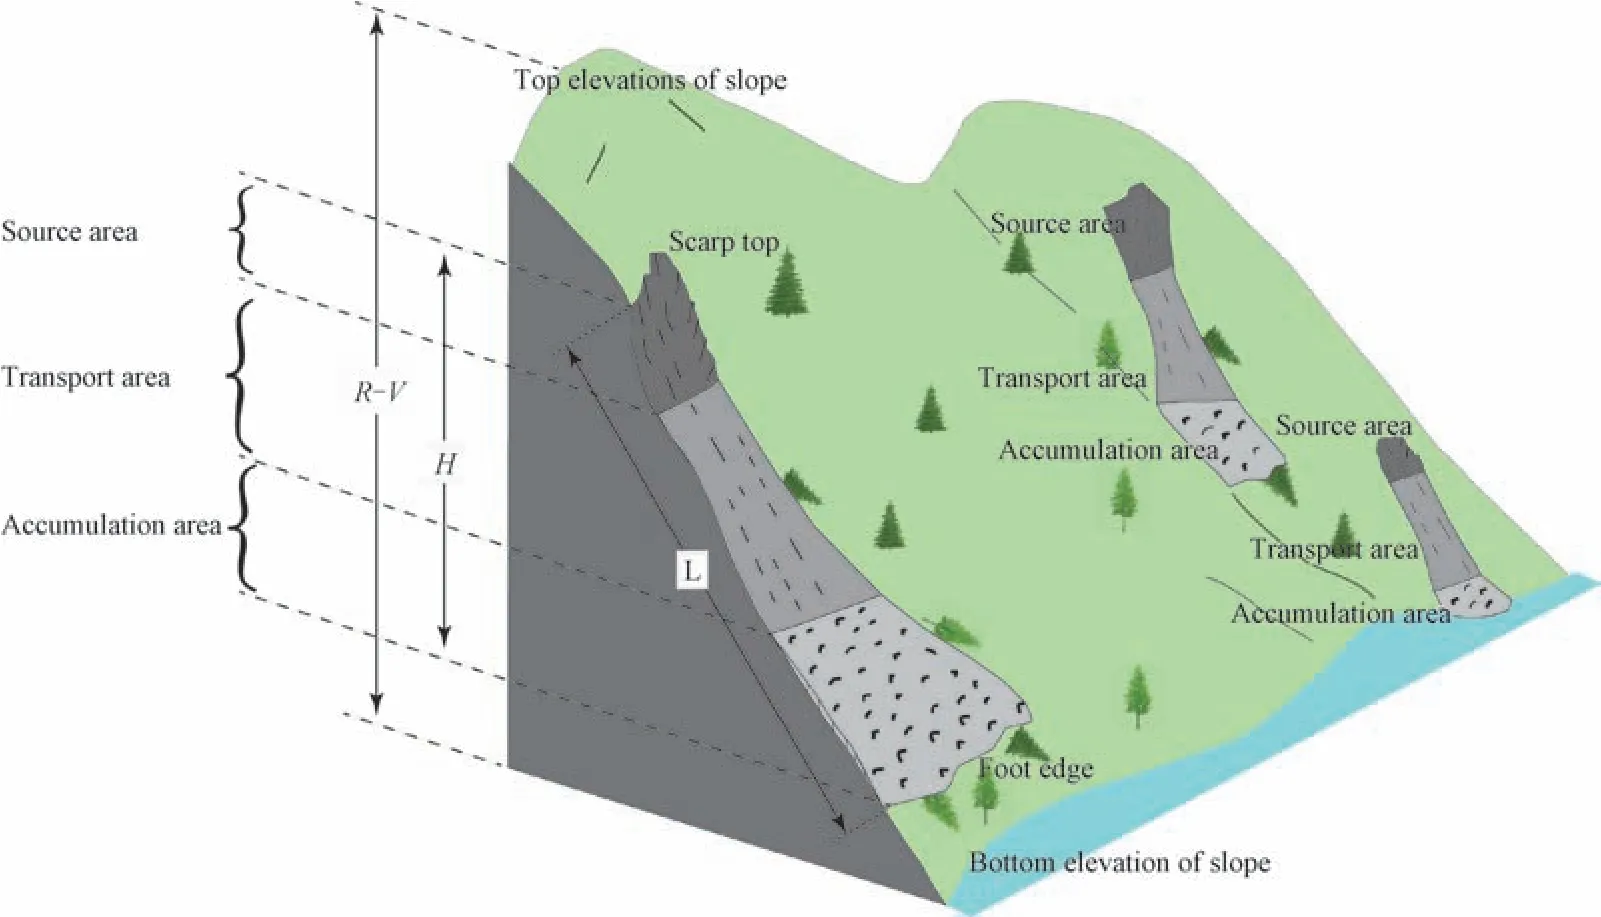
Figure 15 Collapse model in high mountains and deep valleys
4 CONCLUSIONS
A detailed and complete manual visual interpretation of the landslides in the Wenchuan earthquake zone was conducted using Google Earth high-resolution images pre-and postearthquake.We interpreted 52 194 co-seismic landslides with a total landslides area of 1 021 km2and established a co-seismic landslide database,which includes the length and width of each landslide,the elevation of the scarp top and foot edge of each landslide,and the top and bottom elevations of the slope where each landslide is located.Through the statistical analysis of these parameters,the following main conclusions are obtained:
(1)The spatial distribution of co-seismic landslides induced by the Wenchuan earthquake is extremely uneven.These landslides,which account for 81.1% of the total landslide impact area and 76.9% of the total landslides,occur within the IX-degree zone and are mainly distributed within 120 km between Yingxiu and Beichuan,and within 30 km of the hanging wall of the Yingxiu-Beichuan fault.They are obviously controlled by fault distribution,topography,and ground motion.
(2)A large number of small landslides contribute less to the total landslides area of an earthquake-induced landslide.The landslides with an area less than 10 000 m2,accounting for 61.3% of the total landslides,only accounts for 12% of the total affected area.Thus,due to the image resolution and several other reasons,the landslides with small areas may be recognized in interpretation to have a very small contribution to the total landslides area and will not affect the distribution rule of the overall landslide.The scarp top of the landslide is mainly located on the upper part of the slope,the foot edge of most landslide debris has a certain distance from the bottom of the slope,and the longitudinal length of the landslide occupies a small proportion of the entire length of the slope.
(3)The co-seismic landslides induced by Wenchuan earthquake are dominated by bedrock collapse.Due to the influence of terrain,the bedrock collapse usually consists of three parts:source area,transport area,and accumulation area.Actually,landslides only occur in the source area.If the landslide volume is calculated from the area of influence for each landslide interpreted from the remote sensing image and the area A is too high,based on the area-volume power-law relationship,the resulting regional landslide volume may be much larger than the true landslide volume.
 Earthquake Research Advances2020年1期
- Earthquake Research Advances的其它文章
- Spatial Distribution of Seismic Landslides in the Areas of 1927 Gulang M8.0 Earthquake
- Distribution of Landslides in Baoshan City,Yunnan Province,China1
- Hazard Assessment of Co-seismic Landslides Based on Information Value Method:A Case in 2018 MW6.6 Hokkaido Earthquake,Japan
- Discrete Element Modeling of Tangjiagou Two-Branch Rock Avalanche Triggered by the 2013 Lushan MW 6.6 Earthquake,China
- A Discrete Element Analysis of the Sliding Friction Heat in High-Speed and Long-Runout Landslides
- A Statistical Estimation Model for the Impact Force of Dry Granular Flow Against Rigid Barrier1
