Removal of Mercury (Hg(II)) from Seaweed Extracts by Electrodialysis and Process Optimization Using Response Surface Methodology
SUN Jiuyi, SU Xin, LIU Zhen, LIU Junlan, MA Zhun, *,SUN Yongchao, GAO Xueli, and GAO Jun
Removal of Mercury (Hg(II)) from Seaweed Extracts by Electrodialysis and Process Optimization Using Response Surface Methodology
SUN Jiuyi1), SU Xin1), LIU Zhen1), LIU Junlan1), MA Zhun1), *,SUN Yongchao2), GAO Xueli2), and GAO Jun1)
1)College of Chemical and Environmental Engineering, Shandong University of Science and Technology,Qingdao 266590, China 2) Key Laboratory of Marine Chemistry Theory and Technology, Ministry of Education; College of Chemistry and Chemical Engineering, Ocean University of China, Qingdao 266100, China
In this work, response surface methodology (RSM) was employed to model and optimize electrodialysis process for mercury (Hg(II)) removal from seaweed extracts. Box-Behnken design (BBD) was utilized to evaluate the effects and the interaction of influential variables such as operating voltage, influent flow rate, initial concentration of Hg(II) on the removal rate of Hg(II). The developed regression model for removal rate response was validated by analysis of variance, and presented a good agreement of the experimental data with the quadratic equation with high value coefficient of determination value (2= 0.9913,Adj2= 0.9678). The optimum operating parameters were determined as 7.17V operating voltage, 72.54Lh−1influent flow rate and 5.04mgL−1initial concentration of mercury. Hg(II) removal rate of 76.45% was acquired under the optimum conditions, which showed good agreement with model-predicted (75.81%) result. The results revealed that electrodialysis can be considered as a promising strategy for removal of Hg(II) from seaweed extracts.
electrodialysis;seaweed extracts; mercury removal;response surface methodology; Box-Behnken design
1 Introduction
Seaweed is a rich marine resource, and its extracts have been applied widely for the numerous functions (Agregán, 2018; Suraiya, 2018). Seaweed Extracts can promote the growth of plants and strengthen the health of soil in agricultural applications (Battacharyya, 2015; Xue, 2019), and they have anti-tumor and anti- cancer effects in medical field (Pedra, 2017; Jiang and shi, 2018). As one of the pollutants of heavy metal, mercury has the characteristics of high toxicity, difficulty in the degradation and accumulation (Wu, 2018; Liu, 2019). Also it can be enriched through the food chain, which can endanger human health and pollute the environment (Yang, 2018). However, the enrichment of certain mercury ions in seaweed extracts can significantly reduce the functional effects and even cause damage to the human body (Chen, 2018;Fernandes, 2018). Therefore, removal of heavy metal mercury from seaweed extracts has become an urgent problem to be solved.
There are many studies on conventional methods for treating mercury-containing seaweed extracts, such as adsorption, ion exchange and membrane technology (Liu, 2018; Morsi, 2018). The major shortcomings of conventional technologies including ion exchange and adsorption are production of large amounts of toxic sludge as secondary pollution and lower removal efficiency for trace mercury contaminants. Liu. studied the adsorption of mercury from aqueous solution by regenerated activated carbon produced from depleted mercury-containing catalyst by microwave-assisted decontamination. The results show that the minimum residual mercury concentration is 3.5mgkg−1under the optimal treatment conditions of 700w for 20min (Liu., 2018);Liu. studied the recyclable CuS sorbent with large mercury adsorption capacity in the presence of SO2from non-ferrous metal smelting flue gas. The result is that CuS has a maximum adsorption of mercury of 50.17mgg−1at 50℃ with 50% breakthrough threshold(Liu., 2019);Adrian Oehmen used the ion exchange membrane bioreactor to remove mercury and achieved a mercury removal rate of over 98% through the IEMB process (Oehmen., 2014). The mercury removal rate is high and the removal ability is relatively strong in the above methods, but some trace amounts of mercury are easily left, so the removal effects on trace mercury are not obvious. Membrane technologies involving reverse osmosis (RO), nanofiltration (NF), and electrodialysis (ED) are potential technologies compared with conventional methods for removing Hg(II) from seaweed extracts. Among these membrane processes, the principle of electrodialysis is the transport of ions through ion-exchange membranes under the driving force of electrical potential difference, and it has been considered as superior method for Hg(II) removal due to its selective desalination, low energy consumption, environment friendliness and applicability to decentralized system (Sadyrbaeva, 2016; Cui., 2017; Frioui and Oumeddour, 2017; Babilas and Dydo, 2018).
Response surface methodology, which is regarded as a hybrid of mathematical and statistical techniques, has been widely used as a vital tool to investigate, optimize and model the performance of complex systems with limited number of experiments. Box-Behnken design (BBD), one of the basic RSM models made up of seventeen experiments with five center points and two replicates, which makes it popular in optimizing operational parameters (Tripathi., 2009; Dahaghin, 2017). RSM has been utilized successfully in designing experiments, building regression models and confirming optimal operating parameters in chemical engineering, material preparation, biological and environmental experimental processes (Govindaswamy, 2001; Gfiveng and Karabacakoglu, 2005; Ghorbani, 2008; Su, 2013). However, to the best of our knowledge, there is few literature to optimize and model the interactive effects of operating parameters on Hg(II) removal by electrodialysis process using RSM from seaweed extracts.
The objectives of this study were to evaluate the feasibility of ED process for removal of Hg(II) from seaweed extracts by applying response surface methodology based on Box-Behnken design (BBD) using Design Expert software (Version 8.0, Stat. Ease. Inc, United States). The effects and interactions of three operating parameters involving operating voltage, influent flow rate and initial concentration of Hg(II) on the removal rate of Hg(II) were investigated at different levels. The second order quadratic regression models for the response were developed, and the accuracy of the model and the significance of critical parameters were validated using the analysis of variance (ANOVA).
2 Materials and Methods
2.1 Materials
The seaweed extract is derived from brown algae. The membranes used for ED stack were JCM-II-05 and JAM- II-05 (Beijing Tingrun Membrane Technology Co., Ltd., China). JCM-II-05 was used as cation exchange membrane (CEM) and JAM-II-05 was used as anion exchange membrane (AEM). Their properties are listed in Table 1. All the chemicals used for experiments were of analytical grade. Deionized water was used throughout all experiments.

Table 1 Properties of ion exchange membrane used in ED process
Note: The data are collected from the product brochure provided by the company.

Fig.1 Schematic diagram of the experimental device.
2.2 Experimental Setup
A bench scale of electrodialysis system TRBP3010-I unit (Beijing Tingrun Membrane Technology Co., Ltd., China) was utilized to investigate the permeation of Hg(II), and 15pairs of anion and cation exchange membranes with the effective membrane area of 0.0015m2(manufactured by Beijing Tingrun Membrane Technology Co., Ltd., China) was utilized in the electrodialysis system. The ED system consisted of a stack, a DC power supply (PS-305DM, Longwei Struments (HK) Co., Ltd.) and centrifugal pumps (CXB-30, Wenzhou Erle Pump Co., Ltd.).The stack was composed of diluted, concentrated and electrode compartments, respectively. Compartments were segregated by the 0.85mm-thick polypropylene gaskets and spacers. Each compartment was connected to an isolate external 4L acrylic container, allowing for recirculating by centrifugal pumps. Initial components and concentration of diluted and concentrated compartments were the same. The voltage and current across the stack were recorded directly by a DC power supply through titanium coated with ruthenium electrode and stainless-steel electrode. The research was carried out with different operating parameters such as influent flow rate (30, 50, 70 and 90Lh−1), operating voltage (3, 5, 7 and 9V) and initial concentration of mercury (3, 5 and 7mgL−1). The schematic diagram of electrodialysis process is presented in Fig.1.
2.3 Analytical Methods
The feed solution conductivity was measured with a handheld device (DDC-307, Shanghai INESA & Scientific Instrument Co., Ltd., China). Hg(II) concentration was analyzed by flame atomic absorption spectrophotometry (TAS-986F, Beijing Purkinje General Instrument Co., Ltd., China). The effects of operating voltage, influent flow rate, and initial concentration of Hg(II) on ED process were investigated in these experiments by RSM.
The removal rate refers to the percentage of difference between initial and final Hg(II) concentration. The removal rate reflects the performance of the ion exchange membrane. And the removal rate is defined as:

whereis the removal rate,0andCare Hg(II) concentration of 0min andmin, respectively.
3 Results and Discussion
3.1 Single Factor Experiments
3.1.1 Determination of the range of operating voltage
Each pair of ion exchange membranes has a maximum voltage that membranes can withstand, and the maximum voltage that the membrane device can withstand is the sum of the voltages experienced by each pair of ion exchange membranes (Li., 2018). If the voltage is too small, the removal rate of mercury will decrease, which will affect the effluent quality. Also excessive voltage will generate large energy consumption and affect the service life of the ion exchange membrane. Therefore, it is very important to select the appropriate voltage within the range of voltage that the membranes can withstand.
The effluent concentration of mercury at different operating voltages is shown in Fig.2. It indicates as the operating voltage increases, the effluent concentration of mercury decreases first and then increases. When the operating voltage is greater than 7V, the effluent concentration of mercury begins to increase, so the optimum operating voltage range is selected to be 5-9V.
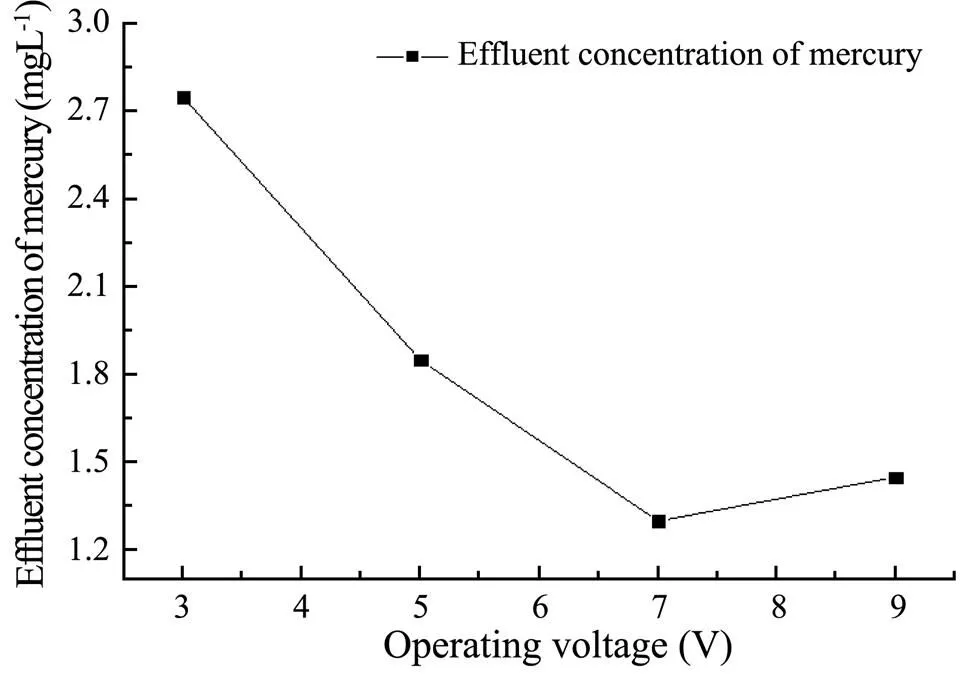
Fig.2 The influence of operating voltage on effluent concentration of Hg(II).
Under the condition of meeting the quality of the effluent, the greater the influent flow rate, the stronger the ability to treat water, which will reduce energy consumption and produce better economic benefits. However, the instability of the ion migration process in the electrodialysis unit will occur if the water inflow rate is excessive, which not only affects the quality but also its service life. The reason is that the ion exchange membrane has a certain degree of toughness and the electrodialysis membrane will be damaged by the strong impact from the excessive flow rate (Wang., 2018; Yang., 2018). Therefore, it’s essential to choose the appropriate influent flow rate for the stable operation of electrodialysis system.
The effluent concentration of mercury under different influent flow rate is shown in Fig.3. It indicates as the influent flow rate increases, the effluent concentration of mercury in the outlet freshwater decreases first and then increases. When the influent flow rate is 30-70Lh−1, the effluent concentration of mercury continuously decreases. And when the influent flow rate is greater than 70Lh−1, the effluent concentration of mercury begins to increase. Therefore, 50-90Lh−1is selected as the optimal range of influent flow rate.

Fig.3 The influence of influent flow rate on effluent concentration of Hg(II).
3.1.2 Determination of the initial concentration of mercury
The effluent concentration of mercury at different concentrations of the liquid is shown in Fig.4. It indicates that as the initial concentration of mercury increases, the effluent concentration of mercury decreases first and then increases. When the initial concentration of mercury is 3-5mgL−1, the effluent concentration of mercury continuously decreases. Afterwards when the initial concentration of mercury is greater than 5mgL−1, then the effluent concentration of mercury begins to increase (Belkada, 2018). Therefore, 3-7mgL−1is selected to be the optimum range of the initial concentration of mercury.
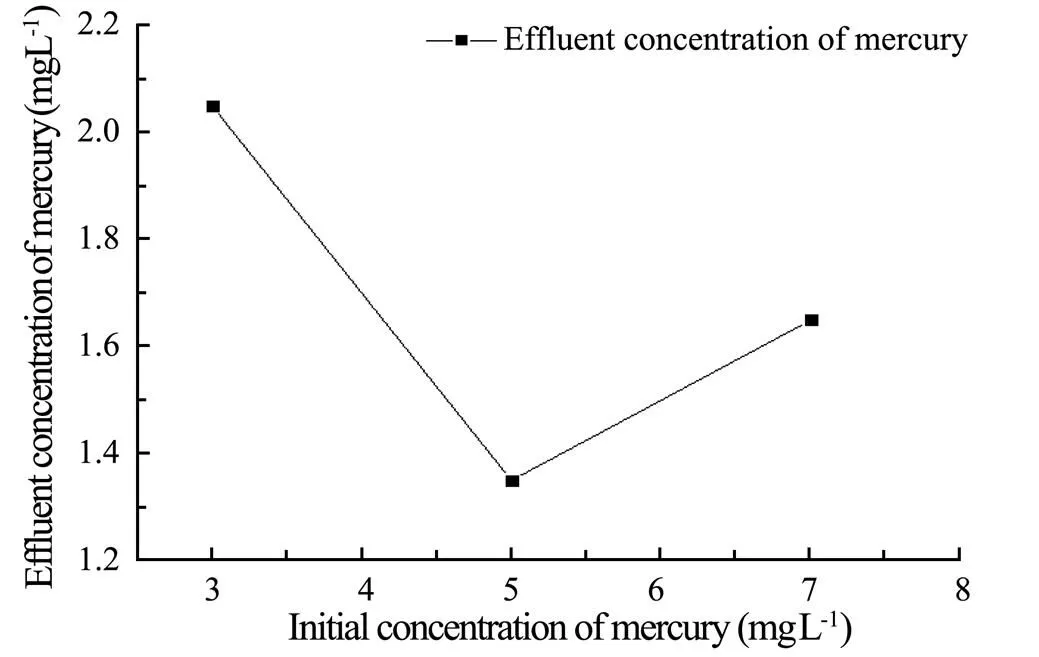
Fig.4 The influence of initial concentration of mercury on effluent concentration of Hg(II).
3.2 Response Surface Box-Behnken Analysis
3.2.1 Model fitting
In this experiment, the operating voltage (A), the initial concentration of Hg(II) (B), and the influent flow rate (C) were selected as the investigation factors, the removal rate was used as the evaluation index, and the method of Box-Behnken response surface was used to optimize the process. The process parameters and levels of the BBD experimental domain of design are presented in Table 2. The results of BBD experiments for the influence of three independent process parameters on the removal rate of Hg(II) are shown in Table 3. It indicated that the removal rate vary significantly relying on the values of the influential factors.

Table 2 Levels of various factors in BBD design
The relationship between the independent factors and response can be described by a second order quadratic model. The regression model widely used for developing a response surface method with experimental data is established to express the response in terms of factors as follows (Tripathi., 2009; Tak., 2015; Shen, 2017):

Table 3 Box-Behnken design matrix for three variables together with the observed response
whereis the predicted response,0is the constant coefficient,β,βandβare the linear, quadratic and interaction constant coefficients, respectively.X(= 1, 2, 3) andX(= 1, 2, 3) represent the coded independent factors.
The Design Expert Software (version 8.0) is used to perform the multivariate regression fitting on the experimental data to obtain quadratic regression model of the removal ratefor the operating voltage (A), the initial concentration of mercury (B), and the influent flow rate (C):

According to Table 4, the value ofof the model is less than 0.001, which indicates that the model is extremely significant. The value ofdue to lack of fit is greater than 0.05, revealing that the lack of fit of model is non-significant, which means the model selection is appropriate and the experimental error is smaller (Rhilassi, 2017). What’s more,the predicted fit (2) of the model is 0.9943 and the adjusted fit (2) is 0.9678, indicating that the change of the response value containing 96.78% is derived from the selected variable. And the difference between the adjusted fit and the predicted fit is small (Banerjee, 2018), which shows that the model is well correlated with all the experimental data (Dahaghin, 2017). Also, it can be seen from Fig.4 that the actual value is roughly distributed on the prediction curve, which shows that the actual value is approximately equal to the predicted value obtained by the model with smaller error (Tak, 2015). Therefore, within the allowable range of error, the regression equation can better explain the true relationship between each factor and the removal rate of mercury, so the model can be used to analyze and predict the removal rate of mercury.
As can be seen from Table 4, when A, C, A2, B2, and C2reached extremely significant levels (<0.001), the other parameters were not significantly affected, which was roughly consistent with the predicted situation. At the same time, in the selected experimental range, it can be inferred from the value ofandthat the influence of three factors on the removal rate of mercury is A>C>B and the effect of interaction is not significant (Sobolczyk- Bednarek and Łaba, 2018).

Table 4 Analysis of variance (ANOVA) for the regressive model
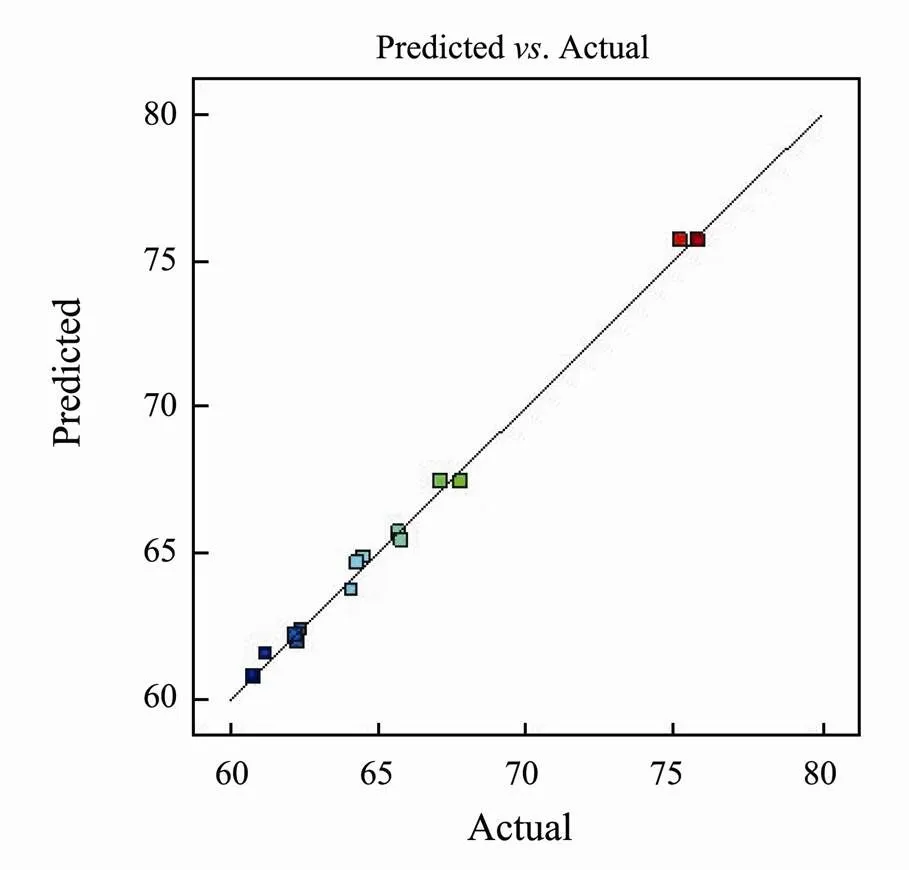
Fig.5 Predicted response versus actual response.
3.2.2 Influence of variables and optimization
Using Design-Expert 8.0 software for analysis, the curve of response surface and its contour map of various factors and interactions on the removal rate of mercury can be obtained. From the Figs.6, 7 and 8, the effect of the interaction of various factors on the removal rate of mercury can be analyzed, and the level of optimal factor is determined.
The interaction of operating voltage and influent flow rate on removal rate of mercury is shown in Fig.6. It shows that when the initial concentration of mercury is at an intermediate value, with the increase of operating voltage, the removal rate of mercury increases first and then decreases (Sahu and Mahapatra, 2018), which is roughly similar to the trend of parabolic. And as the influent flow rate increases, the magnitude of the change also increases first and then decreases. The change is most obvious when the influent flow rate is 70Lh−1. It shows that the change of other factors will cause a significant change in the response value under the optimal conditions, which is consistent with the actual situation. The reason for the above phenomenon may be that as the operating voltage increases, the ion migration rate increases for a certain period of time, so the removal rate of mercury increases. However, due to the bearing capacity and polarization of the ion exchange membrane, the excessive operating voltage will reduce the removal rate of mercury. With the increase of the influent flow rate, the removal rate of mercury increases first and then decreases, which shows a parabolic trend. And as the operating voltage increases, the magnitude of the change also increases first and then decreases. The trend is the most obvious when the operating voltage is 7V, the reason is that the ions cannot migrate to the two poles sufficiently if the flow rate is too high, and then also cannot form an ideal turbulent flow in the separator if the flow rate is too low, which causes the reduction in the removal efficiency. Therefore, as the flow rate increases, the removal rate of mercury increases first and then decreases.

Fig.6 Three-dimensional surface and contour plots for the effect of operating voltage and influent flow rate on removal rate.
The interaction of operating voltage and initial concentration of mercury on removal rate of mercury is shown in Fig.7. It can be seen from Fig.7 that when the influent flow rate is at the intermediate value, as the initial concentration of mercury increases, the removal rate of mercury shows a parabolic trend of increasing first and then decreasing. The range of change is the most obvious when the operating voltage is 7V, the reason is that the increase of the initial concentration of mercury solution leads to an increase in the driving force of the concentration difference, and the resistance during the ion migration process is reduced, which is favorable for ion migration. Therefore, the removal rate of mercury increases. However, in the ion diffusion process, due to the concentration difference between the solution in the concentrating chamber and the desalination chamber, and as the initial concentration of mercury increases, the concentration difference also increases. Due to the existence of concentration difference, the ions will spontaneously migrate from the concentrating chamber to the desalination chamber, and as the concentration difference increases, the migration rate and thus migration increase, which results in an increase in the ion concentration of the deionization chamber and a decrease in the removal rate of mercury (Noguchi., 2018).

Fig.7 Three-dimensional surface and contour plots for the effect of operating voltage and initial concentration of mercury on removal rate.
The interaction of initial concentration of mercury and influent flow rate on removal rate of mercury is shown in Fig.8. It can be seen from Fig.8, when the operating voltage is at the intermediate value, the initial concentration of mercury and the influent flow rate is parabolic with the removal rate of mercury. And the parabolic relationship is the most obvious when the influent flow rate is 70Lh−1and the initial concentration of mercury is 5mgL−1.
The dense contour line indicates that the interaction is significant and the sparse contour line represents that the interaction is not significant(Wang and Huang, 2010). It can be seen from the contour map that the contour lines of interaction between various factors and other factors are sparse, showing that the interaction exists but the significance is not high, which is consistent with the results of the analysis of variance.
According to the test and design of Box-Behnken response surface, the quadratic regression equation of removal rate of mercury can be solved, and optimized condition is obtained the operating voltage as 7.17V, the initial concentration of mercury is 5.04mgL−1, and the influent flow rate is 72.54Lh−1, the removal rate of mercury can reach 75.81%.
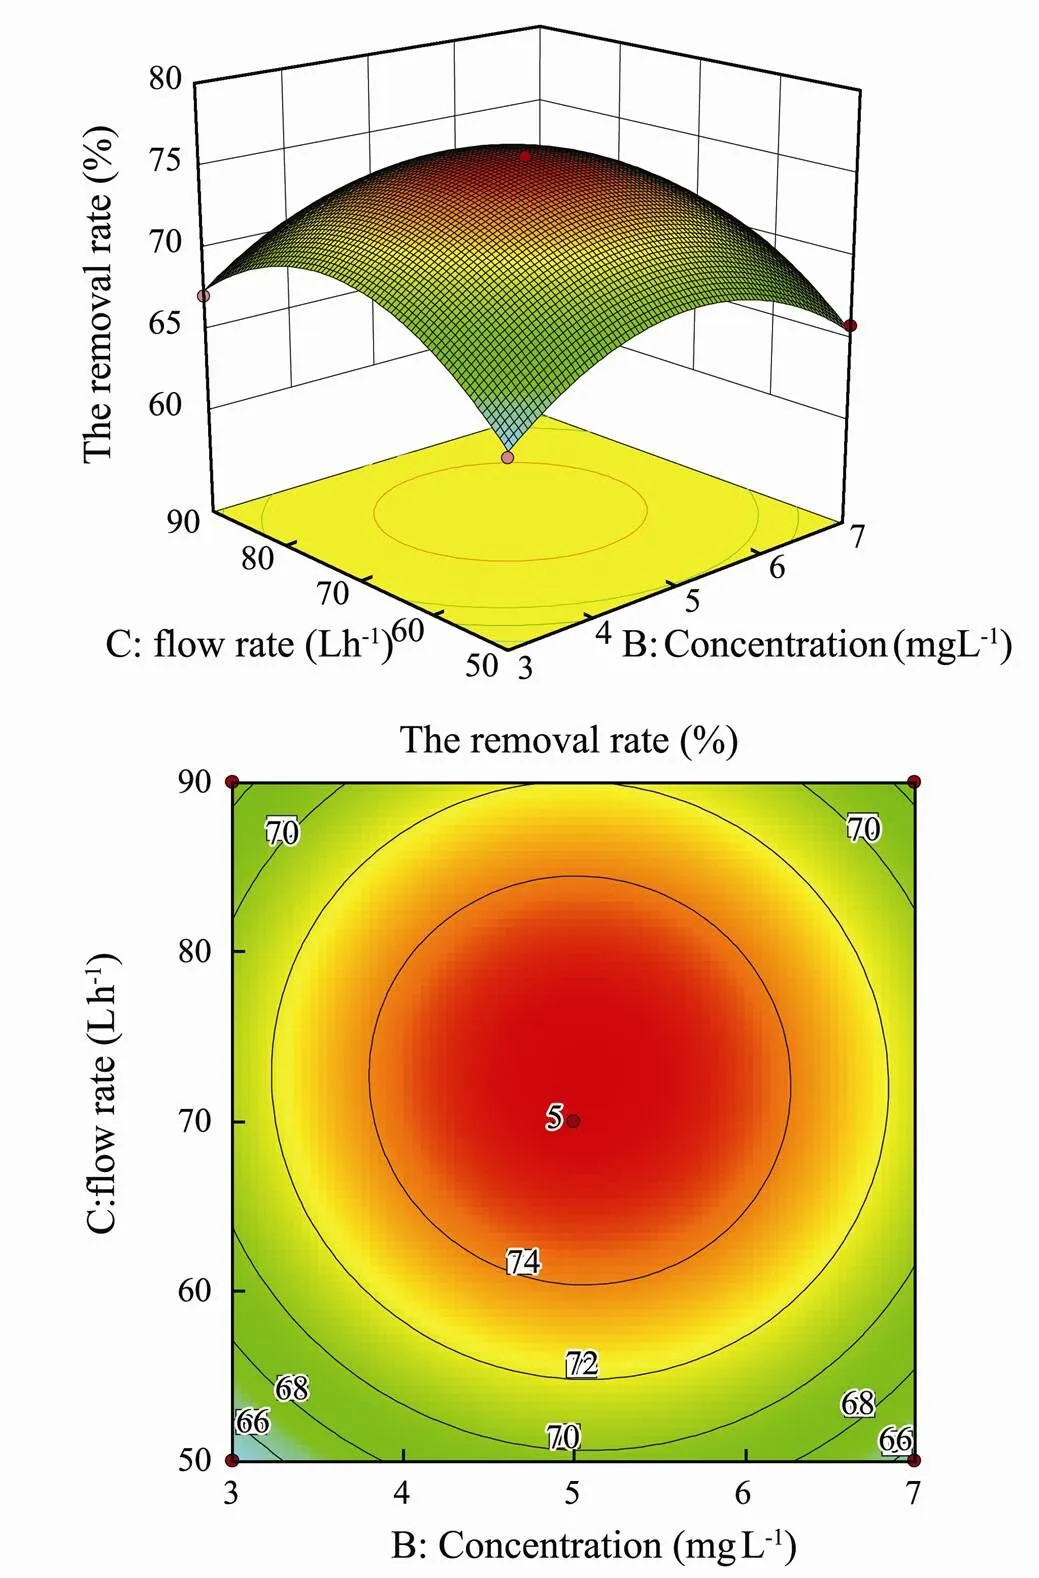
Fig.8 Three-dimensional surface and contour maps for the effects of initial concentration of mercury and influent flow rate on removal rate.
In order to verify the results of the optimization, it is necessary to verify the predicted optimized process conditions. According to this process condition to remove mercury in seaweed extracts, and three parallel experiments were carried out (Shen, 2017). That the actual average value of removal rate of mercury is 76.45%. It is close to the theoretical value, which indicates that the model and the optimized results are highly reliable.
4 Conclusions
This study aimed to model and optimize the ED process for Hg(II) removal from seaweed extracts based on Box-Behnken design using response surface methodology. Interactive effect of process variables including operating voltage, influent flow rate and initial concentration of Hg(II) were investigated to optimize removal rate of Hg(II) for ED process.The second order quadratic regression model for removal rate of Hg(II) was statistically verified by ANOVA and showed a high value coefficient of determination value to evaluate the response, with the predicted fit (2=0.9943) and the adjusted fit (Adj2= 0.9678). Moreover, operating voltage and influent flow rate has the most significant influence on removal rate of Hg(II). The optimal operating parameters for maximum removal rate of Hg(II) (76.45%) were acquired as follows: initial concentration of Hg(II) of 5.04mgL−1, operating voltage of 7.17V and influent flow rate of 72.54Lh−1. These results indicated that there was a good feasibility of ED process using response surface methodology for Hg(II) removal from seaweed extracts.
Acknowledgements
This work was financially supported by the Key Research Project of Shandong Province (No. 2017CXGC 1004), the National Natural Science Foundation of China (No. 21878178), the Shandong Science and Technology Development Plan (No. 2018GGX107001) and the Young Tai- shan Scholars Program of Shandong Province.
Agregán, R., Franco, D., and Carballo, J., 2018. Shelf life study of healthy pork liver pâté with added seaweed extracts from,and., 112: 400-411, DOI: 10. 1016/j.foodres.2018.06.063.
Babilas, D., and Dydo, P., 2018. Selective zinc recovery from electroplating wastewaters by electrodialysis enhanced with complex formation., 192: 419-428, DOI:10.1016/j.seppur.2017.10.013.
Banerjee, A., 2018. PVA modified filled copolymer membranes for pervaporative dehydration of acetic acid-systematic optimization of synthesis and process parameters with response surface methodology., 549: 84- 100, DOI: 10.1016/j.memsci.2017.11.056.
Battacharyya, D., Babgohari, M. Z., and Rathor, P., 2015. Seaweed extracts as biostimulants in horticulture., 196: 39-48, DOI: 10.1016/j.scienta.2015.09.012.
Belkada, F. D., Kitous, O., and Drouiche, N., 2018. Electrodialysis for fluoride and nitrate removal from synthesized photovoltaic industry wastewater. S, 204: 108-115, DOI: 10.1016/j.seppur.2018. 04.068.
Chen, Y. C., Cheng, C. Y., and Liu, C. T., 2018. Alleviative effect of fucoxanthin-containing extract from brown seaweedon renal tubular cell apoptosis through upregulating Na+/H+exchanger NHE1 in chronic kidney disease mice., 224: 391-399, DOI: 10.1016/j.jep.2018.06.023.
Cui, L., Li, G. P., and Li, Y. Z., 2017. Electrolysis-electrodialysis process for removing chloride ion in wet flue gas desulfurization wastewater (DW): Influencing factors and energy consumption analysis., 123: 240-247, DOI:10.1016/j.cherd.2017.05.016.
Dahaghin, Z., Mousavi, H. Z., and Sajjadi, M., 2017. A novel magnetic ion imprinted polymer as a selective magnetic solid phase for separation of trace lead(II) ions from agricultural products, and optimization using a Box-Behnken design., 237: 275-281, DOI: 10.1016/j.foodchem. 2017.05.118.
Fernandes, F., Barbosa, M., and Pereira, D. M., 2018. Chemical profiling of edible seaweed (Ochrophyta) extracts and assessment of theireffects on cell-free enzyme systems and on the viability of glutamate-injured SH-SY5Y cells., 116: 196-206, DOI: 10.1016 /j.fct.2018.04.033.
Frioui, S., and Oumeddour, R., 2017. Highly selective extraction of metal ions from dilute solutions by hybrid technology of electrodialysis., 174: 264-274, DOI: 10.1016/j.seppur.2016.10.028.
Gfiveng, A., and Karabacakoglu, B., 2005. Use of electrodialysis to remove silver ions from model solutions and wastewater., 172: 7-17, DOI: 10.1016/j.desal.2004.06. 193.
Ghorbani, F., Younesi, H., and Ghasempouri, S. M., 2008. Application of response surface methodology for optimization of cadmium biosorption in an aqueous solution by.,145: 267-275, DOI: 10.1016/J.CEJ.2008.04.028.
Govindaswamy, V., Vasudeva, V., and Balaraman, M., 2001. Response surface methodology for optimization of growth parameters for the production of carotenoids by a mutant strain of., 213: 234-239, DOI: 10.1007/s002170100356.
Jiang, J. J., and Shi, S. J., 2018. Seaweeds and cancer prevention., 14: 269-290, DOI: 10.10.16/B978-0-12-813312-5.00014-5.
Li, Z. X., Ma, Z., and Xu, Y. T., 2018. Developing homogeneous ion exchange membranes derived from sulfonated polyethersulfone/N-phthaloyl-chitosan for improved hydrophilic and controllable porosity., 35 (8): 1716-1725,DOI: 10.1007/s11814-018-0064-2.
Liu, C., Peng, J. H., and Zhang, L. B., 2018. Mercury adsorption from aqueous solution by regenerated activated carbon produced from depleted mercury-containing catalyst by microwave-assisted decontamination., 196: 109-121, DOI:10.1016/j.jclepro.2018.06.027.
Liu, W., Xu, H. M., and Liao, Y., 2019. Recyclable CuS sorbent with large mercury adsorption capacity in the presence of SO2from non-ferrous metal smelting flue gas.,235: 847-854, DOI:10.1016/j.fuel.2018.08.062.
Morsi, R. E., Al-Sabagh, A. M., and Moustafa, Y. M., 2018. Polythiophene modified chitosan/magnetite nanocomposites for heavy metals and selective mercury removal., DOI:10.1016/j.ejpe.2018.03.004.
Noguchi, M., Nakamura, Y., and Shoji, T., 2018. Simultaneous removal and recovery of boron from waste water by multi- step bipolar membrane electrodialysis., 23: 299-305, DOI:10.1016/j.jwpe.2018. 04.010.
Oehmen, A.,Vergel, Y., and Fradinho, J., 2014. Mercury removal from water streams through the ion exchange membrane bioreactor concept., 264: 65-70, DOI:10.1016/j.jhazmat.2013.10.067.
Pedra, A. G. L. M., Ramlov, F., and Maraschin, M., 2017. Cultivation of the red seaweedwith effluents from shrimp cultivation and brown seaweed extract: Effects on growth and secondary metabolism., 479: 297-303, DOI: 10.1016/j.aquaculture.2017.06.005.
Rhilassi, A. E., Boujaady, H. E., and Bennani-Ziatni, M., 2017. Use of response surface methodology for optimization of fluoride adsorption in an aqueous solution by Brushite., 10 (2): 3292-3302, DOI: 10.1016/ j.arabjc.2013.12.028.
Sadyrbaeva, T. Z., 2016. Removal of chromium (VI) from aqueous solutions using a novel hybrid liquid membrane- electrodialysis process., 99: 183-191, DOI: 10.1016/j.cep. 2015.07.011.
Sahu, U. K., and Mahapatra, S. S., 2018. Application of Boxe- Behnken design in response surface for adsorptive removal of arsenic from aqueous solution using CeO2/Fe2O3/graphene nanocomposite., 207: 233- 242, DOI: 10.1016/j.matchemphys.2017.11.042.
Shen, J. N., Hou, Z. D., and Gao, C. J., 2017. Using bipolar membrane electrodialysis to synthesize di-quaternary ammonium hydroxide and optimization design by response surface methodology., 25: 1176-1181, DOI: 10.1016/j.cjche.2017.03.025.
Sobolczyk-Bednarek, J., and Łaba, W., 2018. Optimization of copper, lead and cadmium biosorption onto newly isolated bacterium using a Box-Behnken design., 149: 275-283, DOI: 10.1016/j.ecoenv. 2017.12.008.
Su, C. Y., Li, W. G., and Wang, Y., 2013. Adsorption property of direct fast black onto acid-thermal modified sepiolite and optimization of adsorption conditions using Box-Behnken response surface methodology., 7: 503-511, DOI: 10.1007/s11783-012- 0477-9.
Suraiya, S., Lee, J. M., and Cho, H. J., 2018.spp. fermented brown seaweeds extracts enhance bio-functional activities., 21: 90-99, DOI: 10.1016/j.fbio. 2017.12.005.
Tak, B., Tak, B., and Kim, Y., 2015. Optimization of color and COD removal from livestock wastewater by electrocoagulation process: Application of Box-Behnken design (BBD)., 28: 307- 315, DOI: 10.1016/j.jiec.2015.03.008.
Tripathi, P., Srivastava, V. C., and Kumar, A., 2009. Optimization of an azo dye batch adsorption parameters using Box- Behnken design., 249: 1273-1279, DOI: 10. 1016/j.desal.2009.03.010.
Wang, Q., Gao, X. L., and Ma, Z., 2018. Combined water flux enhancement of PES-based TFC membranes in ultrasonic- assisted forward osmosis processes., 64: 266-275,DOI: 10. 1016/j.jiec. 2018.03.024.
Wang, Y. M., and Huang, C. H., 2010. Optimization of electrodialysis with bipolar membranes by using response surface methodology., 362: 249-254, DOI: 10.1016/j.memsci.2010.06.049.
Wu, H., Sun, J. X., and Qi, D. X., 2018. Photocatalytic removal of elemental mercury from flue gas using multi-walled carbon nanotubes impregnated with titanium dioxide., 230: 218- 225, DOI: 10.1016/j.fuel.2018.05.009.
Xue, J. L., Wu, Y. N., and Shi, K., 2019. Study on the degradation performance and kinetics of immobilized cells in straw- alginate beads in marine environment., 280: 88-94, DOI: 10.1016/j.biortech.2019.02.019.
Yang, W., Liu, Z. Y., and Xu, W., 2018. Removal of elemental mercury from flue gas using sargassum chars modified by NH4Br reagent., 214: 196-206, DOI: 10.1016/j.fuel.20 17.11.004.
Yang, Y., Gao, X. L., and Li, Z. K., 2018. Porous membranes in pressure-assisted forward osmosis: Flux behavior and potential applications., 60: 160-168, DOI: 10.1016/j.jiec.2017.10.054.
November 22, 2018;
March 26, 2019;
June 28, 2019
© Ocean University of China, Science Press and Springer-Verlag GmbH Germany 2020
. E-mail: mzyxy199@163.com
(Edited by Ji Dechun)
 Journal of Ocean University of China2020年1期
- Journal of Ocean University of China的其它文章
- Circulation and Heat Flux along the Western Boundary of the North Pacific
- System Reliability Analysis of an Offshore Jacket Platform
- The Mineral Composition and Sources of the Fine-Grained Sediments from the 49.6˚E Hydrothermal Field at the SWIR
- Research Progress of Seafloor Pockmarks in Spatio-Temporal Distribution and Classification
- Application of the Static Headland-Bay Beach Concept to a Sandy Beach: A New Elliptical Model
- Climatology of Wind-Seas and Swells in the China Seas from Wave Hindcast
