Circulation and Heat Flux along the Western Boundary of the North Pacific
JU Xia, MA Chao, XIONG Xuejun, GUO Yanliang, and YU Long
Circulation and Heat Flux along the Western Boundary of the North Pacific
JU Xia1), 2), 3), MA Chao1), 4),*, XIONG Xuejun2), 3), GUO Yanliang2), 3), and YU Long2), 3)
1) College of Ocean and Atmosphere Sciences, Ocean University of China, Qingdao 266100, China 2) The First Institute of Oceanography, MNR, Qingdao 266061, China 3) Laboratory for Regional Oceanography and Numerical Modeling, Pilot National Laboratory for Marine Science and Technology, Qingdao 266061, China 4) Laboratory for Ocean and Climate Dynamics, Pilot National Laboratory for Marine Science and Technology, Qingdao 266100, China
On the basis of the conductivity temperature depth (CTD) observation data off the coast of the Philippines (7.5˚–18˚N, 130˚E–the east coast of the Philippines) in the fall of 2005, the water mass distribution, geostrophic flow field, and heat budget are examined. Four water masses are present: the North Pacific Tropical Surface Water, the North Pacific Sub-surface Water, the North Pacific Intermediate Water, and the Antarctic Intermediate Water (AAIW). The previous three corresponded with the North Equatorial Current (NEC), the Kuroshio Current (KC), and the Mindanao Current (MC), respectively. AAIW is the source of the Mindanao Undercurrent. The mass transport of NEC, KC, and MC is 58.7, 15, and 27.95Sv, respectively (relative to 1500db). NEC can be balanced by the transport across the whole transect 18˚N (31.81Sv) and 7.5˚N (26.11Sv) but not simply by KC and MC. Direct calculation is used to study the heat flux. In sum, 1.45PW heat is transported outwards the observed region, which is much more than that released from the ocean to the air at the surface (0.05PW). The net heat lost decreased the water temperature by 0.75℃ each month on average, and the trend agreed well with the SST change. Vertically, the heat transported by the currents is mainly completed in the upper 500m.
North Pacific; western boundary currents; water mass; circulation; heat flux
1 Introduction
The Kuroshio Current (KC) and the Mindanao Current (MC) are well-known strong western boundary currents off the Philippine coast. Given their high velocity, high temperature, and high salinity, they strongly affect the energy, heat, salinity, and water volume in their path, particularly playing an important role in changing the climate of local sea areas. Both KC and MC originate from the North Equatorial Current (NEC). The NEC in the Pacific Ocean is a relatively stable wind-driven drift caused by trade winds. As the mean state of climate is concerned, the position of NEC is 7˚N–16˚N. The NEC flows from east to west and is a shallow circulation driven by wind and buoyancy flux. After reaching the Philippine coast, the NEC bifurcates due to terrain obstruction and forms two westward boundary currents, namely, the northward KC and the southward MC, which eventually move eastward, forming the Kuroshio extension and the northern Equatorial Countercurrent (NECC), respectively. NEC,KC, and MC are collectively referred to as the western boundary current system of the North Pacific (NP), which is recorded as NEC-KC-MC (Zhou, 2006). The system connects both Pacific subtropical cyclones and tropical cyclones, thus playing an important role in the heat budget in the Western Pacific warm pool. It directly enters the global thermohaline circulation through the Indonesia Throughflow and plays a decisive role in the meridional mass, heat, and salt transport of the world’s oceansand global climate, as well as the local and basin-scale circulation. Therefore, the study of the system facilitates accurate estimation of heat, mass transport, and freshwater flux in the tropical Pacific, which also plays a key role in understanding the climate dynamic mechanism (Qu, 1998).
As a result, the NEC-KC-MC system has attracted the attention of many scholars for a long time (Li, 1993a, b, c; Qu, 1998; Zhang, 2004; Sun, 2007). Nitani (1972) calculated the volume transport by using observations from several cruises from 1934 to 1968 and inferred that the average transport of MC, KC, and NEC was 25, 30, and 55Sv, respectively, with the latter equaling the sum of former two. Qu(1998), Yaremchuk and Qu (2004), and others studied the structure and transport of the system. However, no conclusion on system transport has been made. Since the 1980s, many observation programs such as TOGA, TAO, WOCE, and CLIVAR have been established and carried outinternational collaborations, and a large amount of new data have enabled the progress of research on the NEC-KC-MC system.
The above details show that a considerable amount of research has been conducted on the flow field structure of the western boundary current system, and a general consensus has been reached on the main structural characteristics of the flow field. However, most scholars studied only one or two currents because of the lack of data. Additional extensive marine surveys are needed to systematically study the circulation patterns. Previous studies on the Western Pacific focused almost only on the dynamic characteristics of the flow field, and little attention is paid to the heat transfer. Oceans affect the global climate through heat transport. According to Macdonald (1993), ‘A knowledge of the role played by the oceans in balancing the global heat budget is fundamental to understanding climate and climate evolution’, which suggests that the study of heat balance cannot be ignored.
The purpose of this study is to conduct a systematic analysis of the flow field and volume transport in the source region of the NEC–KC–MC system in the NP by using high-quality observation data. The heat transfer is calculated and the heat balance is preliminarily analyzed to contribute to the improvement of the theory of the western boundary current.
2 Data
The research region lies in the western Philippine Sea, where the depth is mostly over 4000m, even reaching 6000–8000m in the ocean trench along the Philippine coast, as shown in Fig.1. The data are obtaineda project supported by the National High Technology Research and Development Program of China. From September 15 to December 3, 2005, the Ocean University of China conducted a cruise in the northern South China Sea and NP using SeaBird-911Plus CTD to collectdata sets, with a vertical resolution of 1m and a maximum observed depth of over 3500m. The sections are located at 7.5˚N, 8.5˚N, 10˚N, 12˚N, 15˚N, and 130˚E, including a total of 95 stations (see Fig.1). The distance between adjacent stations is 1˚ along the meridional section, while the space is 0.5˚ offshore and 0.25˚ inshore along the zonal sections.
The flow field discussed in this paper is geostrophic flow, which is obtained by dynamic calculation method. The zero reference plane is 1500db.

Fig.1 Station distribution and topography.
3 Water Mass Distribution
Fig.2 shows the T-S diagrams of each section, all of which are shaped as a reversed ‘S’. This detail means that two typical water masses are present in the vertical, characterized by high temperature and high salinity, and low temperature and low salinity, respectively. The red line in Fig.2 demonstrates the T-S characteristics of the typical NP water mass given by Wang and Chern (1997), which is used to compare with the T-S points in black. Apparently, in the mid-layers, the T-S characteristics south of 15˚N are different from those north of 15˚N, which means that two kinds of mid-layer water masses exist. In fact, four water masses above 2000m are present in the source region, namely, the North Pacific Tropical Surface Water (NPTSW), the North Pacific Sub-surface Water (NPSSW), the North Pacific Intermediate Water (NPIW), and the Antarctic Intermediate Water (AAIW).
NPTSW lies in the upper 110–130m and is character-ized by high temperature and low salinity in accordance with abundant solarradiation and precipitation in tropical regions. The mass near the equator is thinner than that away from the equator, and its temperature changes more dramatically.
NPSSW is well known for its high salinity; the core salinity is over 34.90 with a maximum of 35.44. The depth of the salinity core changes from 90 to 240m northward. This water mass originates from the NP subtropical high pressure center around 23˚N, 172˚30΄E, where the salinity is increased significantly because of its intensive evaporation (Chao, 1993).
NPIW is distributed at about 180–1290m and is characterized by low salinity. It is also shallower in the south. The core salinity is less than 34.25 to the northeast of 15˚N, which is the minimum among all global intermediate water masses. NPIW originates from the subarctic ocean, formed by vertical mixing (Reid, 1973), which is also carried by the NEC.
AAIW usually lies north of 12˚N, with moderate tem-perature and salinity. It stays below or to the east of NPIW, because NPIW moves southward along the coast. The core salinity of AAIW ranges from 34.4 to 34.5, notably higher than that of the NPIW. This water mass originates from the subarctic convergence region in the South Pacific (Li, 1993a). It maintains most of its temperature and salinity characteristics on its way northward. After passing through the equator, a part of AAIW joins the equatorial circulation (Zhang, 2006), while the remainder flows northward along the western boundary. The northern branch is the MUC, which will be confirmed in the following analysis on the circulation.
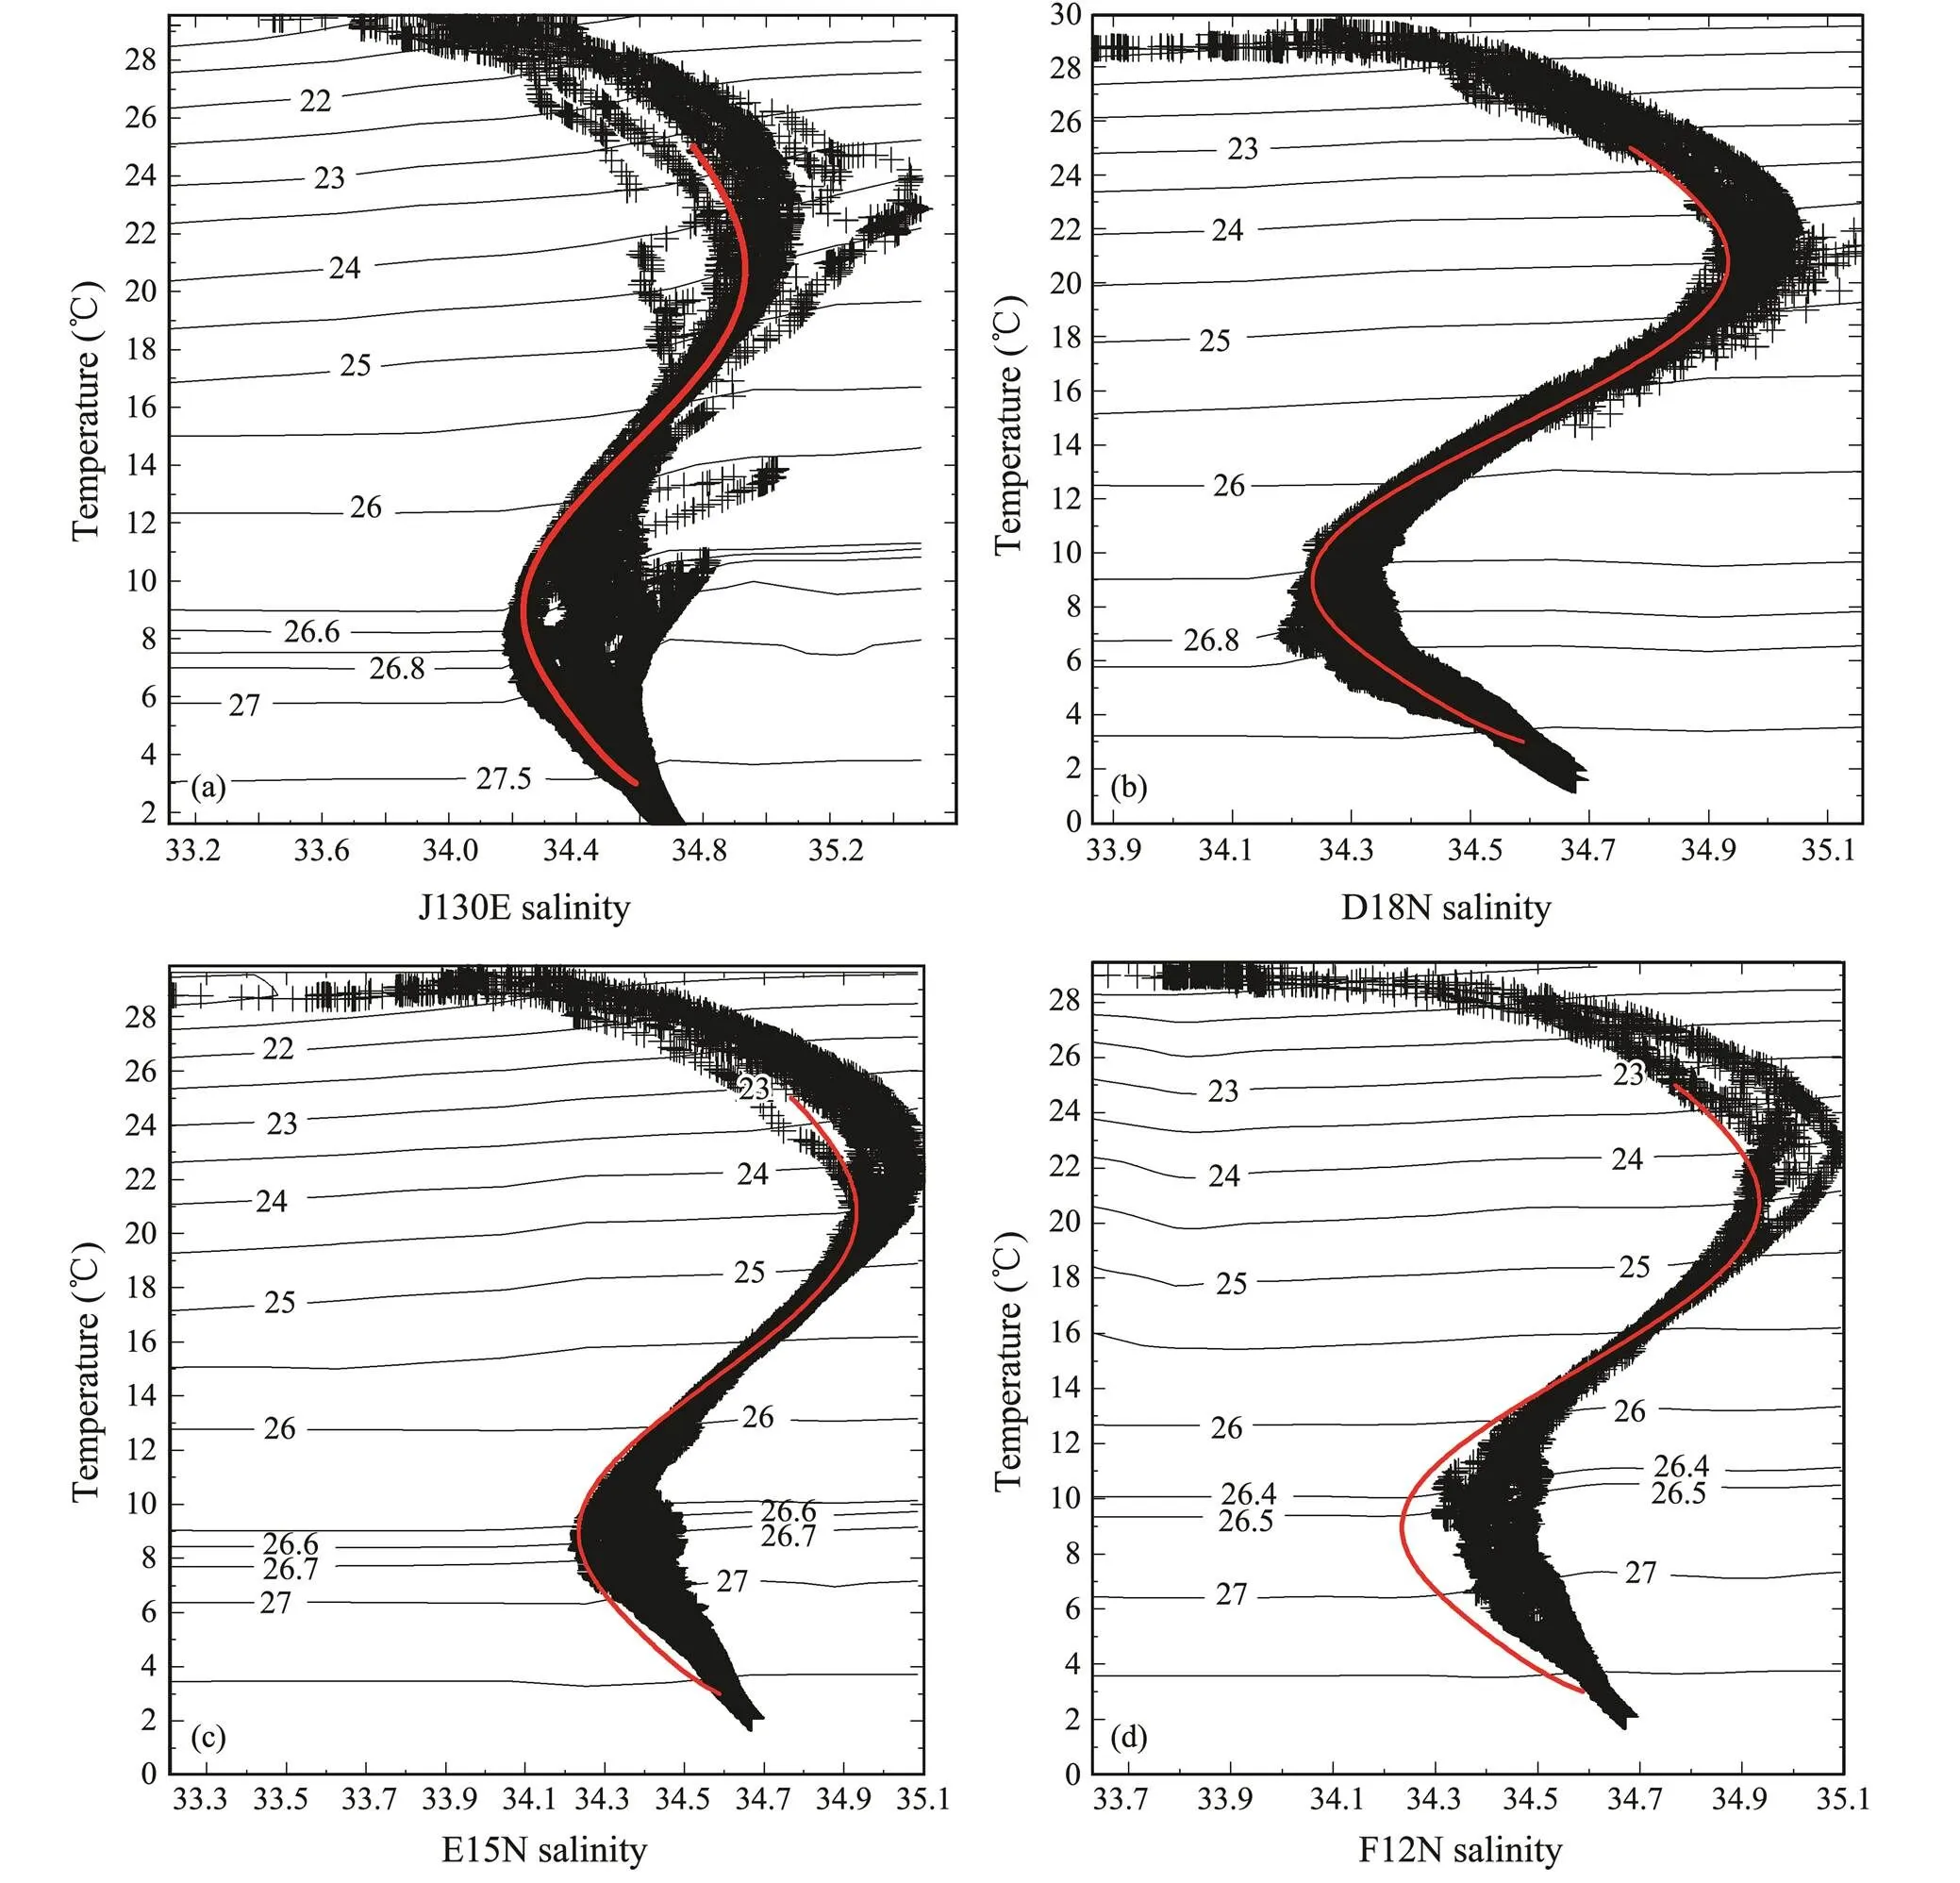
Fig.2 (a)–(d) T-S diagrams along each section.
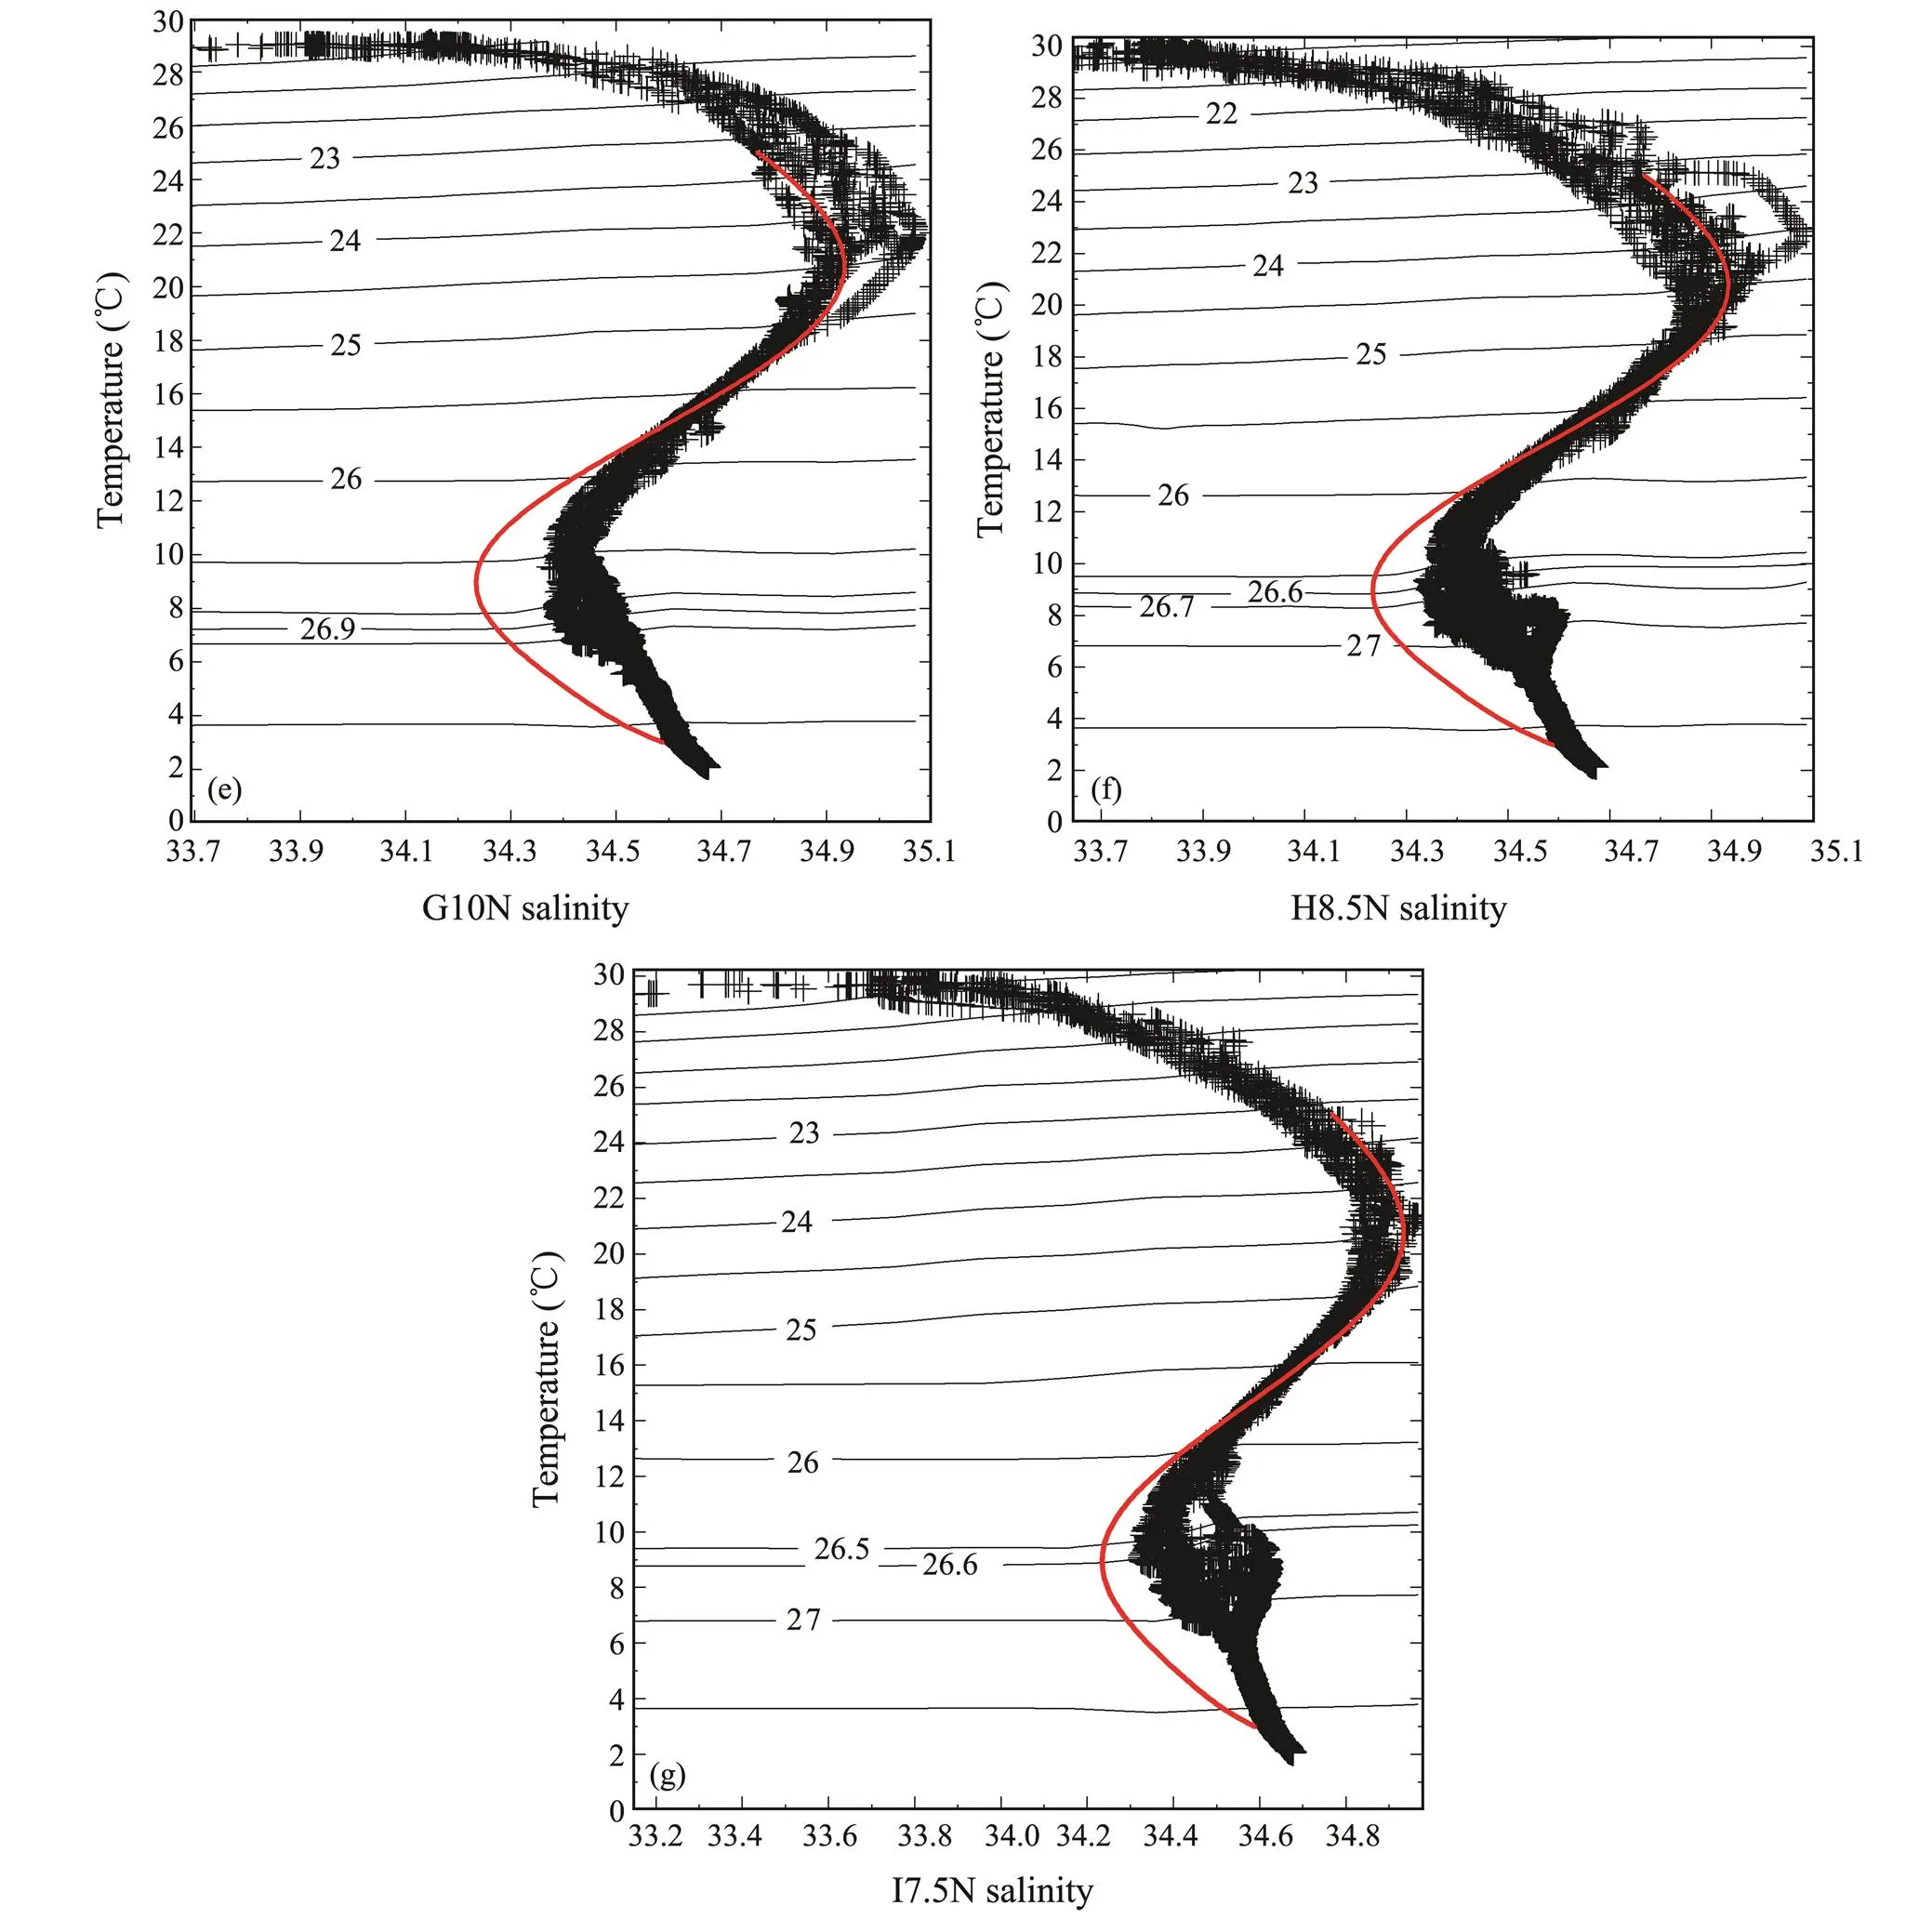
Fig.2 (e)–(g) T-S diagrams along each section.
4 Current Structure and Volume Transport
4.1 Mean Structure Along Meridional Section
NEC is easy to recognize in the section at 130˚E (Fig.3). The westward flow expands from 8˚N to 18˚N at the surface with a maximum of over 30cms−1. Three high-speed cores are located at 10.5˚N, 14˚N, and 17.5˚N, respectively; the two northern cores agree with the climatology flow field, and the southern core is probably related to the Mindanao Eddy (ME) (Qu, 1998). In the vertical direction, three currents flow eastward below 250m, with a highest speed of no more than 10cms−1. In addition, the thickness of the NEC is smaller in the south than in the north as determined by the conservation of potential vorticity (Toole, 1990). The relative vorticity is lower than(<10%) in the ocean interior; thus, potential vorticity is largely determined by/, whererepresents the planetary vorticity andis the thickness of the current. To keep/constant,must grow larger northward asincreases.
The bifurcation of NEC has always been a focus of studies on the NP western boundary. Here bifurcation is defined as the point where the average meridional velocity within the 2˚-longitudinal band from the coast is zero. The average velocity structure is shown in Fig.4a, with the bold line indicating bifurcation. It moves from 13˚N at the surface to 18˚N at a depth of 700m, and the vertically average branch point occurs at about 15˚N. The result is similar to Qu’s (1998) analysis (Fig.4b), which used annually averaged hydrological data. Bifurcation changed from 13.5˚N at the surface to 18˚N at 500m, and the vertically average position is 15˚N as well. The difference is most likely due to different sources of data collected from different periods of time.
The eastward current to the north of NEC is the Subtropical Countercurrent (STCC), with a velocity of over 30cms−1at the surface, and the range of 10cms−1even reaches 800m. NEC and STCC are the northern and southern branches of the NP subtropical cyclonic circulation, respectively (Sun, 2000). NEC turns to the north at the east of the Luzon Strait and rotates clockwise to the east of Taiwan then flows eastward along 20˚N. Compared with NEC and STCC, the NECC is much stronger (Sun, 2000). It spreads widely to the south of 8˚N with a speed exceeding 60cms−1at the surface and 30cms−1at depths lower than 300m, far greater than the speed of NEC and STCC at the same depth.
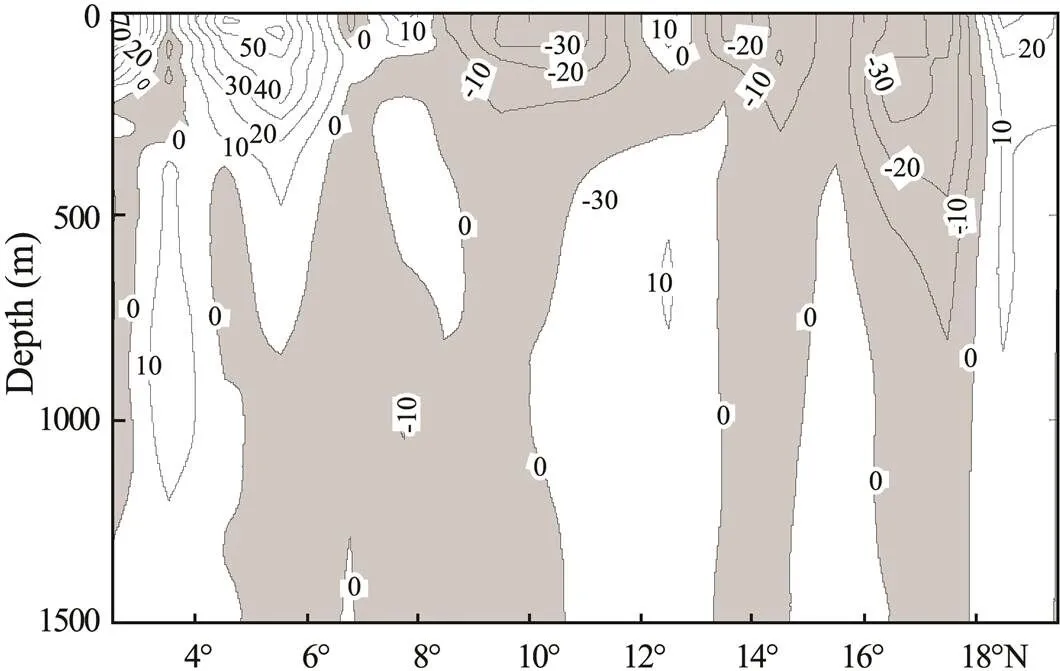
Fig.3 Velocity distribution on Section J (130˚E; gray means westward, white means eastward).

Fig.4 Change in NEC bifurcation (a, 2005, the heavy solid line; b, Qu et al., 1998).
4.2 Mean Structures Along the ZonalSections
KC is confined to the east of 123.5˚E (Fig.5a), with a maximum baroclinic velocity exceeding 80cms−1at 100m, and it reaches deeper than 1300m. According to the contour, KC is as wide as 100km, which is different from the common conception of 200km (Qu, 1998; Ding, 2000). Therefore, further research on sea-surface height is conducted to reveal the flow field around KC (Fig.6). High-resolution sea-surface height anomaly (SSHA) data are obtained by merged TOPEX/Poseidon and ERS altimeter measurements provided by Space and Ocean Administration Collecte Localisation Satellites. The time series ranges from October 14, 1992 up to the present. The time interval is 7 days, and the spatial resolution is 0.25˚×0.25˚. SSHA maps from October 26 and November 2, 2005 (these two records overlap with the observation period) show that two pairs of alternating cyclonic and anticyclonic eddies are present at 18˚N. These eddies explain the existence of many alternating bands of northward and southward flows east of KC. The sizes of these eddies are the same as the KC’s width.
Section E at 15˚N (Fig.5b) indicates that KC is not very strong soon after it separates from NEC, with a maximum velocity of no more than 30cms−1at the surface. The southward flow below 400m also demonstrates that NEC bifurcates somewhere north of 15˚N.
The sub-surface southward current below the KC, which is called the Luzon Undercurrent (LUC), is located on the continental slope, narrower than 50km, with a highest speed of about 5cms−1.
MC is extremely strong inshore, where the maximum speed is greater than 190cms−1at the surface (Fig.5f), but weaker with velocity less than 40cms−1offshore. It extends to 1500m in depth. Qu(1998) noted that MC has a highest speed of roughly 80cms−1, which is far smaller than our result. Figs.5c–f show that, overall, MC is stronger south of 8.5˚N than in the north, although the velocity does not change regularly. Usually, MC is defined in the west of 128˚E (Wang, 2001; Zhou, 2006), and the part east of 128˚E is considered the western branch of a cyclonic eddy.
At the depth of 200m, a distinct northward flow is observed, which can extend to 1500m and has a width of about 200km (Fig.5c); this is MUC. It has two high-speed cores at 127.9˚N, 600m and 128.75˚E, 300m, with core velocities of 20 and 10cms−1, respectively. The presence of multi-cores is consistent with that described by Hu and Cui(1989), who first proposed the existence of MUC. Other sections (Figs.5d–f) indicate that MUC weakens when it moves northward. Lukas(1991) observed the same behavior from ADCP and CTD data. The path of MUC is also in accordance with the AAIW distribution mentioned above.
4.3 Mean Volume Transport
On the basis of the current structure discussed above, mean transports in the upper 1500m of each section and each current were estimated. NEC, KC, and MC are calculated at 130˚E, 18˚N, and 7.5˚N, respectively (Fig.7), because these sections enclose the surveyed area. However, KC and MC are not the only flow in their sections (Fig.7). The transport of NEC is calculated from 7.5˚ to 18˚N for a total of 58.7Sv; KC from the coast to 123.5˚E amounts to 15Sv; and MC, which is limited within the west of 128˚E, is about 28Sv. Other currents are shown as well. Yang (2008) calculated the water volume through the Luzon Strait by using data from the same cruise. Findings indicate the trace of KC and are marked in Fig.7 to complete the circulation diagram.
Fig.8a displays the total volume transport in each section, which reveals a mass balance in the studied regions. However, it differs from the balance given by Nitani (1972) and Qu(1998), who found that the transport of NEC equals the sum of KC and MC. Instead, the transport balance is achieved among all flows, but not NEC, KC, and MC only.
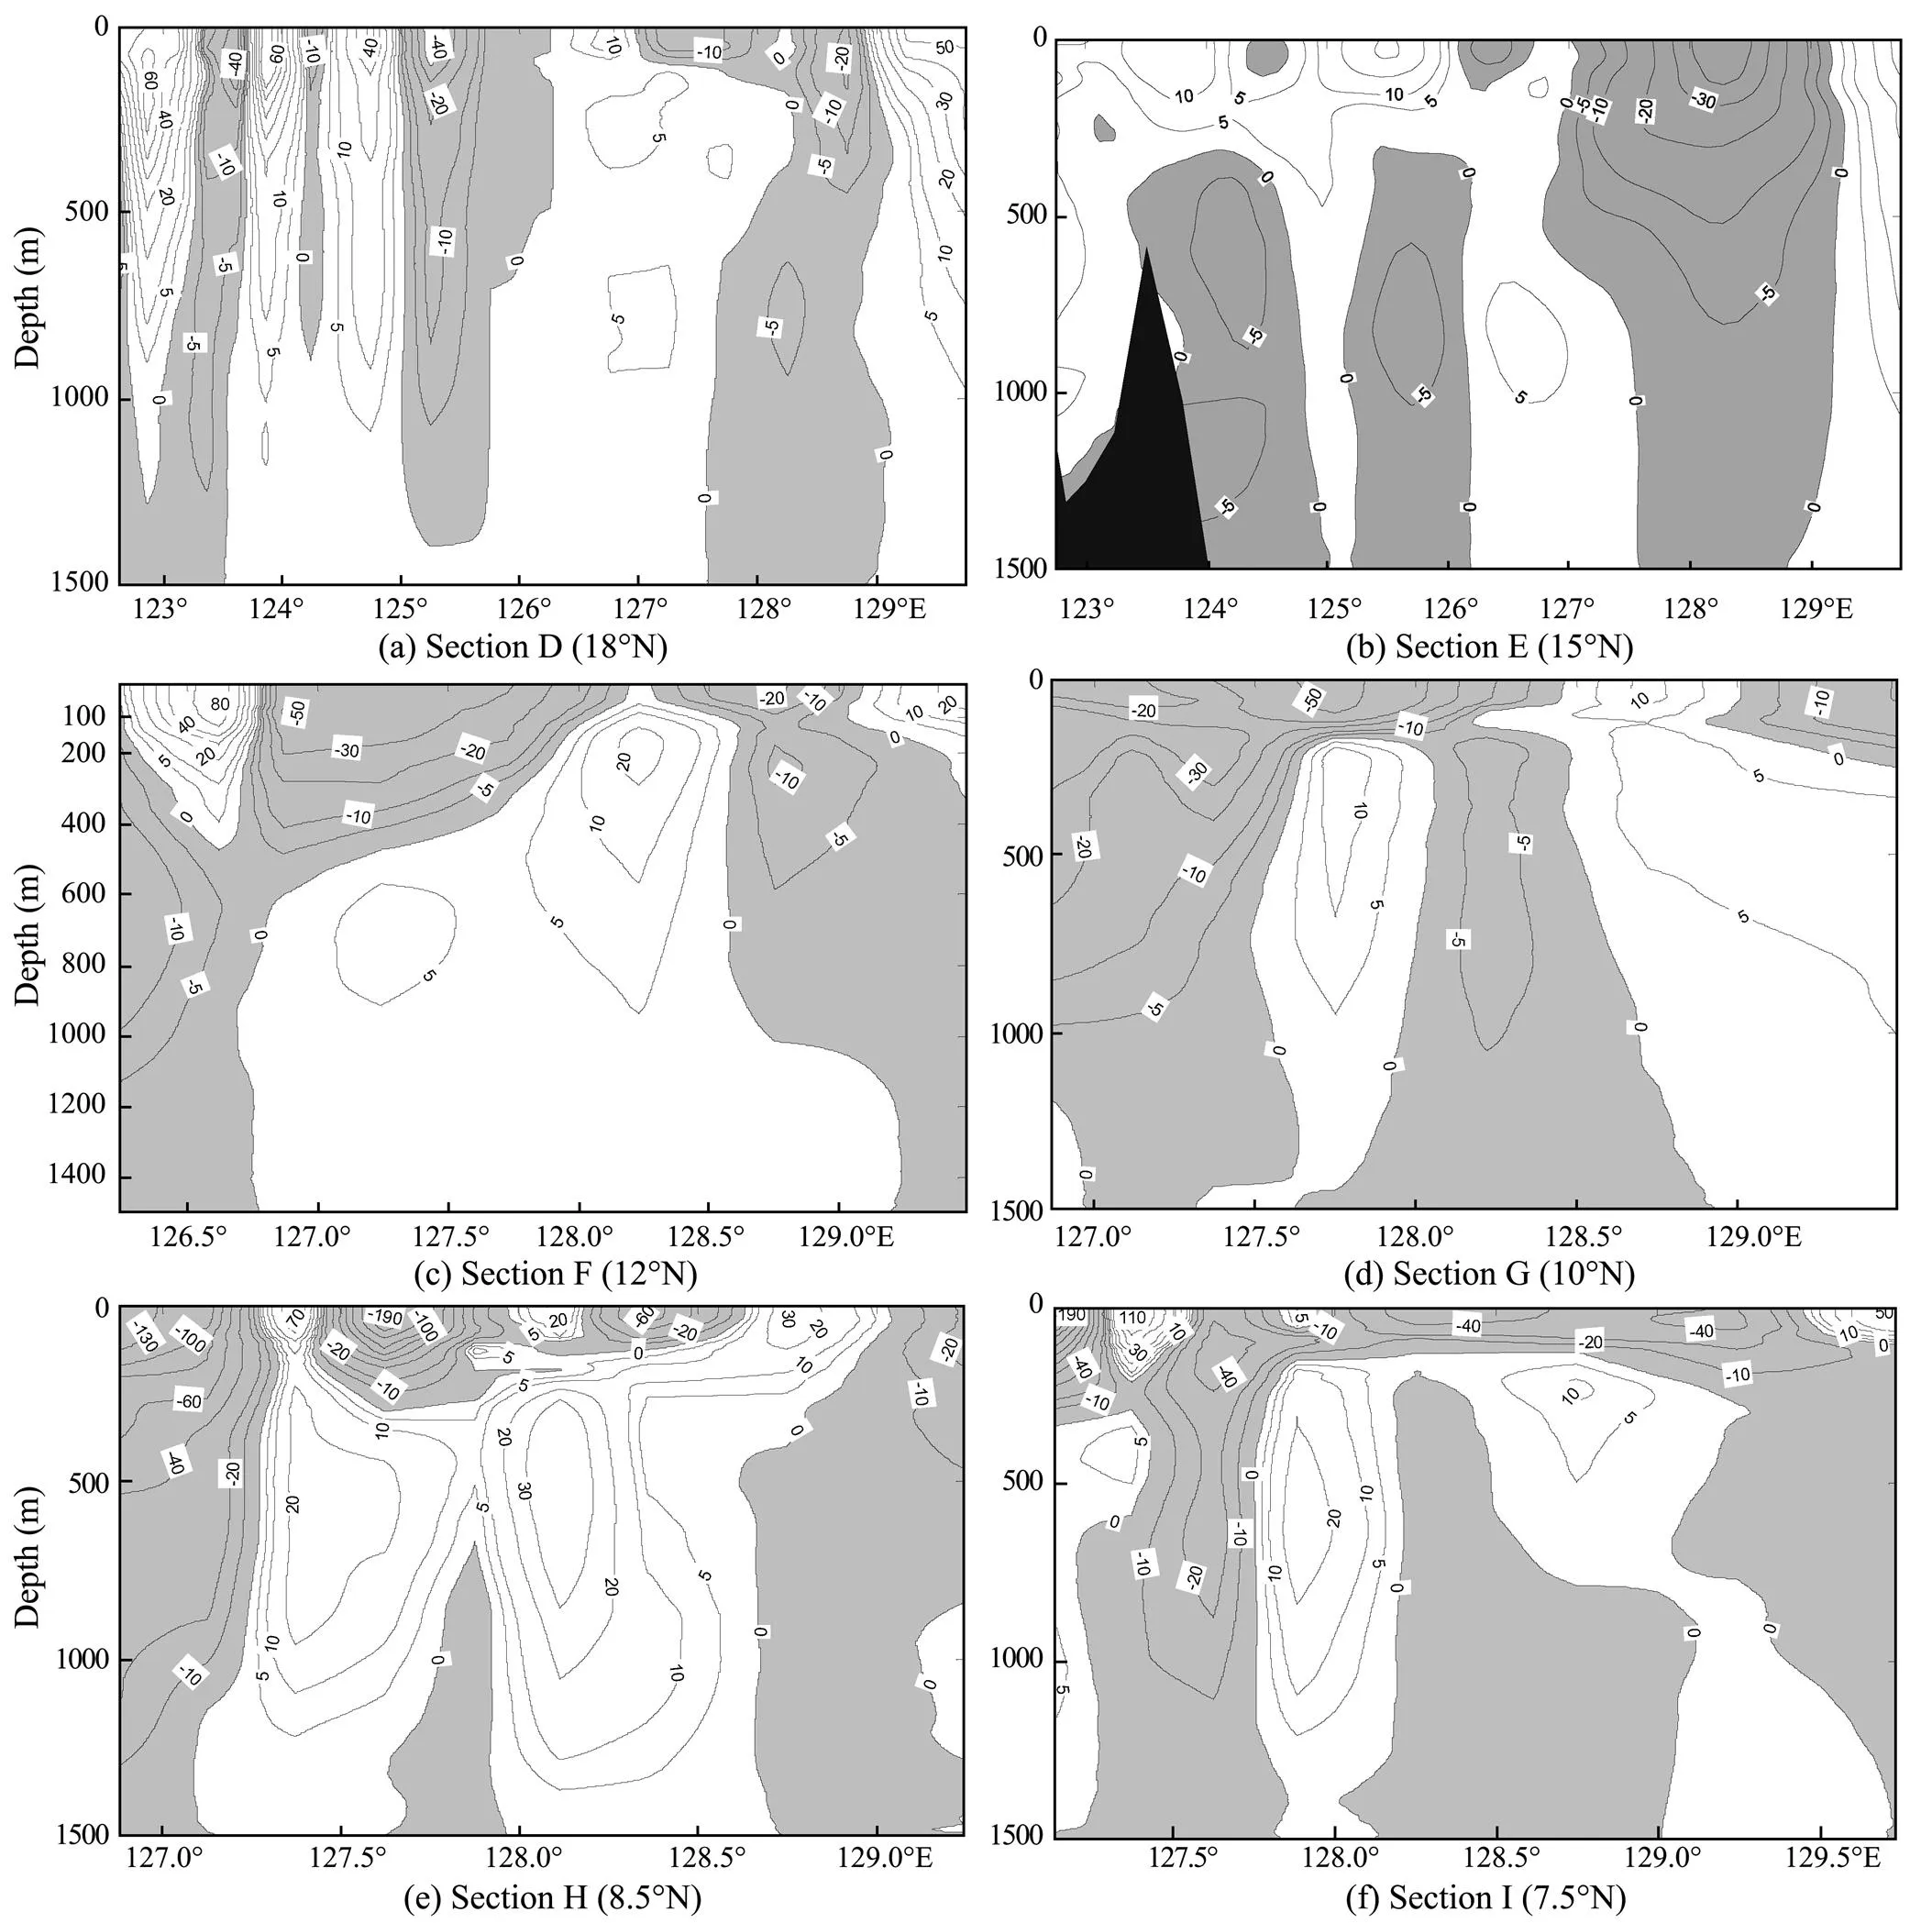
Fig.5 Velocity distribution on each zonal section (gray means southward, white means northward).
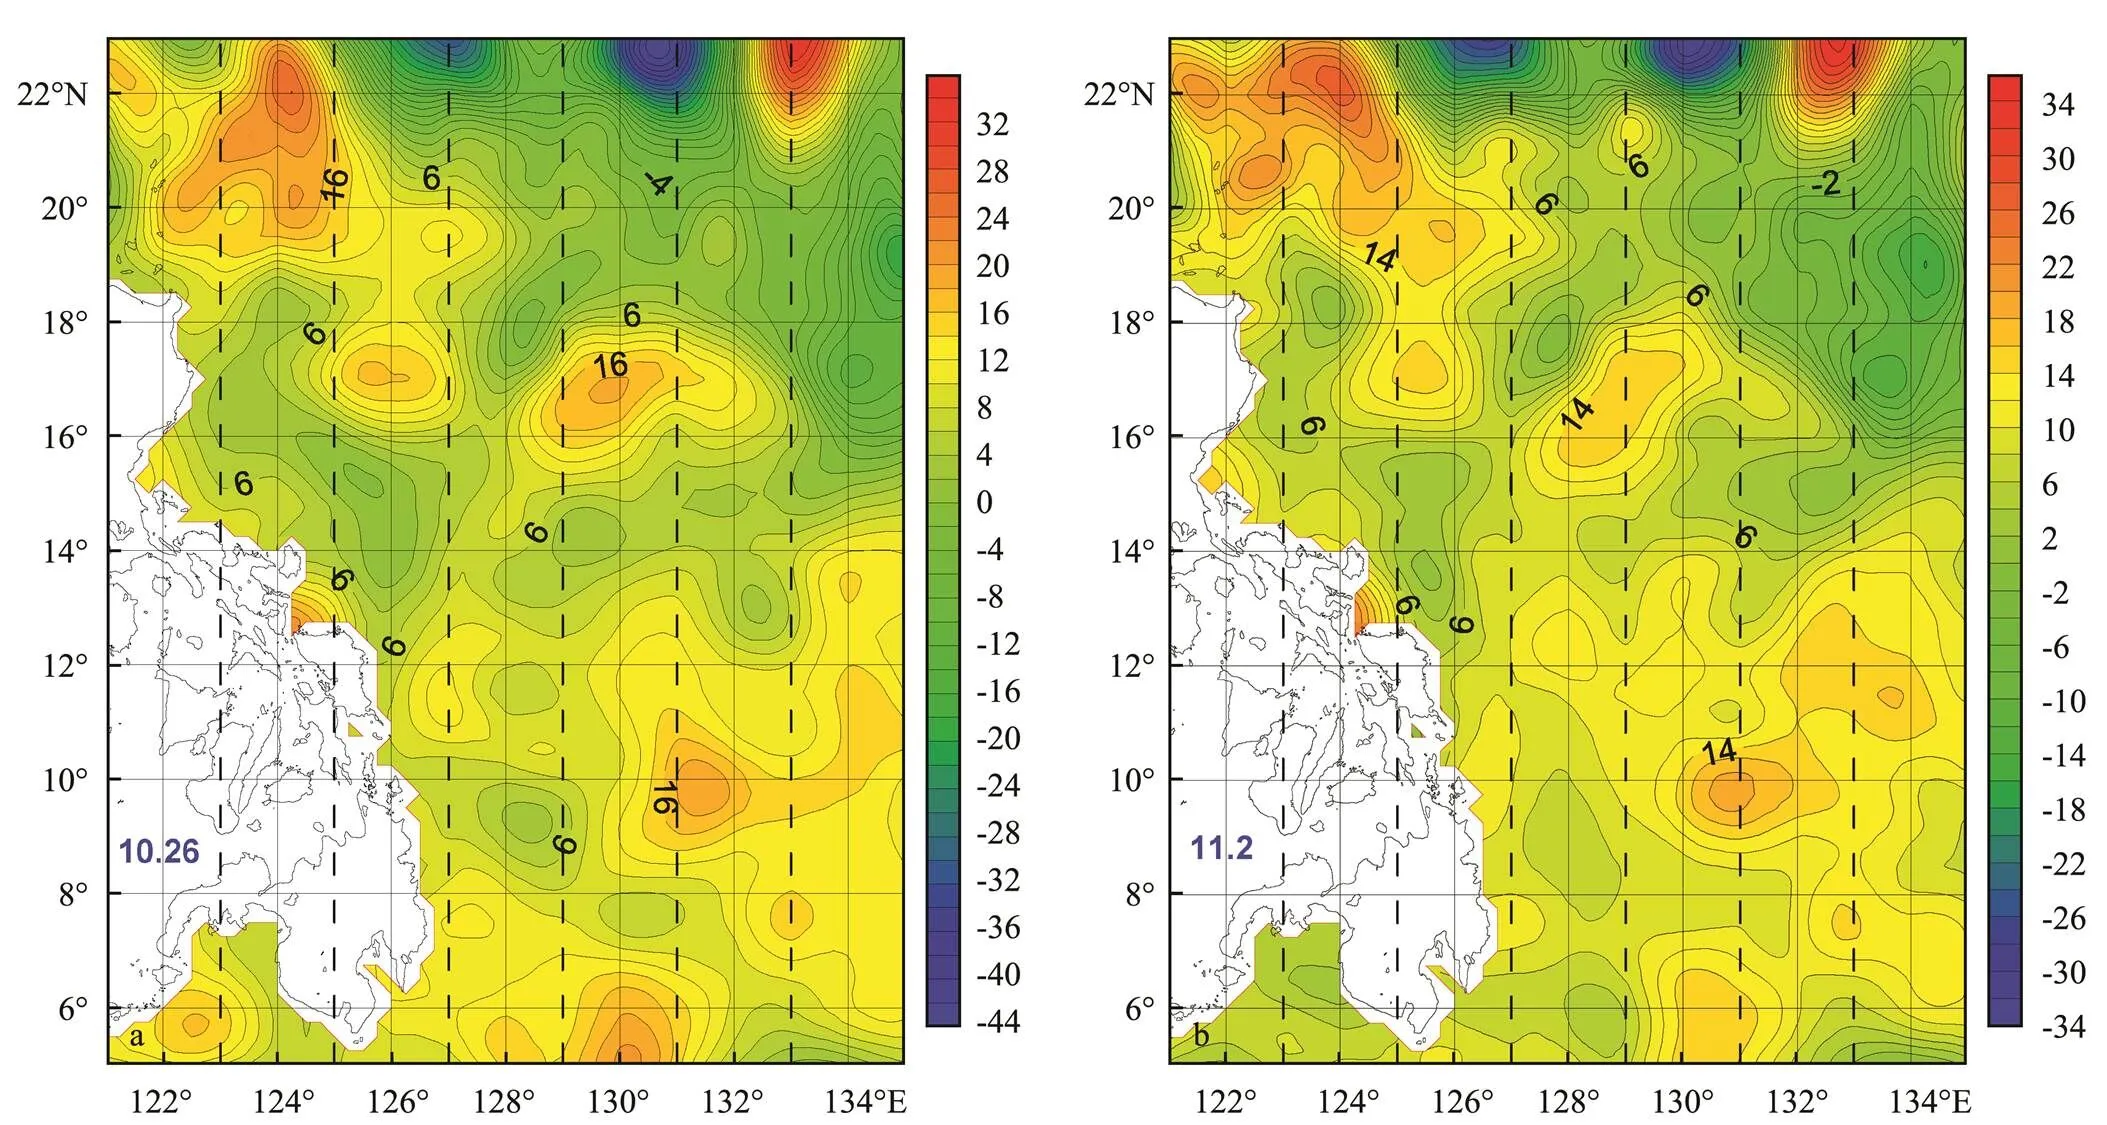
Fig.6 SSHA distribution (Unit: cm).
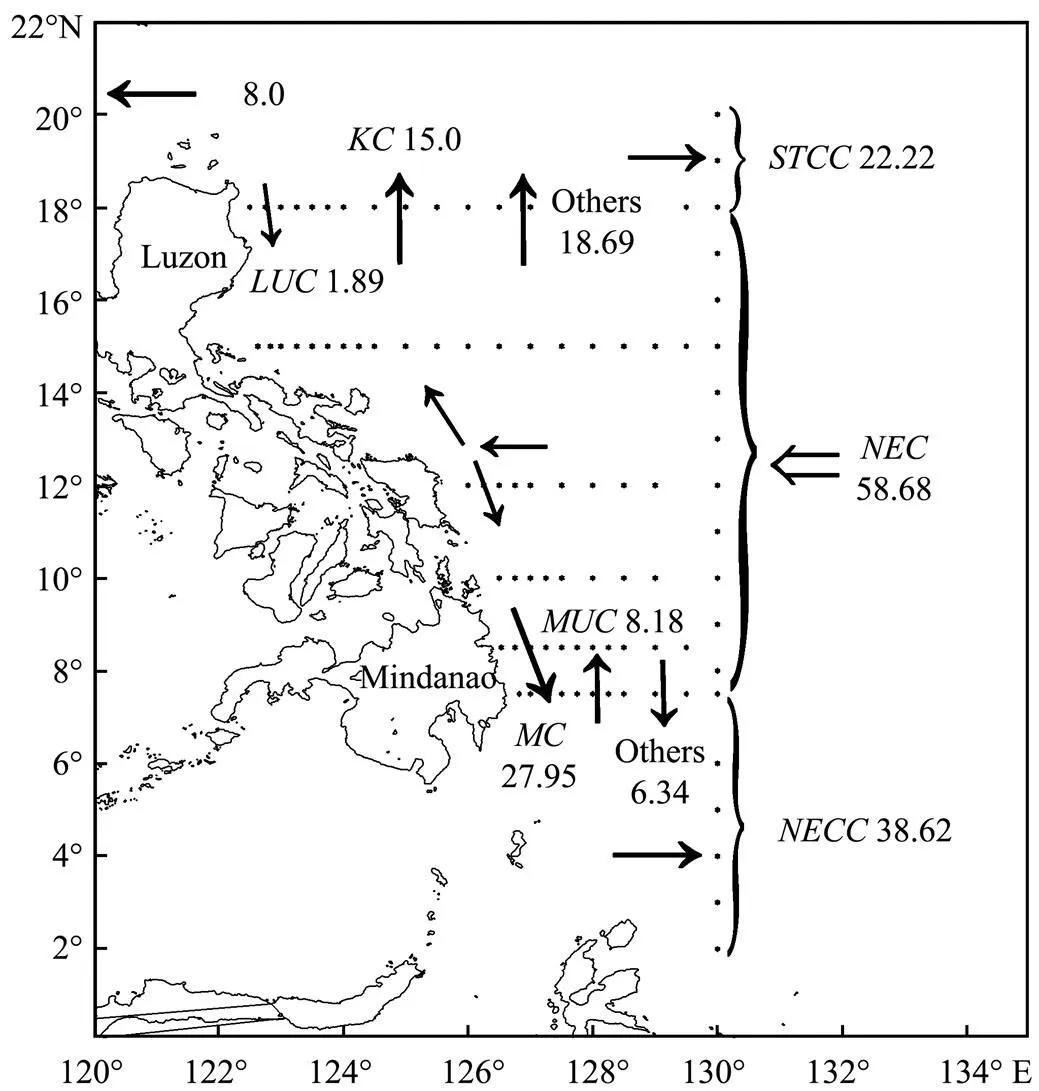
Fig.7 Volume transport of main currents (relative to 1500db, unit: Sv).
Details of the layered transports at the meridional section and each zonal section are analyzed (Figs.8a–d). Reaching a complete mass balance in each of the subareas whether for the whole water column or a certain layer is not easy probably because of smaller-scale processes such as turbulences or internal waves. In the upper 500m, the transport direction of each small box is the same as that above the 1500m depth. Therefore, the circulation in the upper 500m can be inferred to be dominant. The volume transport in the southeast turns cyclonically, which indicates the existence of the ME. Below 500m, the cyclonic transport disappears, implying that ME is confined in the upper layer. This conclusion agrees with the result of the Argo study (Zhou, 2006). Qu and Mitsudera (1999) also suggested that ME becomes weaker with depth. From 500db to 1500db, transport between 8.5˚–12˚N changes its direction northward, whereas that between 10˚–15˚N across 130˚E turns eastward; the circulation appears to be anticyclonic and should thus be MAE (Zhou, 2006). Zhou described that MAE reaches 1000m; it was elliptic with the major axis directed NE-SW, and MAE exhibited the same trend of strengthening or weakening with MUC. MUC is referred to as the west branch of MAE, which needs further investigation.
5 Heat Transport
Two main methods are used to estimate the heat transport in the ocean: direct and indirect calculations. For the indirect method, which is more traditional, the net heat budget at the sea surface is first calculated, and the ocean heat transport is estimated according to the change of the total heat content (Hsiung, 1989; Zhao, 1994). The heat exchange can be estimated in two ways: to solve bulk aerodynamic equations (Hsiung, 1985) and to compute using the meridional heat transfer in the atmosphere and the net radiation based on the atmospheric energy balance formula (Carissiom, 1985; Trenberth and Solomon, 1994). Bryden(1991) and Hall and Bryden (1982) are examples of studies that conducted direct calculation using observed current and water temperature data. Recently, the development of remote sensing and ocean circulation models made obtaining the air–sea heat flux easier, thereby leading to more applications of indirect methods. However, Hall and Bryden(1982) compared results from several indirect and direct estimations and concluded that direct calculation is more accurate. Thus, we choose the direct method to analyze heat transport.
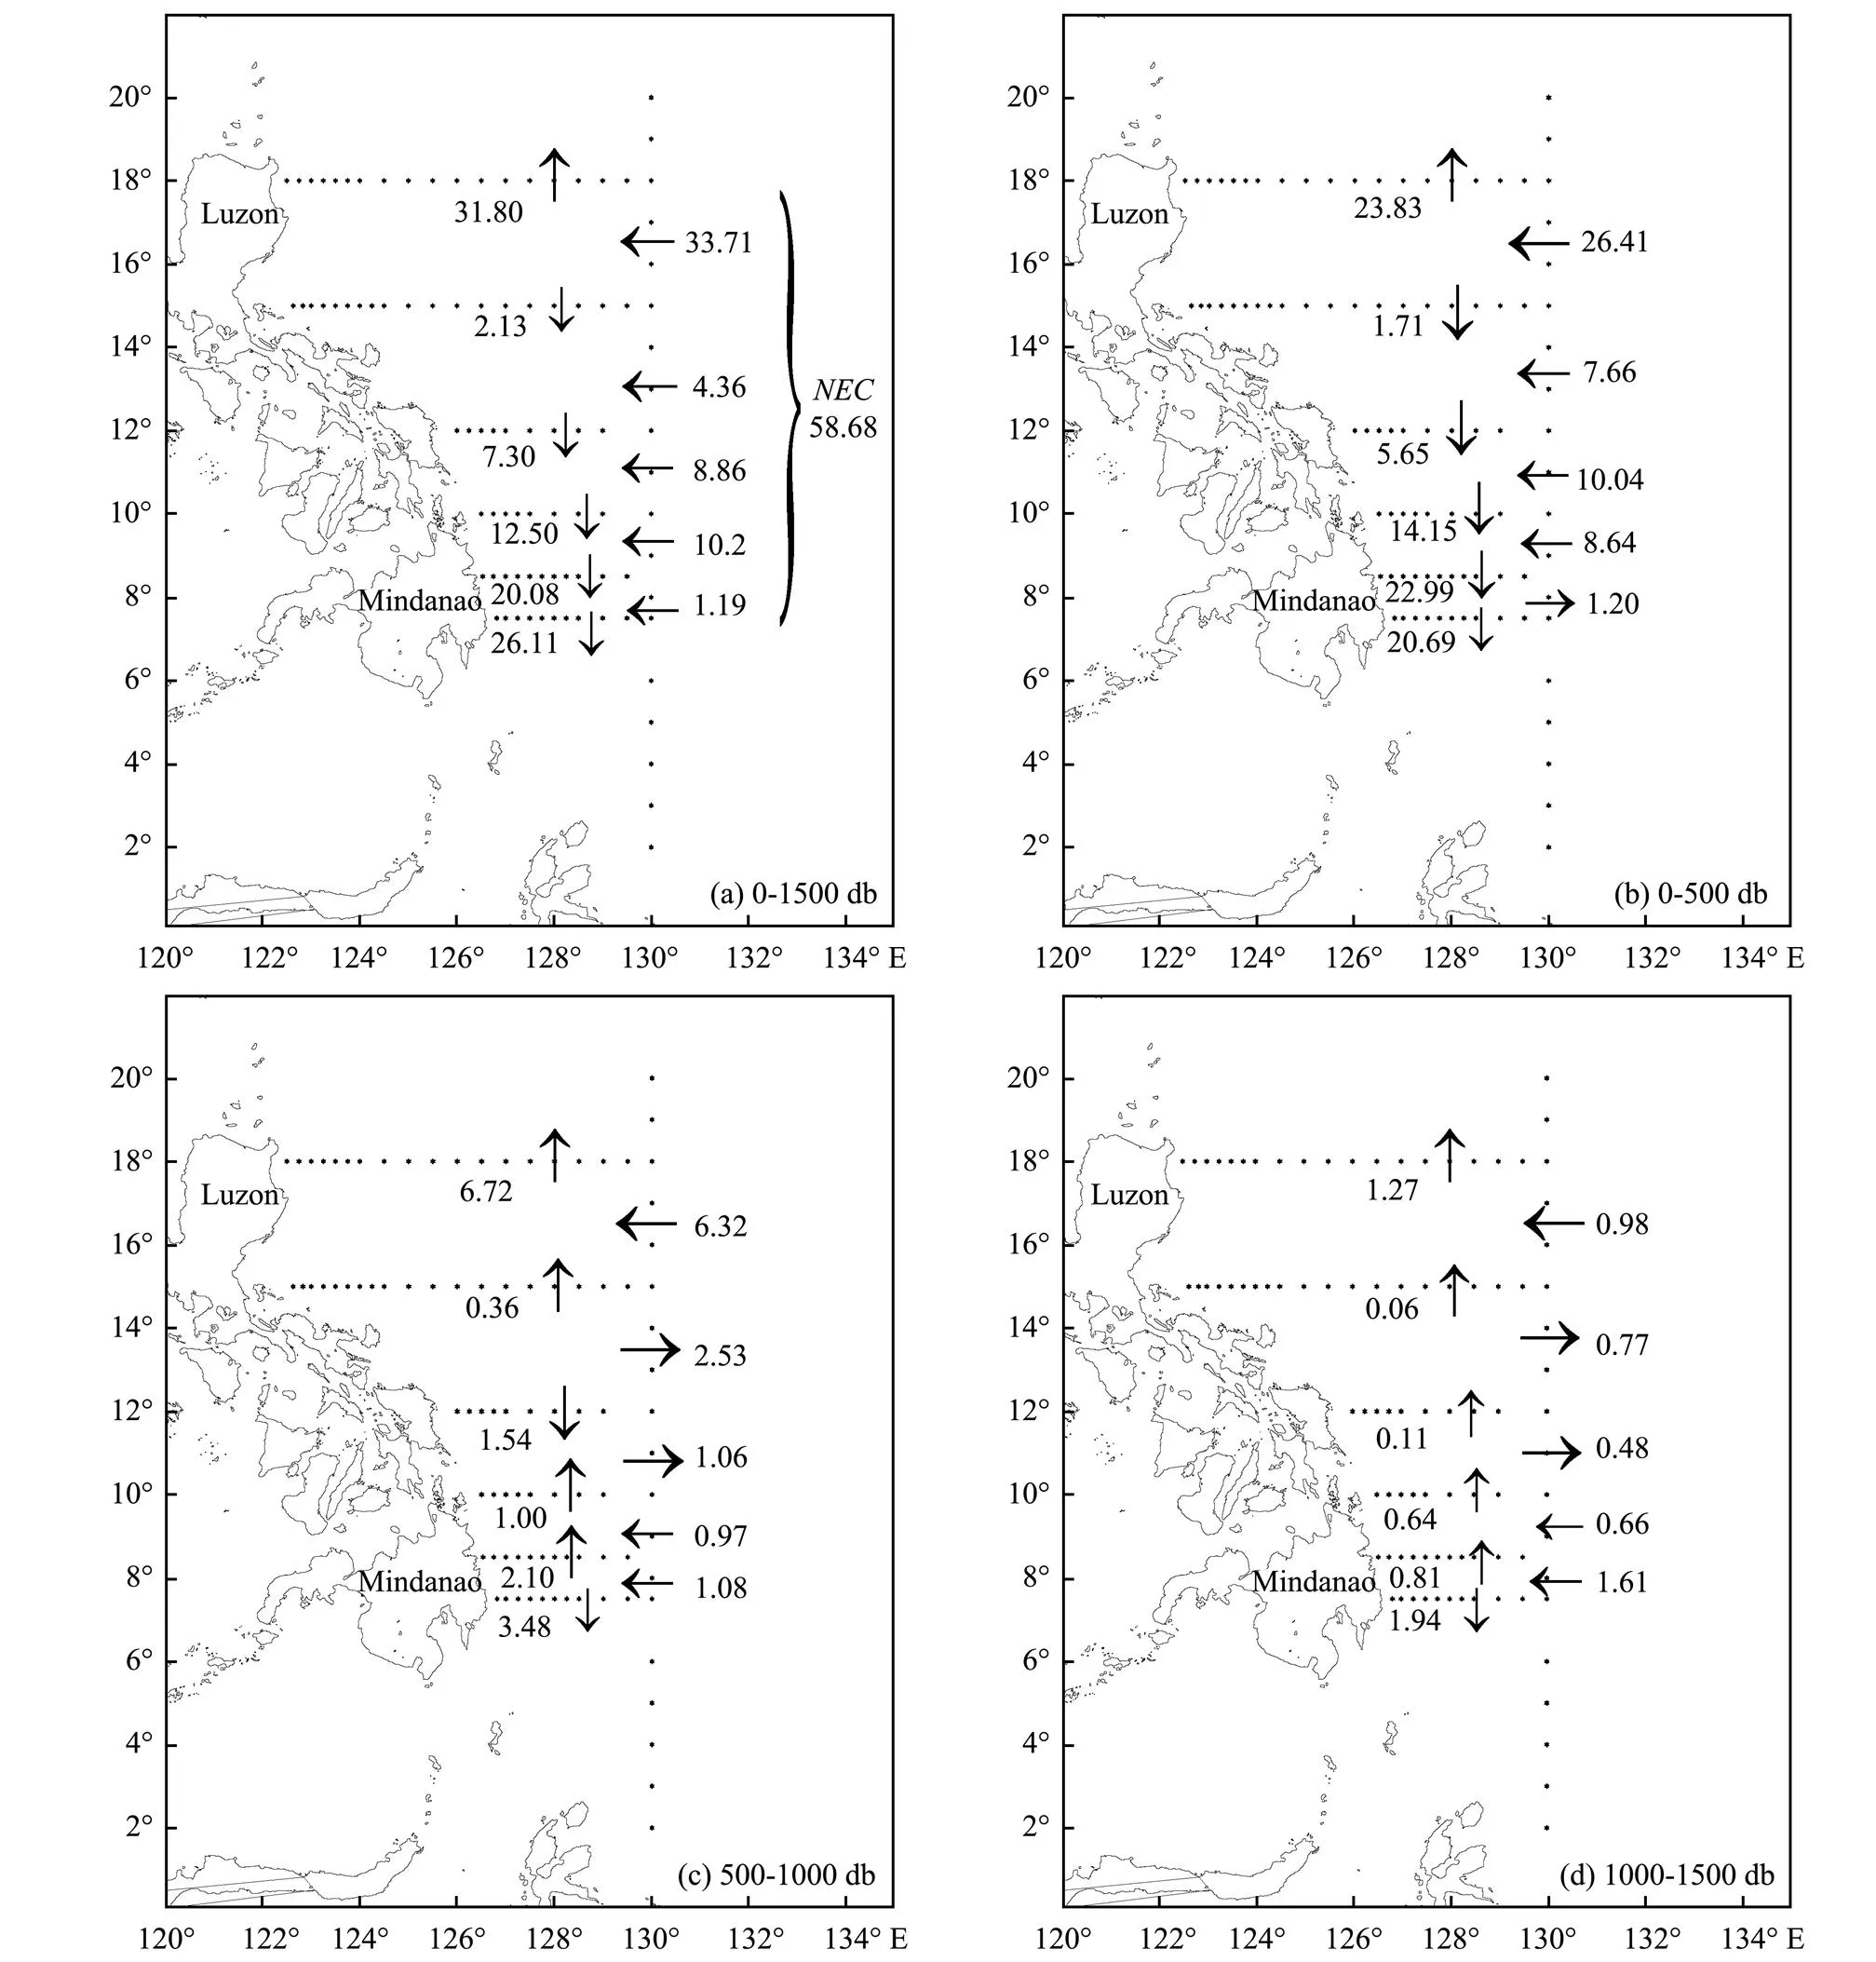
Fig.8 Layered volume transport (unit: Sv).
The heat transported through a section is usually divided into two parts: one is caused by mean current, while another is caused by eddies, which is also referred to as overturning flow by some researchers (Bryden and Hall, 1980; Hu, 2005). Bryden(1991) named the two parts horizontal and vertical flux, as mentioned in the large-scale Pacific Ocean. The relevant formulas are stated as follows:


whereis the number of layers,is the number of stations along a certain section,∆xrefers to the distance between adjacent stations, and ∆pis the vertical interval. Densityis the observed value, and the value of specific volume heat at constant pressure,C, equals 4.2×10³J(kg℃)−1. The heat flux is first estimated across each section according to the two formulas, followed by a discussion about the net heat balance in the enclosed region and its influence.
5.1 Main Heat Transport
Heat transports through all sections are listed in Table 1. According to the table, heat transported by the eddies is much greater than that transported by the mean current. The direction of heat movement is the same as the volume transport: northward on the sections north of 12˚N and southward to the south of 12˚N. Hu(2005) stated that the meridional overturning flow is dominant in the tropical Indian Ocean. The similarity shows the resemblance between the tropical Western Pacific and the Indian Ocean. However, in Bryden’s research (1991), heat transport across the transpacific hydrographic section was half due to vertical meridional circulations and half due to horizontal circulations, which means eddies and mean current had equivalent influences, a finding that is different from the result in this paper. The difference illustrates that rules that are appropriate for large-scale oceans are not always appropriate for a local region.
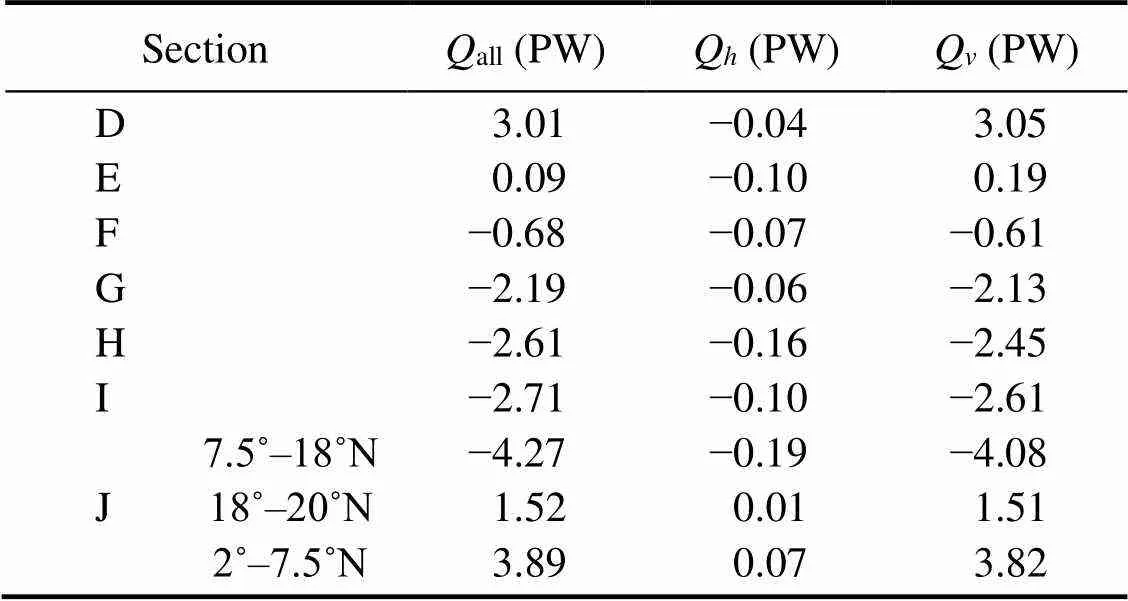
Table 1 Heat transport across each section
In conclusion, total heat transport through 130˚E (ranging from 7.5˚N to 18˚N), 18˚N, and 7.5˚N are 4.27PW westward, 3.01PW northward, and 2.71PW southward, respectively. The net heat budget is −1.45PW, which means the region of the western boundary current loses heat during the observed seasons.
5.2 Heat Transported by Each Current
Heat transported by each current is also calculated (Table 2). The direction of the heat movement is the same as the volume transport, and the magnitude of heat transportation is proportional to its volume. In particular, heat carried by the meridional mean current is always south- ward, asQshowed in the table, and the value is close to zero. The direction should not be determined by observations at a single time. Longer time-series data are needed to determine if this is a persistent feature.
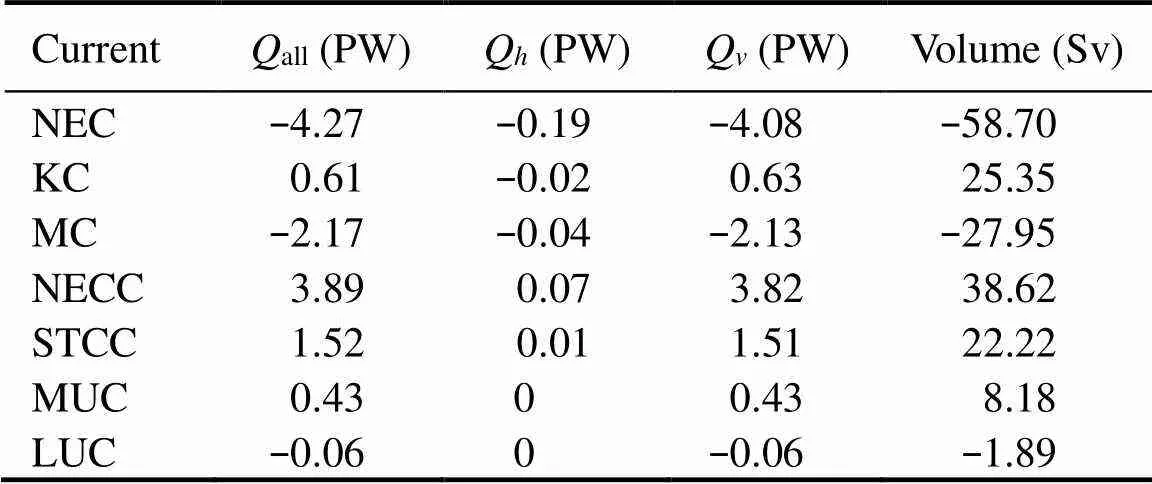
Table 2 Heat and volume transported by main currents
5.3 Discussion
The above analysis shows that the Philippine Sea is losing heat to the outside due to the presence of two strong western boundary currents. Aside from the flows, the air also has an effect on the heat change of the ocean. The air-sea heat flux should thus be analyzed. The net air-sea heat flux is extracted from the Pacific Ocean Analysis Data provided by the National Centers for Environmental Prediction. It has a spatial resolution of 1˚×1.5˚ and a time interval of 7 days. The net heat exchange is also averaged for the observation period (Fig.9), with the unit of Langleys−1(1Langleys−1=41868Jm−2s−1=41868Wm−2). Apparently, most regions in the northwest Pacific exhibit negative heat flux, which means that heat is lost from the ocean to the air. The phenomenon is in accordance with the view that subtropical Pacific loses heat to the air in fall and winter (Jiang and Zheng, 1997; Liu, 2004; Wen and Liu, 2006). The surface integral of the enclosed observing area shows that the heat released to the air from the sea amounts to 0.05PW, which is far lower than 1.45PW, and is transported outwards by currents.
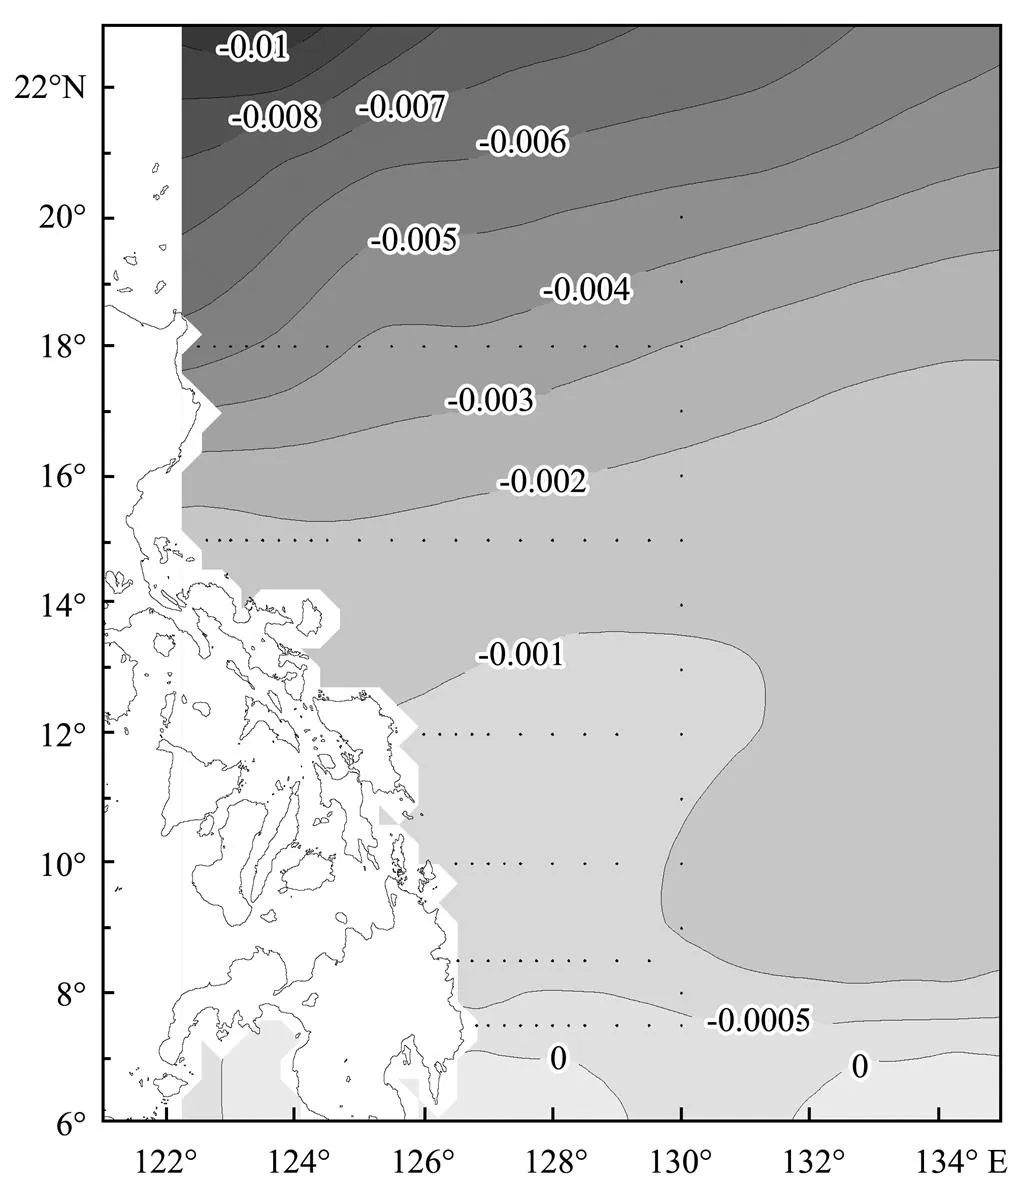
Fig.9 Net air-sea heat flux (unit: Langleys−1).
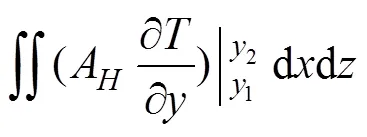
The results show the absolute heat lost in this region during fall. Thus, further analysis and discussions are conducted. A well-known heat balance equation is shown as (5) (Hu, 2003). The left-hand side indicates the rate of heat change in a cuboid box. On the right-hand side, the first term represents the air-sea heat exchange, the second is the heat transport by currents, and the last is horizontal heat diffusion. Fig.10 provides the simplified reference boundaries. Hu (2003) verified that horizontal heat diffusion had little influence on the general heat change in the tropical Indian Ocean for 10 years. Thus, we also assume that horizontal heat diffusion is small enough and out of consideration in the study. Therefore, only the air–sea heat exchange and heat transport by currents need to be considered. As a result, they cause a negative value on the left-hand side. By calculation, the value of ∂/∂is −0.75℃mon−1, which means the water temperature in the large box decreases 0.75℃ in one month. The decrease is proved by the average SST change (Fig.11). SST data are the optimally interpolated monthly product provided by NOAA, with a spatial resolution of 1˚×1˚. The temperature is reduced by about 0.5℃ in October and 1℃ in November, with an average value of 0.75℃mon−1. The result agrees well with our analysis. In the region of the Western Pacific boundary currents, surface cooling reflects the oceanic heat loss.

Bryden(1991) concluded that both the mass and heat were delivered in the upper 720m when he analyzed the heat flux through the transpacific section at 24˚N. Fig.12 shows that in the western boundary region of the NP, the heat transport is nearly confined in the upper 500m, which is somewhat shallower than that at the transpacific section. However, the volume transport is more or less confined to the upper 1100m.
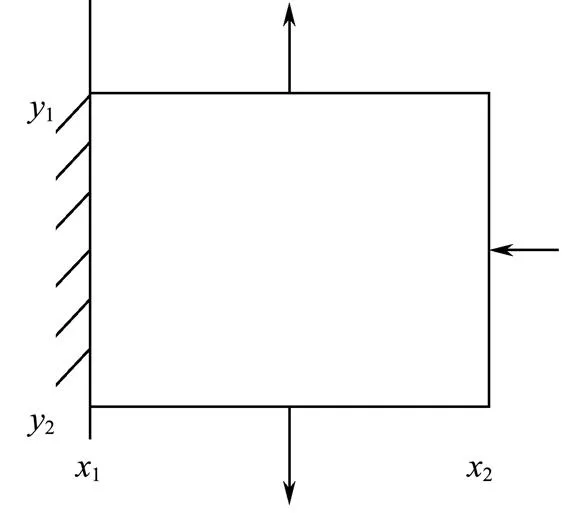
Fig.10 Simplified boundary.
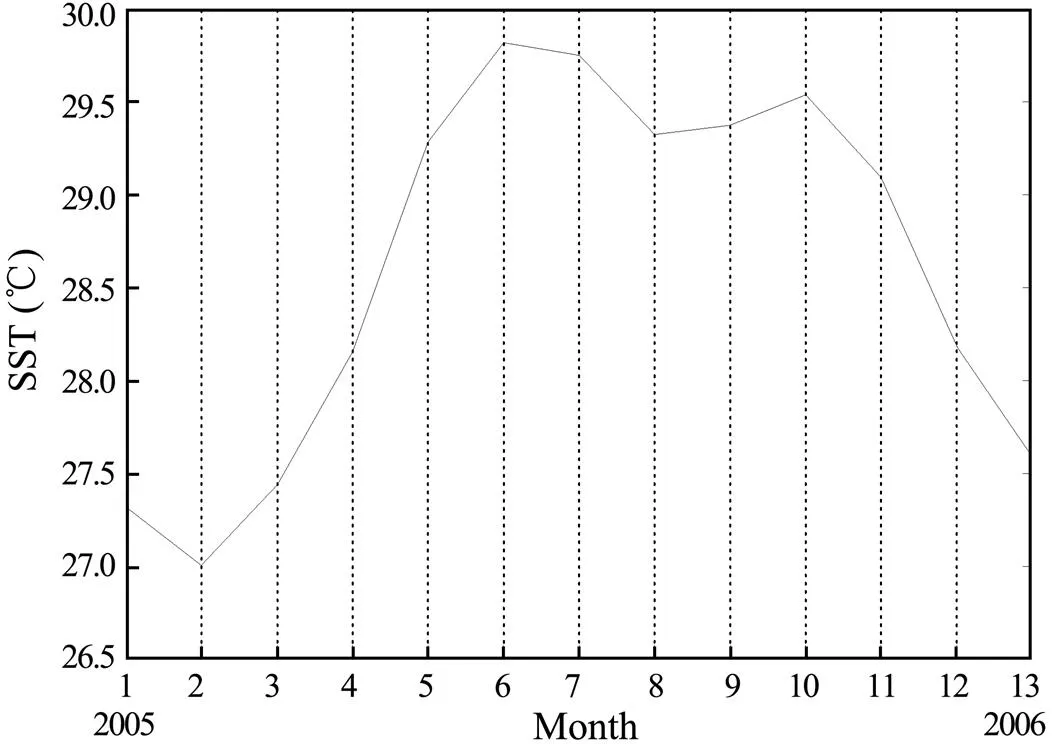
Fig.11 Monthly change of SST during 2005.
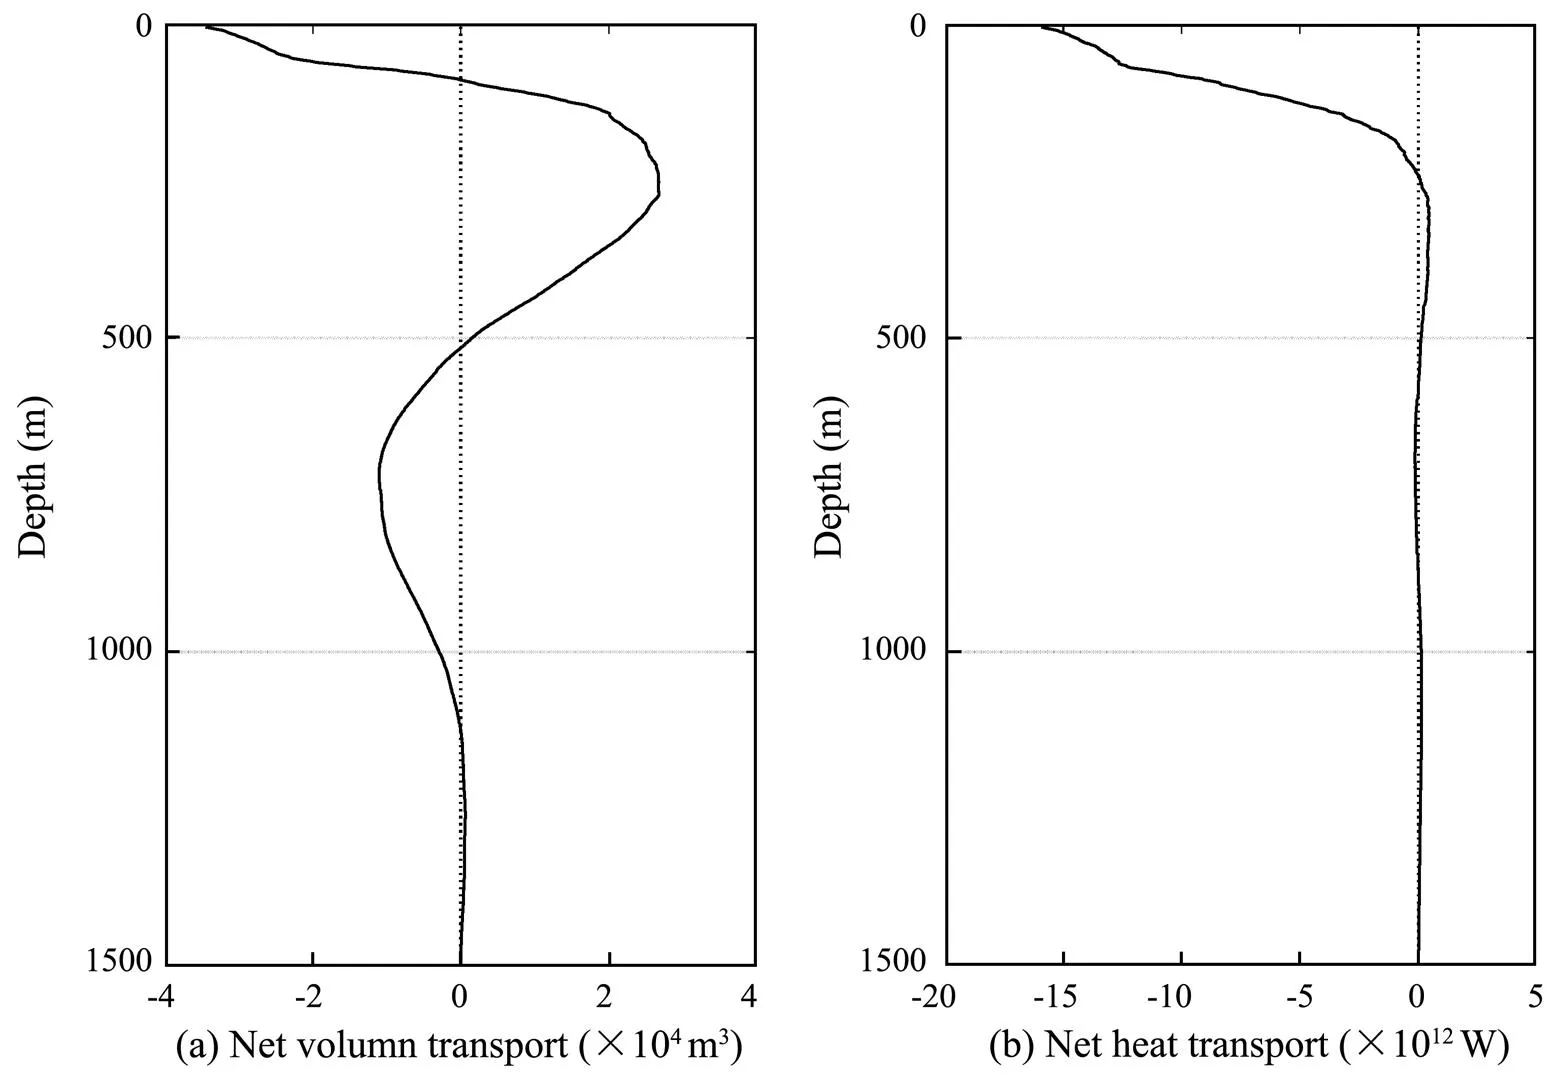
Fig.12 Vertical change of mass and heat transport.
6 Summary
High-resolution hydrographic data were used to investigate the currents and heat transport in the Western Pacific east of the Philippines. Three sections, namely, 130˚E, 18˚N, and 7.5˚N, form a three-dimensional enclosed box. Water mass distribution is described on the basis of T-S characteristics. Geostrophic flows are calculated and described systematically, including the NEC, KC, and MC. The heat budget and its influence on this region are estimated according to the flow velocity, temperature, and air-sea heat flux.
In the tropical Pacific, four water masses above 2000m are located between 130˚E and the Philippine coast. NPTSW, NPSSW, and NPIW all deepen northward. The movement of NPSSW and NPIW mainly creates KC and MC, respectively, and NPIW has the minimum salinity among all intermediate water masses globally. AAIW, which comes from the South Pacific, is carried by the MUC.
Velocity distributions on all related sections were discussed in turn to reveal a three-dimensional current structure (relative to 1500db). Almost all currents in the tropical north Pacific were examined, including the equatorial countercurrent and undercurrent below the NEC, KC, and MC. Most velocities are higher when compared with the annual averaged calculation (Qu, 1998), such as MC, which is over 190cms−1onshore. All currents may become stronger during fall. However, more long-term observations are needed to verify this idea.
The transports above the 1500db across the outermost box, enclosed by the sections at 130˚E, 7.5˚N, and 18˚N, are 58.7Sv westward, 31.81Sv northward, and 26.11Sv southward, respectively. The balance is better than 1Sv. In this study, finding an exact balance between the NEC transport and the sum of KC and MC is difficult because the transport of NEC is far larger than the other two. In addition, many meridional flows and eddies occur in this region aside from the KC and MC; the overall budget is related to all of these flows and eddies.
A detailed analysis of the layered circulation was conducted. In the upper 500m, the transport is cyclonic, thereby indicating the location of ME. Below 500m, an anticyclone extending to 1500m is present, which agrees well with MAE. MUC is located near the western boundary of MAE. Whether MUC is actually a part of MAE is yet to be determined.
The heat transport is calculated directly based on the geostrophic flow. As a whole, 1.45PW of heat is carried away from the boundary current source region. At the same time, the ocean loses heat to the air at the surface according to the net air-sea heat exchange data, and the area-integrated air-sea heat transfer is −0.05PW (‘−’ means the ocean losing heat), which is obviously smaller than the net transported by the currents. As a result of heat loss both at the surface and to the nearby ocean areas, the temperature of seawater decreases by 0.75℃per month in October and November. The change in SST during the observed period proved this trend. Furthermore, the net heat transport in the studied region is almost limited to the upper 500m.
Acknowledgements
The study is supported by the National Natural Science Foundation of China (Nos. 41676004, 41506034, 41376001, 41376038, 41806123, 41430963), the Basic Scientific Fund for National Public Research Institutes of China (No. GY0213G02), the National Major Scientific Research Program (No. 2015CB954300), and the National Science and Technology Major Project (No. 2016ZX05057015).
Bryden, H. L., and Hall, M. M., 1980. Heat transport by currents across 25˚N latitude in the Atlantic Ocean., 207 (4433): 884-886.
Bryden, H. L., Roemmich, D. H., and Church, J. A., 1991. Ocean heat transport across 24˚N in the Pacific., 38: 297-324.
Carissimo, B. C., Oort, A. H., and Vonder, H. T. H., 1985. Estimates of the meridional energy transports in the atmosphere and ocean., 15: 82-91.
Chao, J. P., Chen, Z. S., and Wang, Z. S., 1993.. Ocean Press, Beijing, 256pp (in Chinese).
Ding, L. M., 2000. Analysis of air-sea heat exchange in the subtropical waters of the Northwest Pacific Ocean., 11: 122-127 (in Chinese with English abstract).
Hall, M. M., and Bryden, H. L., 1982. Direct estimates and mechanisms of ocean heat transport., 29 (3): 339-359.
Hsiung, J., 1985. Estimates of global oceanic meridional heat transport.,15: 1405-1413.
Hsiung, J., Newell, R. E., and Houghtby, T., 1989. The annual cycle of oceanic heat storage and oceanic meridional heat transport., 115: 1-28.
Hu, D., and Cui, M., 1989. The western boundary current in the far-western Pacific Ocean.. ORSTOM, Noumea, New Caledonia, 24-30.
Hu, R. J., 2003. Study on the heat budget and meridional circulation in the tropical Indian OceanPhD thesis. Ocean University of China, Qingdao (in Chinese).
Hu, R. J., Liu, Q. Y., and Meng, X. F., 2005. The seasonal and interannual variabilities in the meridional heat transport and heat budget in the northern Indian Ocean.,35 (3): 363-369 (in Chinese with English abstract).
Jiang, Q. R., and Zheng, D. Y., 1997. Seasonal variation of sea surface heat flux budget in North Pacific and its relation to SST.,17 (2): 143-150 (in Chinese with English abstract).
Li, X. L., 1993a. Water mass features in the upper part of section along 130˚E in western tropical Pacific Ocean and their responses to El Niño and anti-El Niño., 12 (5): 9-14 (in Chinese with English abstract).
Li, X. L., 1993b. Water mass features in the upper part of section along 18˚20΄N in western tropical Pacific Ocean and their responses to El Niño and anti-El Niño.,15 (4): 12-18 (in Chinese with English abstract).
Li, X. L., 1993c. Water mass features in the upper part of section along 8˚N in western tropical Pacific Ocean and their responses to El Niño and anti-El Niño., 12 (1): 41-47 (in Chinese with English abstract).
Liu, Y. Y., Liu, Q. Y., and Pan, A. J., 2004. Seasonal, annual and decadal variations of air-sea heat fluxes in the northern Pacific Ocean.,34 (3): 341-350 (in Chinese with English abstract).
Lukas, R., Firing, E., Hacker, P., Richardson, P. L., Collins, C. A., Fine, R., and Gammon, R., 1991. Observations of the Mindanao Current during the western equatorial Pacific Ocean circulation study., 96: 7098-7104.
Macdonald, A. M., 1993. Property fluxes at 30˚S and their implications for the Pacific-Indian Throughflow and the global heat budget., 98 (C4): 6851-6868.
Nitani, H., 1972. Beginning of the Kuroshio. In:. Stommel, H., and Yoshida, K., eds., University of Washington Press, Seattle, 129-163.
Qu, T. D., and Mitsudera, H., 1999. A climatology of the circulation and water mass distribution near the Philippine coast., 29 (7): 1488-1505.
Qu, T. D., Mitsudera, H., and Yamagata, T., 1998. On the western boundary currents in the Philippine Sea., 103: 7537-7548.
Reid, J. L., 1973. The shallow salinity minima of the Pacific Ocean., 20: 51-68.
Sun, C. H., Liu, Z. H., Tong, M. R., Zhu, B. K., and Xu, J. P., 2007. The application of Argo data to water masses analysis in the Northwest Pacific Ocean., 25 (3): 1-13 (in Chinese with English abstract).
Sun, X. P., 2000. A comparison of characteristics between the subtropical countercurrent, the North Equatorial Current and the North Equatorial Countercurrent in the northwestern Pacific Ocean., 18 (1): 1-12 (in Chinese with English abstract).
Toole, J. M., Millard, R. C., Wang, Z., and Pu, S., 1990. Observations of the Pacific North Equatorial Current bifurcation at the Philippine coast., 20: 307-318.
Trenberth, K. E., and Solomon, A., 1994. The global heat balance: Heat transports in the atmosphere and ocean., 10: 107-134.
Wang, F., Zhang, P., Hu, D. X., and Seidel, H., 2001. Tropical Western Pacific Circulation and its seasonal variation., 46 (23): 1997-2002 (in Chinese).
Wang, J., and Chern, C. S., 1997. On the trajectory of subsurface and intermediate waters in the northeastern South China Sea., 16 (2): 24-41 (in Chinese with English abstract).
Wen, N., and Liu, Q. Y., 2006. Winter ocean-atmosphere interaction in the Northwest Pacific.,37 (3): 264-270 (in Chinese with English abstract).
Yang, Q. X., 2008. Study on the fluxes in the Luzon Strait and turbulent mixing in the South China SeaPhD thesis. Ocean University of China, Qingdao (in Chinese with English abstract).
Yaremchuk, M., and Qu, T. D., 2004. Seasonal variability of the large-scale currents near the coast of the Philippines., 34 (4): 844-855.
Zhang, X. D., Zhang, G. Y., and Tong, K., 2004. Water mass analysis of the source area of Kuroshio., 23 (1): 15-21 (in Chinese with English abstract).
Zhang, Y. H., 2006. The analysis of the subsurface water massesand intermediate water masses of the Tropical Western Pacific and their decadal variation. PhD thesis. Institute of Oceanology, Chinese Academy of Science, Qingdao (in Chinese).
Zhao, Y. P., Chen, Y. L., and Yang, L. S., 1994. The oceanic heat transport in the upper ocean of the northwestern Pacific Ocean in winter.,25 (1): 9-14 (in Chinese with English abstract).
Zhou, H., Xu, J. P., Guo, P. F., and Shi, M. C., 2006. A summary on studies of western boundary current system in the North Pacific Ocean., 24 (2): 49-59 (in Chinese with English abstract).
March 10, 2019;
April 28, 2019;
May 14, 2019
© Ocean University of China, Science Press and Springer-Verlag GmbH Germany 2019
. E-mail: machao@ouc.edu.cn
(Edited by Xie Jun)
 Journal of Ocean University of China2020年1期
- Journal of Ocean University of China的其它文章
- System Reliability Analysis of an Offshore Jacket Platform
- The Mineral Composition and Sources of the Fine-Grained Sediments from the 49.6˚E Hydrothermal Field at the SWIR
- Research Progress of Seafloor Pockmarks in Spatio-Temporal Distribution and Classification
- Application of the Static Headland-Bay Beach Concept to a Sandy Beach: A New Elliptical Model
- Climatology of Wind-Seas and Swells in the China Seas from Wave Hindcast
- Dynamical Control of Asymmetrically Oblique Tidal Currents to the Sedimentary Characteristics and Development of Linear Sand Ridges in the Liaodong Shoal, East Bohai Sea
