Source Evolution and Its Relationship to Climate Change Since the Middle–Late Pleistocene in Laizhou Bay, China
GONG Chuanzhang, LI Guangxue, *, LIU Yong, DING Dong, XU Jishang, MA Yanyan, QIAO Lulu, and WANG Haoyin
Source Evolution and Its Relationship to Climate Change Since the Middle–Late Pleistocene in Laizhou Bay, China
GONG Chuanzhang1), 2), LI Guangxue1), 2), *, LIU Yong1), 2), DING Dong1), 2), XU Jishang1), 2), MA Yanyan1), 2), QIAO Lulu1), 2), and WANG Haoyin1), 2)
1),,266100,2),,,266100,
Through the geochemical analysis of two hundred-meters cores KD4 and ZK3 from Laizhou Bay, in this study, we determined the distribution law and controlling factors of the geochemical elements. We analyzed 24 elements with respect to theirfactors and major principal components, which were combined with the source discrimination functions DFCr/ThandDFCa/Alto obtain the sediment source index and its variation with depth for this area. A comparison of the changes in climate indicators suggests a clear correlation between the source and climate changes. The results show that the Yellow River and surrounding short-term rivers are the main sediment sources in this area. The PC3 of the KD4 core and PC2 of the ZK3 core (., CaO, MnO, SiO2) exhibit significant variations and reflect the relative contributions of Yellow River sources. The deposition process can be divided into six stages: in Phase I (MIS 5c–MIS 5a), the Yellow River formed, and the composition of the Yellow River had a greater influence on the sedimentary composition of the study area. In Phase II (MIS 5a–MIS 3), the sediment sources of the Yellow River and the short-term streams in this area were wavering, with the sediments derived from short-term rivers playing a more important role. In Phase III (MIS 3), with a sharp drop in temperature, the study area was in the process of retreat, and the sediment source changed from the Yellow River to short-term rivers, after which the Yellow River source material remained the main sediment source for the region. A similar process occurred three more times in Phase IV (MIS 3–MIS 2), Phase V (MIS 2–MIS 1), and Phase VI (MIS 1). With changes inclimate, especially during alternating sea-land phases, the sediment source varied in marine-terrestrial-marine phases, and the changes are observed as Yellow River source-surrounding provenance-Yellow River source. However, this process of change is not synchronized with the sea-land strata alternation.
Laizhou Bay; source; geochemistry; Yellow River; climate change
1 Introduction
The Yellow River, China’s second largest river, deposits 1.08 billion tons of sediment in its estuarine area each year. Due to the strong interaction between the land and sea, this area has undergone frequent changes in its environments throughout geological history, and the sediment accumulation process is closely related to changes in the paleoenvironment and paleoclimate. Since the Yellow Ri- ver was created, sediment input has been the main source of offshore sediments, with many scientists having studied the surrounding environment and consider the Yellow River to be a stable source (Fralick and Kronberg, 1997; Hao., 2010; Perri., 2011). However, some research on the evolution of Yellow River material over geological history, such as the study conducted by Yang and others on the Yellow River Delta on two petrochemical cores, suggests that the depth of Yellow River material is 233m, which is equivalent to the early Pleistocene (Yang., 2001). Xue and others conducted comprehensive analyses of many cores from the west bank of the Bohai Sea, the northern Jiangsu old Yellow River, and the South Yellow Sea and detected the existence of the Yellow Riverduring the late Pleistocene (11.4kyr) and the Yellow River Delta around 7kyr (Xue., 2004). Wang. (2015) reconstructed a five-stage marine transgression-regression history and elucidated the coastal response to relative sea level change during the Holocene in the western coastal lowland of Bohai Bay. Xu. (2015) used cores 20m in length to study the strata and morphological evolution of the ancient Yellow River Delta since the Last Glacial Maximum (LGM). Song. (2018) used grain size, li- thological characteristics, and major and rare earth elemental compositions to identify four sedimentary units since the Holocene Transgression. However, these studies lack either resolution or time span, and as yet there is no relevant research on the paleoclimate, paleovegetation, changes in the source of sediments, or their possible underlying mechanisms since the MIS5.
Many studies have been conducted using sediment- source determination methods based on geochemical com- position, which have been widely applied to investigate the provenance of rivers and other water bodies. The identified indicators include rare earth element contents (Yang., 2003; Jiang., 2009), other element contents (Ca, Rb, Ti,.) (Lan., 2007), element ratios (Lee., 1992; Kim., 1998; Cho., 1999; Yang., 2004; Yang and Youn,2007), and various chemical parameters including the Chemical Index of Alteration (CIA) and Chemical Index of Weathering (Sun., 2011). Yellow River sediments mainly originate from the Loess Plateau, with the chemical composition, which is similar to loess, having varied little throughout the Quaternary (Gu., 2000). Lü. (2016) used the geochemical compositions of the southern Yellow Sea sediments to reconstruct changes in the weathering and erosion of their source regions. Armstrong-Altrin. (2015) geochemically analyzed 10 piston sediment cores to constrain the provenance and depositional history of continental-slope sediments in the southwestern Gulf of Mexico. Singh. (2016) reported the geochemical record of two drill-sedi- ment cores from a buried channel in the Ghaggar Plains of NW India, which the author used to infer variations in provenance, paleoclimate, and paleovegetation in the locality during the late Quaternary. Over geological history, the chemical compositions of the Yellow River sediments are considered to have remained relatively stable.
The aim of this study was to determine the sediment source of the Yellow River estuary since the late Pleistocene on the basis of high-resolution geochemical data from cores KD4 and ZK3 (Fig.1) and to explore the relationship between the estuary’s genetic changes and paleoclimatic evolution.
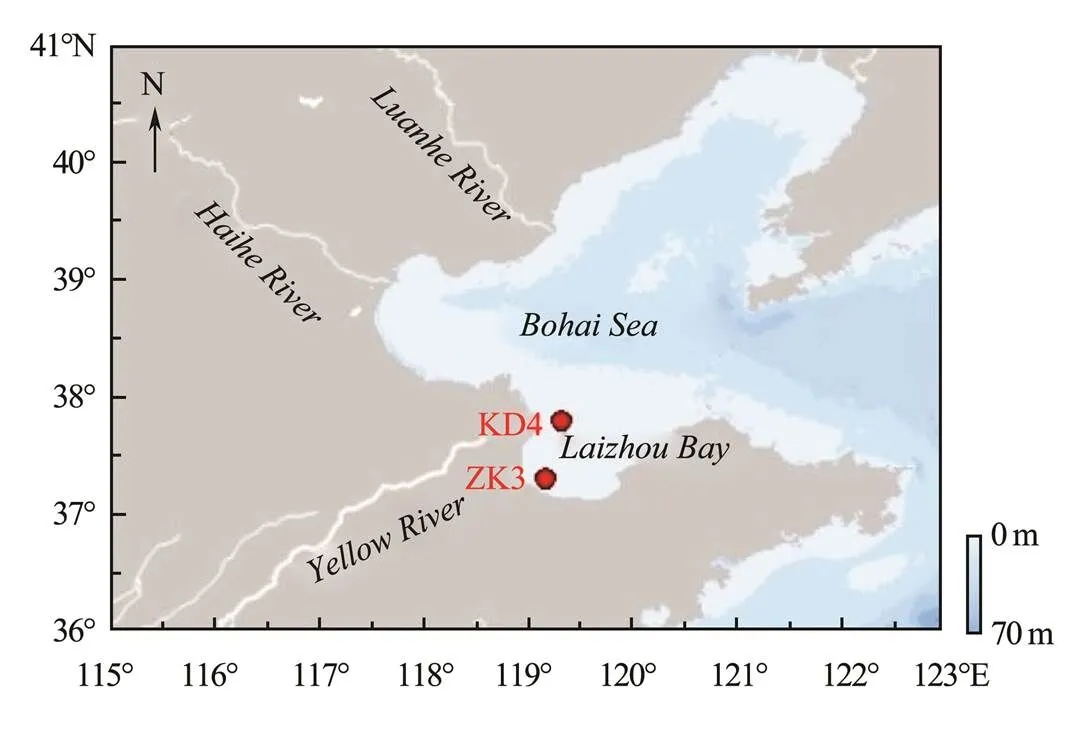
Fig.1 Locations of cores KD4 and ZK3 in Laizhou Bay, Bohai Sea, and the main river and surrounding area of the study site.
2 Materials and Methods
For this study, cores KD4 and ZK3 were obtained in June 2011 from the Yellow River Estuary. Core KD4 was obtained at a water depth of 5.5–6.6m at the coordinates 37˚47΄45˝N, 119˚19΄10˝E. Core ZK3 is a full-core drilling obtained from the west bank of Laizhou Bay at a water depth of 5.2–6.6m at the coordinates 37˚17΄35˝N, 119˚10΄04˝E. For core KD4, the drilling depth was 100m, the sampling length was 88m, and the core rate was 88%. For core ZK3, the drilling depth was 97.93m and the core rate was 88.54%.
To determine particle sizes, we used a British Mastersizer 2000 laser particle size analyzer at the Qingdao Institute of Marine Geology. The sampling interval was 5cm. Each sample consisted of approximately 0.5g, to which 10% hydrogen peroxide (H2O2) solution was added and kept for 24h to remove organic matter. Then, dilute hydrochloric acid (HCl) was added to initiate a full reaction to remove biological shells. After machine measurement, we calculated the average particle size using the Fokker- Ward formula.
We analyzed the geochemical elements at the Key La- boratory of Submarine Geosciences and Prospecting Te- chniques, MOE, China. The sampling interval was 50cm. We obtained 174 samples from core KD4 and 191 samples from core ZK3. X-ray fluorescence (XRF) tests were performed using a SPECTRO XEPOS desktop polarized XRF spectrometer. We used the TurboQuant-Geo as the testing method with the standard material GBW07314, and found the test accuracy to be consistent with the standard substance. During the test, we introduced high- purity helium. The major oxides analyzed included SiO2, Al2O3, Fe2O3, FeO, MgO, CaO, Na2O, TiO2, P2O5, and MnO, along with trace components including 14 elements: V, Cu, Ni, Pb, Zn, Cr, As, Ba, Sr, Ga, Rb, Th, Nb, and Zr.
For the age analyses, we used light-emitting dating (KD4) and AMS14C dating (ZK3). The light-emitting dating ana- lyses were performed at the Ministry of Land and Resources Marine Geology Experimental Testing Center, where we took 10 samples from core KD4 and obtained available data from a total of five. Table 1 shows the dating results. The AMS14C dating was conducted at the United States Beta Company. For these tests, we selected benthic foraminifera mixed species in the upper marine strata of core ZK3 and obtained and calibrated a total of three layers of effective dating values using the CALIB program for calendar age, the corrected results of which are shown in Table 2.

Table 1 Dating results of KD4-core light luminescence analyses
The geochemical element formation and evolutionary processes in sediments are very complex and affected by a variety of factors, which makes it difficult to establish a clear rule for the analysis of data from a single geochemical element. Therefore, we conducted a multivariate statistical analysis of the geochemical elements. To do so, we used SPSS 20 software and performed-mode clustering and-mode factor analyses (Davis and Sampson, 1986; Usunoff and Guzmán-Guzmán, 1989; Yang., 2002; Xu., 2012).
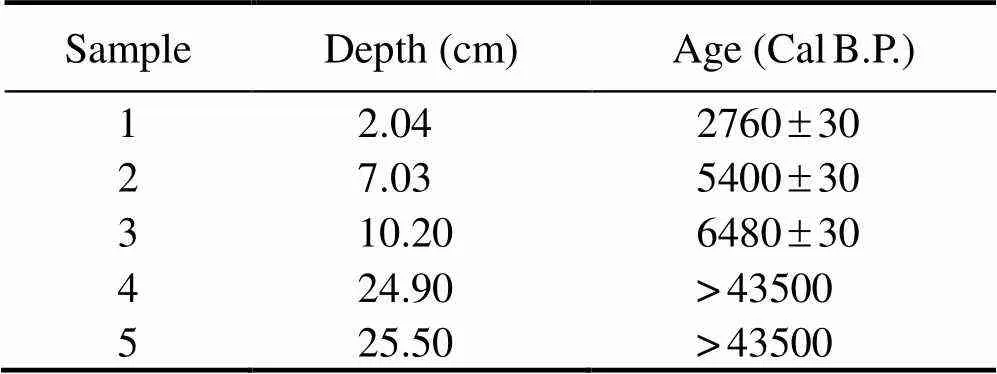
Table 2 Dating results of ZK3-core AMS14C analyses
With consideration of previous sediment-source research, as indicators, we used the sediment-source discriminant function and the following calculation method (Yang and Li, 2000; Lan., 2008):

In marine sediments, Al has a stable nature and is enriched in fine-grained sediments. Therefore, the ratio of Al to the element content in the sediments can be used to eliminate the effects of sediment size on the element contents (Kremling and Streu,1993; Cho., 1999). The dis- criminant function indicates the degree of material proximity to the known river source in the study area. The closer is the value of the discriminant function to 0, the closer is the chemical composition of the sediments to that of the target sediments.
Researchers have conducted several studies on the use of geochemical elements as indicators of climate change. The indicators commonly used include the chemical wea- thering index CIA and SiO2/Al2O3ratio, which measure the degree of weathering of the sediments and indicate che- mical brittleness during the differentiation process, and the Rb/Sr and Sr/Ba ratios, which reflect the salinity of the sedimentary water environment. However, because the che- mical elements are located in different depositional environments, they exhibit different natures, so the appropriate climate change indicators must be selected for analysis according to the specific situation at hand.

CaO*indicates that this material resides only in silicate minerals, and a correction must be made for carbonates and phosphates. The phosphate correction is based on the formula CaO*=CaO−(10/3×P2O5), and if CaO>Na2O, we consider the Na2O content to be the CaO in silicate minerals. Otherwise, no carbonates correction is required (McLennan., 1993).
3 Results
Existing research results for KD4 and ZK3 indicate that the chemical-composition distributions of these cores are well stratified and can be vertically divided into 10 intervals according to the variation in their trace element contents, which is equivalent to the evolution of each depositional environment. The process of division is based on chronostratigraphic and foraminiferal data. Since the chronological data of the ZK3 core is concentrated at the top of the sample and the density of the chronological data of the KD4 column is low, we referred to the chro- nological and stratigraphic data of the BC1 and S3 cores. In addition to the core lithologs, we also considered the difference in the species of foraminifera (data not published) to distinguish the marine and land environments. From bottom to top are the following layers: terrestrial layer L5, marine layer H5, land layer L4, and marine layer H4 (HL), which correspond to the last interglacial period, rising temperatures, and area transgression when flooded by seawater. During the transgression period, two climate fluctuations occurred (corresponding to the top of deep-sea oxygen-isotope-curve three, where MIS 5a, MIS 5c, MIS 5e, and MIS 5a were not exposed), which formed two sets of marine layers and a corresponding terrestrial layer. Terrestrial layer L3 represents the last glacial global cooling, sea level fall, and acceptance of continental deposition. There were also two relatively warm sea level-rise periods during the last glacial period, which formed the Bohai Sea invasion layer H3 and correspond to the continental strata layer L2 and Xianxian transgressive layer H2. During the last ice age, the continental sedimentary strata L1 layer was deposited. Subsequently, when the global temperature increased, this area was covered by seawater and marine layer H1 was deposited.
Due to the order of magnitude difference in the contents of the elements, we normalized the data and conver- ted the sample contents to values from 0–1 to avoid ana- lysis error in our statistical analyses.
The core geochemical elements were analyzed using the-type cluster analysis available in SPSS software from which the two cores of the main trace elements formed four clusters, representing different elemental natures with different distribution characteristics and laws. Figs.2 and 3 show the classification of and vertical changes in the elements.
Core-KD4 deposits can be divided into four groups, with Group A containing the main elements CaO, MnO, and Fe2O3and trace elements V, Zn, Ni, Th, and Cu, wherein CaO and MnO belong to A-1 and the remaining elements to A-2. Group B includes the major oxides Al2O3, P2O5, K2O, TiO2, SiO2, and MgO and trace elements Ga, Rb, Cr, Sr, and Nb, wherein Al2O3, P2O5, K2O, and SiO2belong to the B-1 moiety; Ga, Rb, Cr, and TiO2belong to the B-2 moiety; and MgO, Sr, and Nb belong to the B-3 moiety. Group C includes the major oxide Na2O and trace elements Ba and Zr. Group D includes trace elements Pb and As.
The elements of Group A show characteristic susceptbility to the redox effect, and these elements are also more sensitive to environmental changes. The CaO and MnO combinations in the A-1 moiety indicate a higher calcium carbonate content in the Yellow River source se- diments. The MnO elements are easily oxidized to enrich carbonate formations, which reflect the effects of sedi- mentary sources. The A-2 moiety is essentially an irongroup whose members have a similar chemical nature. The ionic radius of Cu is close to that of iron, which makes it easy to classify with the same replacement. Therefore, Cu belongs to a group of iron elements, which means the con- tent change is related to the oxidation of the depositional environment. Group B elements in the sediment are controlled by particle size, which is also considered to be the ‘granularity control rate’. Al2O3and SiO2in B-1 are typical elements controlled by particle size, and the distribution of K2O is controlled by Al2O3. P2O5belongs to this group, which indicates that P2O5is mainly affected by particle size, but its variation differs from that of other elements. This means that P2O5is simultaneously affected by other factors, such as biological and biochemical effects. In B-2, the combination of Ga, Rb, Cr, and TiO2and the distribution of Ga, Rb, and Cr are controlled by terrestrial factors. Because of the stable nature of TiO2, it is considered to be representative of terrestrial substances, in which the elemental contents generally increased with a decrease in particle size. The combination of MgO and the Nb elements in the B-3 moiety also indicate that the elemental content increases with decreases in the average particle size. The existence of Sr is controlled by MgO, and the Sr distribution is mainly present in MgO-con- taining minerals in a dispersed state. A combination of Na2O, Ba, and Zr elements are in Group C. Ba is autogenous, and Na2O and Zr are of the same group, which indicates that these two elements are not obviously controlled by land but mainly embody marine biological effects. There are only two elements in Group D, Pb and As, which indicates that these two elements are mainly affected by the local enrichment in sand in this area. This behavior differs significantly from that of other elements, and Pb and As can be taken as geochemical indicators of possible climatic events during geological history.
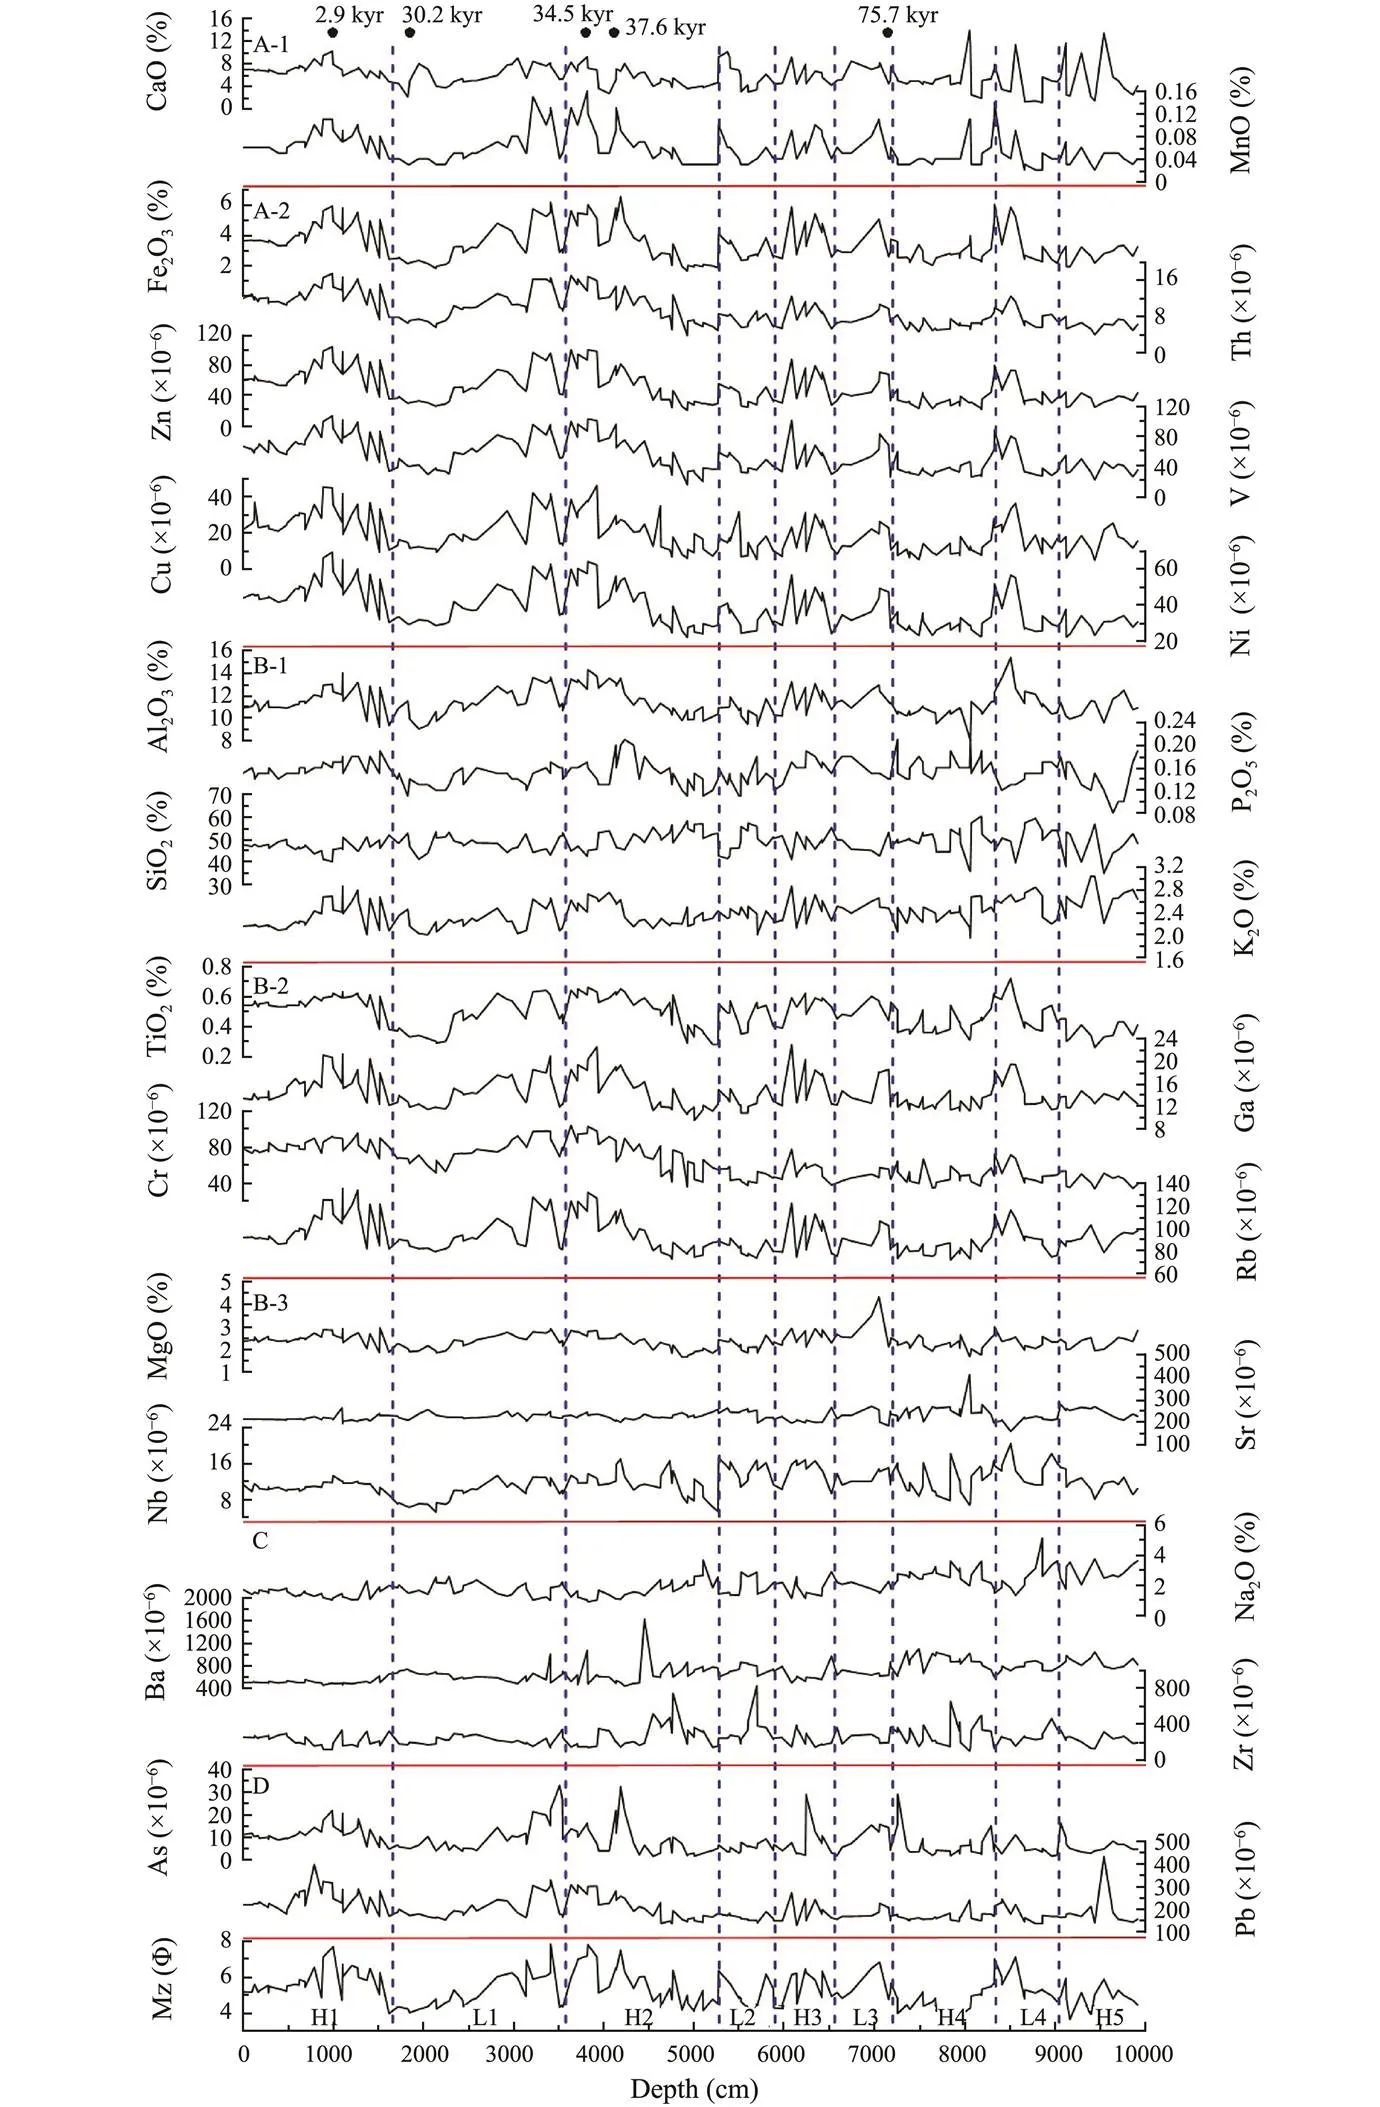
Fig.2 Core-KD4 deposits: changes in major oxides and trace element contents with depth. The major oxide content is presented as a % and the trace element content in ×10−6. (A) An element marked by redox; (B) elements controlled by particle size and terrestrial debris; (C) elements affected by marine self-action; and (D) elements affected by other factors. The right side (Mz) is the depth of the corresponding average particle size. Stratigraphic division results are from Gong et al. (2014).
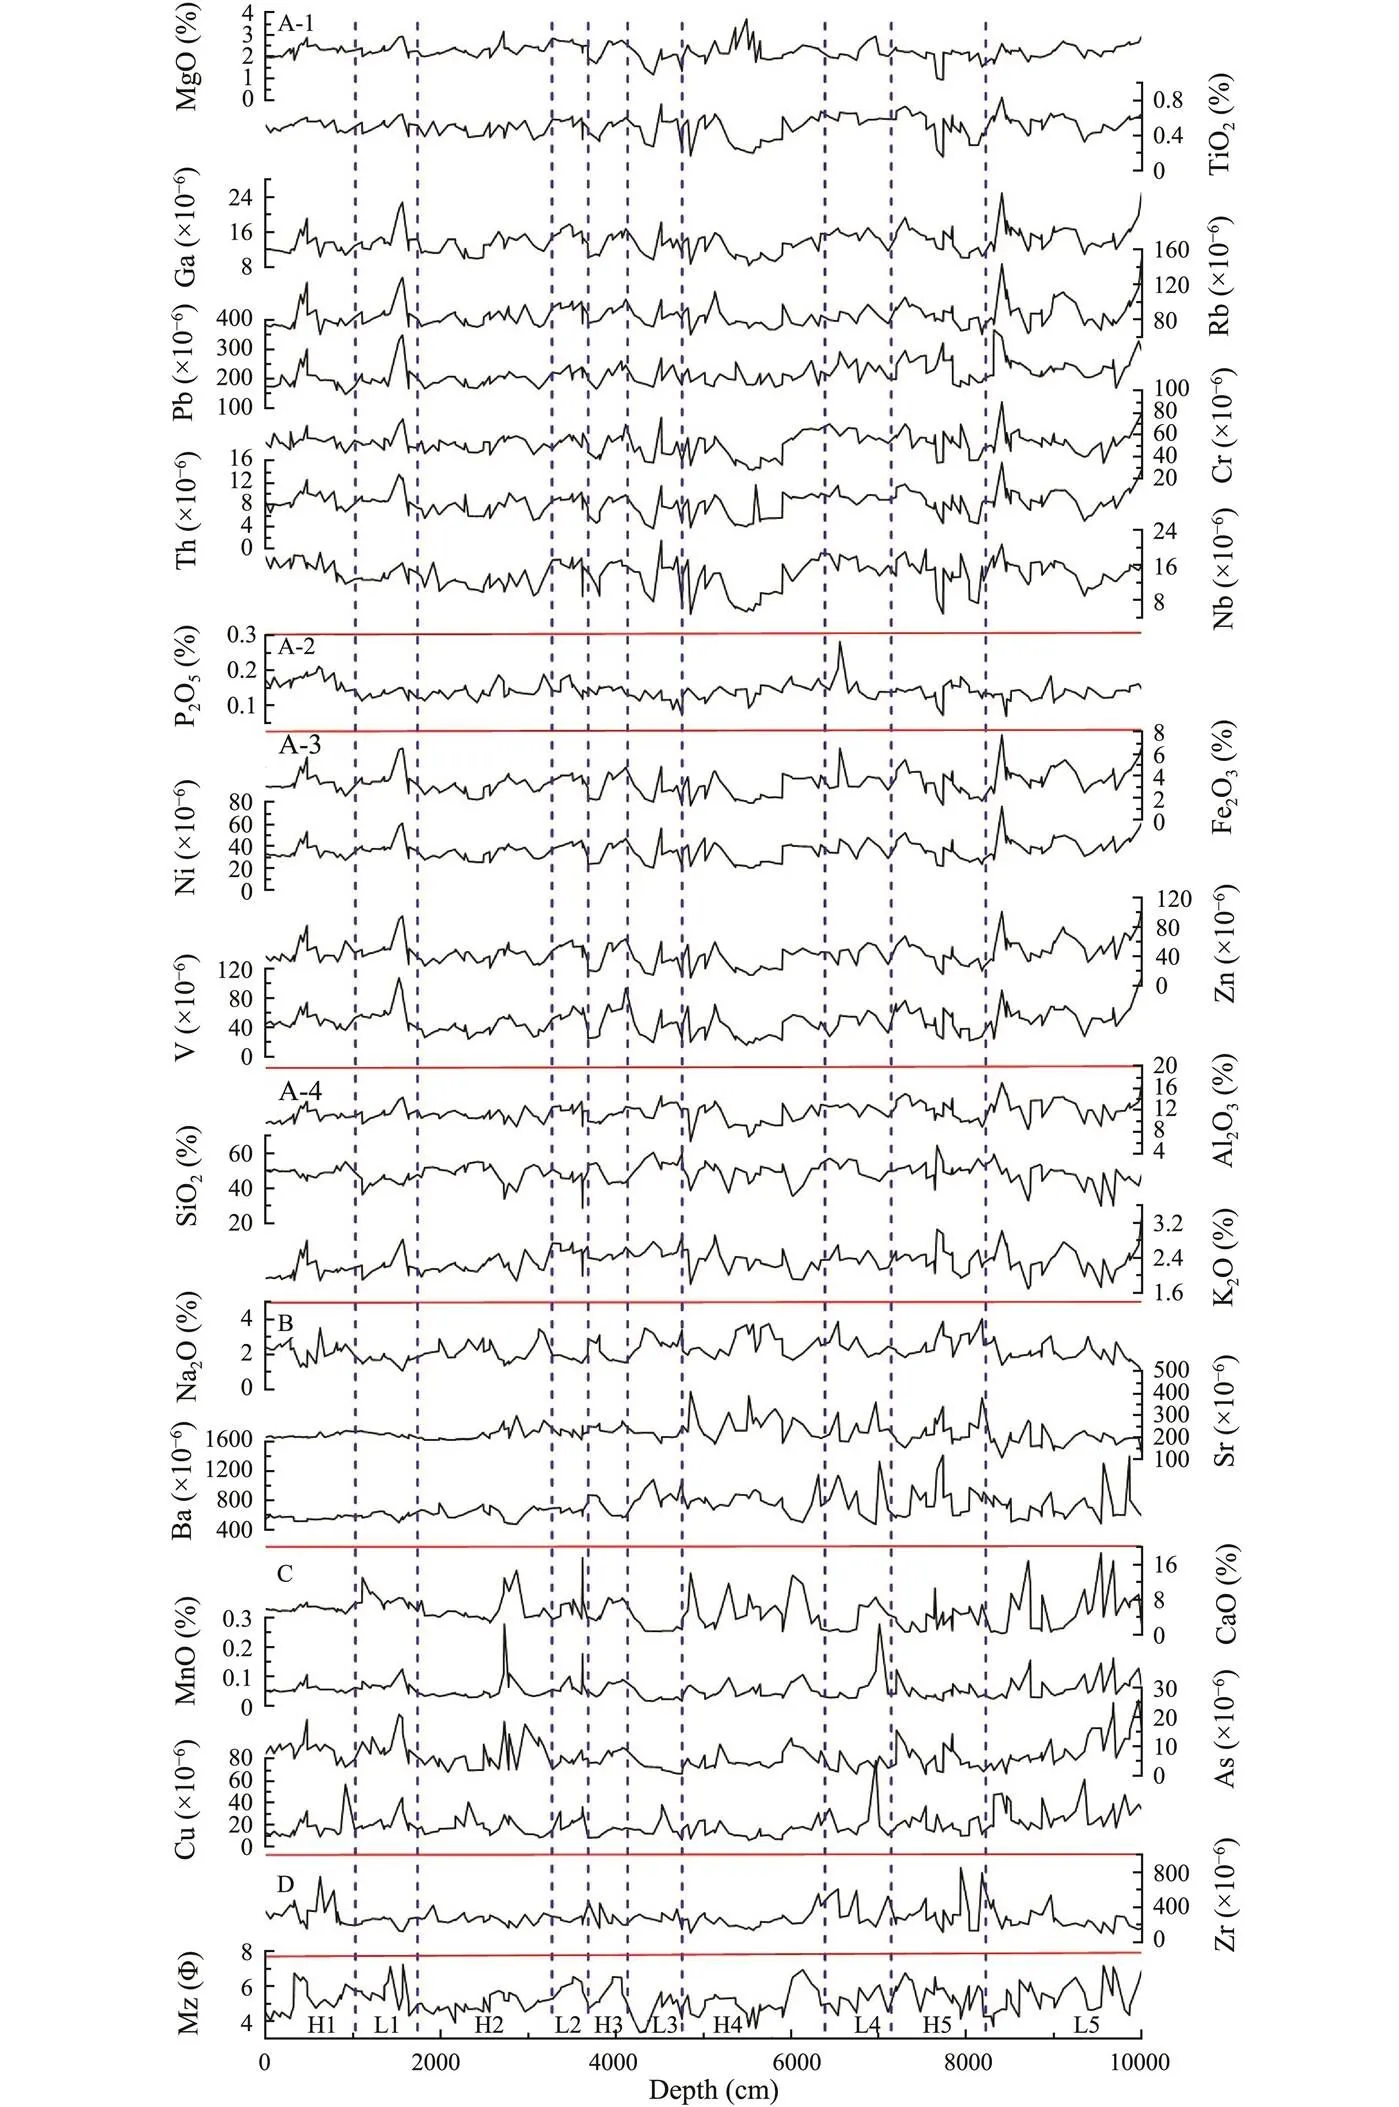
Fig.3 Core-ZK3 deposits: changes in major oxides and trace element contents with depth. The major oxides content is presented as a % and trace element content is in ×10−6. (A) Elements obviously controlled by particle size; (B) elements affected by the chemical action of marine authigenic sediments; (C) elements affected by the redox effect; and (D) elements affected by other complex factors. The right side (Mz) is the average particle size of the geochemical sample, which corresponds to depth. The stratigraphic division results are taken from Gong (2015).
The results of the ZK3 core analysis show some similarities with those for core KD4, with some obvious differences. The results can be divided into four groups: Group A includes the main elements Al2O3, SiO2, K2O, MgO, Fe2O3, P2O5, and TiO2and trace elements V, Ni, Cr, Pb, Zn, Rb, Nb, Th, and Ga. Elements MgO, TiO2, Ga, Rb, Pb, Cr, Th, and Nb belong to the A-1 moiety; P2O5belongs to A-2; Fe2O3, Ni, Zn, and V belong to the A-3 moiety; and Al2O3, SiO2, and K2O belong to A-4. Group B contains Sr, Ba, and Na2O elements. Group C contains CaO, MnO, As, and Cu elements. Group D contains only Zr. Overall, Group A elements respond to the control of the content of geochemical elements by sediment size, and there is not much difference between the chemical composition of the internal components of the reaction of the geochemical properties and those of core KD4. The difference is generally that the control of the core ZK3 elements by particle size is greater than the effect of the elemental properties on the content. In other words, this class of elements is still affected by redox, self-action, clay adsorption, and so on, which is reflected in the elemental group. This indicates that the combination of elements is basically the same. Overall, the role of granularity is a major controlling factor. Group B elements include Sr, Ba, and Na2O, which are similar to the Group-C elemental combination in core KD4 and reflect the reaction effect on oceanic self-deposition chemicals. The com-bination of Group-C elements corresponds to the A-1 moiety in core KD4, which reflect the redox effect. The Cu and As elements exhibit different change trends, which may be affected by complex factors and tend to be enriched in carbonate. Zr is the only element in Group D, which indicates that it is affected by the autogenous che- mistry and terrestrial sand enrichment, and thus, the me- chanism is more complex and will not be discussed here.
4 Discussion
To study the law of elemental enrichment, we performed-type factor analyses of the 24 elements in cores KD4 and ZK3 (Tables 3 and 4, respectively).
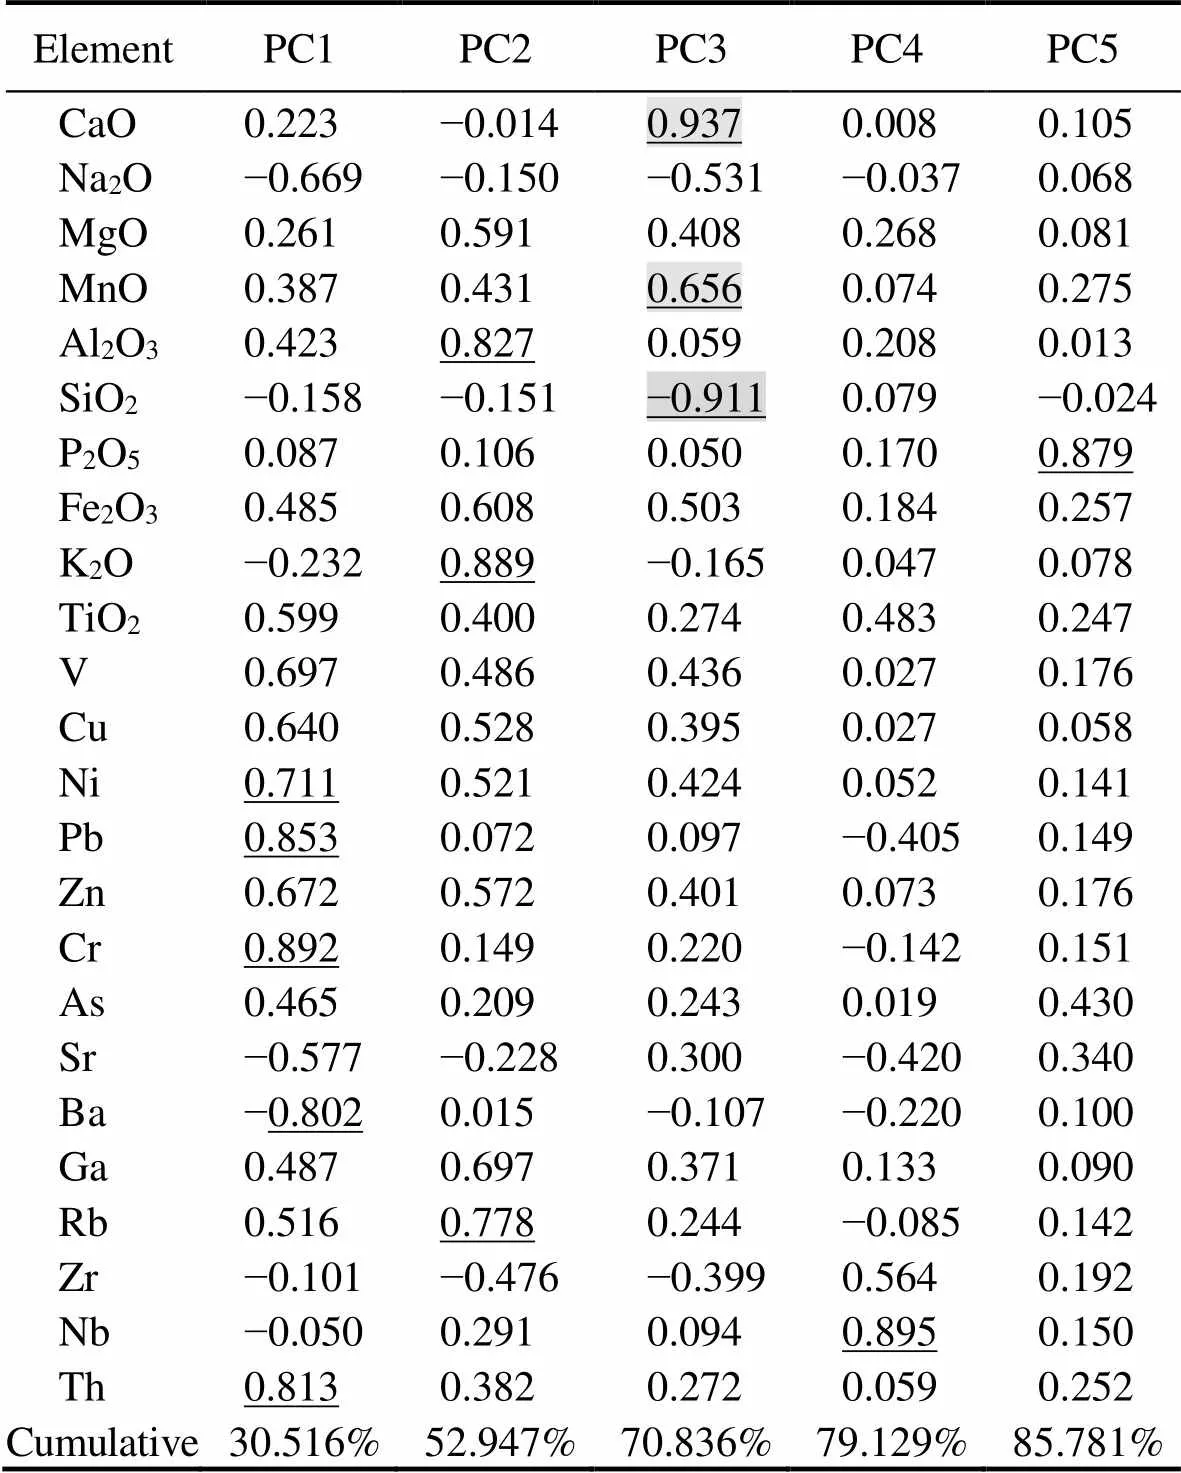
Table 3 Results of principal component analyses for the elements of KD4 core
In the core KD4 analysis results, the cumulative variance contribution rate of factor 1 is 30.52%, which is the highest of all factors. Thus, this is the most important geo- logical factor controlling the distribution of elements in this core. Taking TiO2as a representative factor 1 element, other elements include Na2O, V, Cu, Ni, Pb, Zn, Cr, As, Th, Sr, and Ba, where Na2O, Sr and Ba are the load, and the others are positive loads. The correlation between Ti and particle size is very weak but relatively stable during a geochemical reaction. The epigenetic effects of elements V, Zn, Cr, Pb, Cu, and other trace elements on the geochemical properties are relatively stable, and the correlation coefficients are greater than 0.6, which means that these elements are mainly of terrigenous origin and reflect the impact of terrestrial clastic material. Thus, the core KD4 deposits are likely dominated by terrestrial matter, while also showing the strength of the hydrodynamic con- ditions. The cumulative variance contribution rate of factor 2 is 22.43%, which means that it is an important geological factor controlling the distribution of the elements. Element combinations include MgO and Al2O3, K2O, Fe2O3, as well as Ga and Rb elements. K2O and Fe2O3are easily adsorbed by clay minerals when sediment is dropped into the ocean because of the change in the depositional environment. The sediments alternate between colloidal and granular states, and MgO occurs in both terrestrial clastic minerals and marine sediments. Al2O3is stable during the formation process and is mainly concentrated in clay minerals. Rb is similar to Al and is associated with the weathering process of stable elements. Rb is mainly retained by the adsorption of clay deposits, and factor 2 is determined to be closely related to clay minerals. Factor 2 likely indicates control by particle size. The cumulative variance contribution rate of factor 3 is 17.89%, which is also an important geological factor that controls the distribution of elements. Taking CaO as representative, the elemental combination also includes MnO and a strong SiO2load. Yellow River sediments are characterized by a significantly high Ca content, and the sediment source of the Yellow River is high in carbonate. MnO is easily enriched to form carbonates (Yang., 2002). In terrestrial debris, SiO2is the most abundant element: it has a chemically stable nature, is easily stored in sediment, and its content increases as those of other elements decrease. This may reflect the more negative dilution of SiO2than other elements. Combining the strong positive loading of CaO in the binding factor and the strong loading of SiO2, the role of calcareous biological debris in the depositional process is not obvious. With reference to a previous ana- lysis of elemental characteristics, factor 3 is an important indicator of the Yellow River as a source. The cumulative variance contribution rates of factors 4 and 5 are lower and will not be discussed here.
In the core ZK3 analysis results, the cumulative variance contribution rate of factor 1 is 43.58%, which is far more than that of the other factors, which makes it the most important geological factor controlling the geochemical element content of this core. The elements include Na2O, Al2O3, Fe2O3, K2O, TiO2, V, Cu, Ni, Pb, Zn, Cr, Sr, Ga, Rb, Nb, and Th. Compared with the core KD4 factor analysis results, the elements in factor 1 can be divided into three categories: the first is represented by TiO2, including stable terrestrial elements such as V, Zn, Cr, Pb, and Cu; the second includes load elements such as Na2O, Sr, and others; and the third category includes Al2O3, Fe2O3, and K2O, which are mainly interpreted as factor 1. At the same time, there are varying degrees of responses to factors 2 and 3. Corresponding to core KD4 in the relation of these elements and MgO to the interpretation of clay mineral adsorption, the three types of elements and the KD4 factor analysis results are roughly consistent. Because the core KD4 position is close to that of core ZK3, the overall depositional environment is the same, and the elements of factor 1 are of terrestrial origin. This indicates particle-size control, thus core ZK3 deposits are dominated by terrigenous materials, which indicates the strength of the hydrodynamic conditions. The cumulative variance contribution rate of factor 2 is 16.86%, which indicates that this is an important geological factor controlling the distribution of geochemical elements in the core. The element combination comprises CaO, MnO, SiO2, and As elements, in which SiO2is the load and the other elements are positive loads. There is almost no difference between a factor 2 element and core KD4, with both having a strong positive load containing CaO and SiO2. Thus, factor 2 is an important indicator of the Yellow River. With the weakening of the ocean’s own chemical actions, the impact of the Yellow River on this area increased, and the presence of As elements may be related to the enrichment of the Yellow River. The cumulative variance contribution rates of factors 3, 4, and 5 are low, and are not considered here.
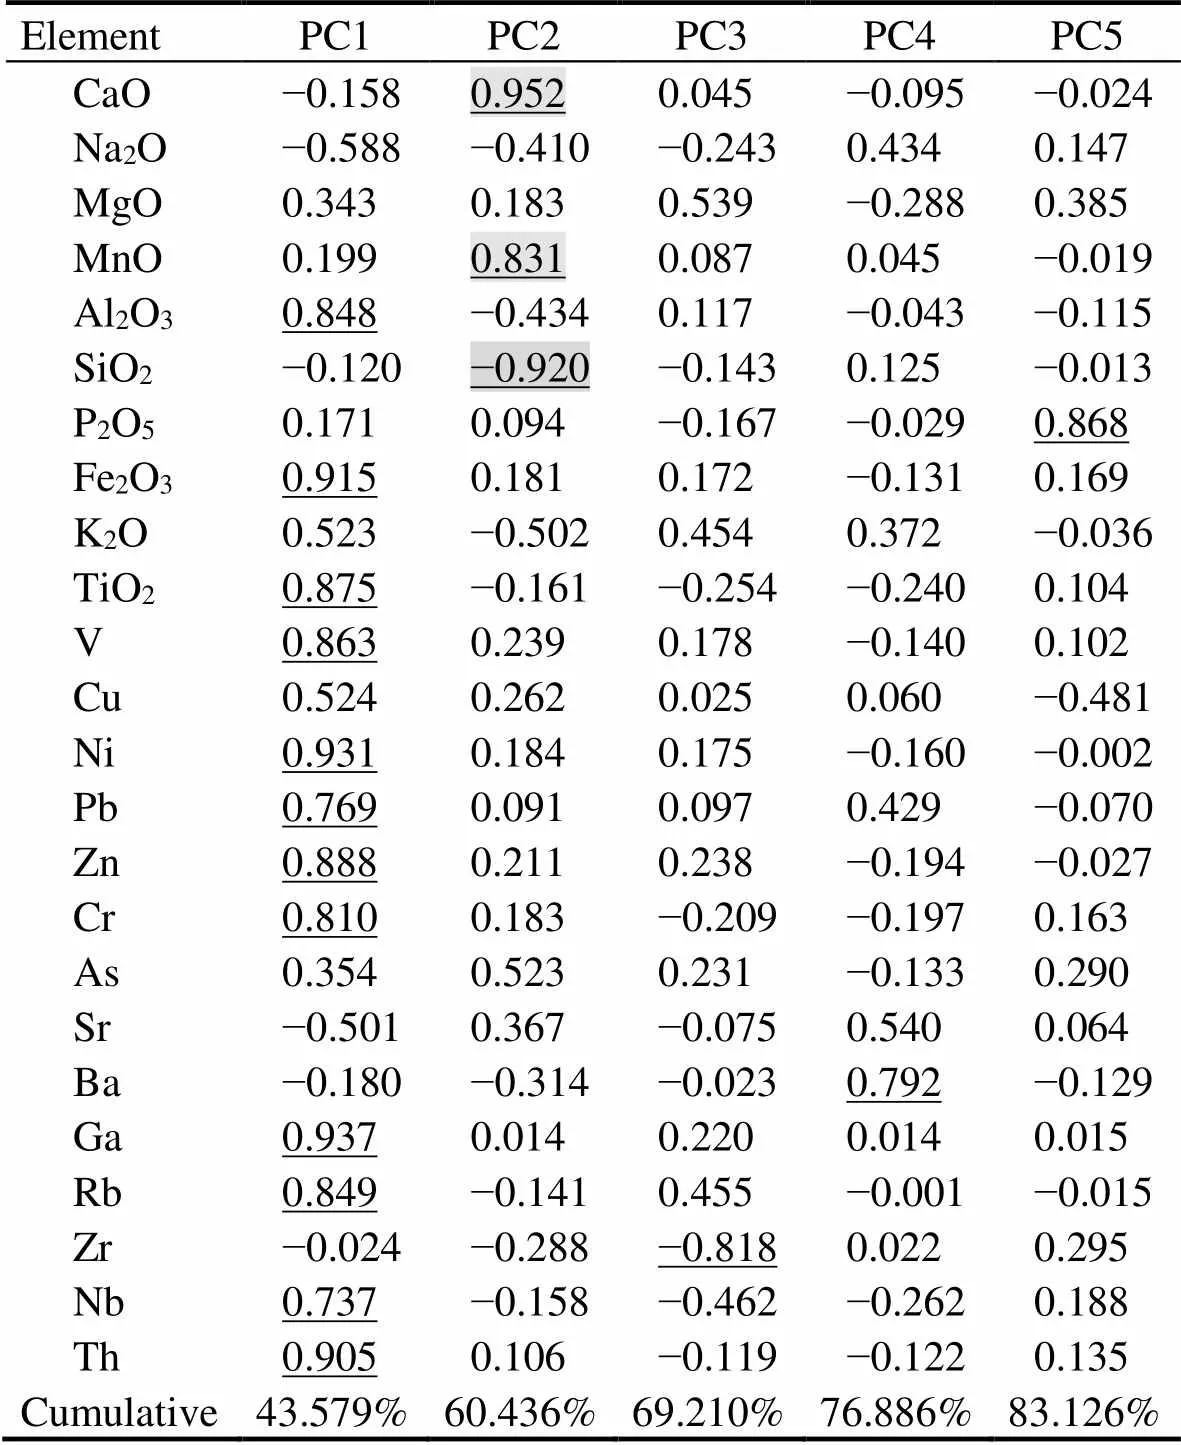
Table 4 Results of principal component analyses for the elements of ZK3 core
Possible sources of the study area include the Yellow River, Haihe River, Luanhe River, and surrounding short- term rivers. The framework of the stratigraphic age is re- vealed by cores KD4 and ZK3 and the Haihe and Luan Rivers. Because of its short formation history, the sources can be completely combined into the surrounding short- term river source. In this study, the average elemental content of the North China Platform upper crust is taken as the eigenvalue of the sedimentary geochemical elements.
From the results of-factor analyses, we can conclude that the CaO contents of cores KD4 and ZK3 are mainly controlled by terrestrial debris and are closely related to the source factor, which can better indicate the source of sediment in this area. Previous studies have also confirmed the feasibility of this approach. Therefore, in this area of provenance research (Yang., 2004; Lan., 2008), the CaO content can be used as a geochemical indicator to distinguish the contribution of rivers around the Bohai Sea to sediments in this area.
Cr, Th, Zr, Nb, and other elements mainly exist in stable debris minerals. According to the trace element geochemical characteristics of the Yellow River sediments, thesurface environment does not migrate easily. The presence of Cr/Th in the Yellow River sediments can be treated as characteristic elements that clearly indicate the influence of the Yellow River source (Yang., 2004).
The calculation results of the discriminant function showthat since the Holocene, the discriminant coefficients (yr,hr,lr) of the Yellow, Haihe, and Luanhe Rivers have been very small, when means that the sediment composition of these three rivers is less than that of the study area, which is in line with the actual situation. However, if we exclude some of the extreme values, which may be cau- sed by biological effects, we find that the discriminant coefficients of the Luanhe River show a negative correlation with the discriminant coefficients of the Yellow and Haihe Rivers at some depths. Data for the mouth of the modern Yellow River since the late Pleistocene have not been examined, so we introduce the geochemical elemental contents in the upper part of the North China Platform, and use the content of the geochemical elements in the short-term river sediments to calculate the discriminant function.
The discriminant coefficients of Ca/Al indicate that the discriminant functions of the Yellow River and North China Platform are less than 1.5, thus we can conclude that the Yellow River and surrounding short-lived rivers are the main sediment sources in the region. The discri- minant functions of the Yellow River and the North China Platform increase with sediment depth, their changes are synchronized, and this function can be divided into two cases. When the discriminant function is significantly high, the two changes are synchronized, and the highest value is obviously obtained at the core KD4 points of 53m and 80m and core ZK3 points of 11m, 28m, 48m, and 87m. The reason for the high values of the discriminant coefficients at these intervals is the influence of biological shell debris. The description of the columnar samples also shows the presence of shell fragments in several columnar samples. In the intervals where the discrimination coefficients are less than 1, the trends of the Yellow River and North China Platform are opposing, with a roughly mirrored relationship.
The discriminant coefficient of Cr/Th better shows that the sediments in the Yellow River estuary are mainly derived from the Yellow River and surrounding short-term rivers. There is a high degree of consistency with the variations in the change in synchronization and change trend between the discriminant functions of the Yellow River and North China Platform. Obviously, core KD4 has three layers: 16.25–21.51m, 48.73–52.67m, and 74.95– 80.65m. The corresponding core ZK3 intervals are 8.2– 10.2m, 23.19–31.79m, and 52.87–57.46m. The discri- minant coefficient of the Yellow River is larger than that of the upper North China Platform, which indicates that during these periods of sediment deposition, the influence of short-term river sediments on the surrounding area of the Bohai Sea obviously increased.
Due to the large change in the sedimentary environment in the study area and the marine-terrestrial interaction, some commonly used geochemical element ratios are ineffective, such asand Rb/Sr. Thus, we selected only the Sr/Ba ratio, which represents salinity. In the depositional environment, Sr and Ba have similar chemical natures, from freshwater deposition to seawater deposition, and the Sr and Ba contents increase with salinity (Yue., 2011). Ba compounds have lower solubility than Sr compounds. When there are sulfate ions in the water, Ba is deposited in the form of BaSO4, and SrSO4can continue to migrate to the marine environment through sedimentationbiological action. Therefore, the Sr/Ba ratio increases with increases in salinity, which reflects changes in the seawater depth with climate change.
According to a synthesis of the source index, salinity, average particle size, and DF value, as well as analysis of the dating results and the stratigraphic division of the oxy- gen isotope cycle stages of cores KD4 (Fig.4) and ZK3 (Fig.5), we obtained the following. With a change in depth, the relationship between changes in the regional source and climate can be divided into six phases:
Phase I (MIS 5c–MIS 5a) corresponds to the core KD4 100–81m interval and core ZK3 81–63m interval. A set of marine strata were deposited in this area. Simultaneously, the Yellow River formed and its composition had a greater influence on the sedimentary composition of the study area. During the MIS 5e stage, this area comprised a shallow marine sedimentary environment with rising tem- peratures and sea level, and the sediment salinity gradually increased. The hydrodynamic environment weakened, and the influence of the Yellow River material on the sedi- ment composition gradually increased and then became the main source of material for the region. After entering MIS 5d, the temperature decreased, the coastline retreated, the sediment salinity remained low, a river-lacustrine sedi- mentary environment is observed, and the Yellow River source material became the main component of sediments in this area.
Phase II (MIS 5a–MIS 3) corresponds to the core KD4 81–61m interval and core ZK3 63–49m interval. The de- positional records of core ZK3 at this stage show its location in a sedimentary environment with land and sea interaction, which is also consistent with the magnitude of the sea level changes during this period and the higher frequency characteristics. The source of the Yellow River and the sources of short-term streams in this situation were wavering, and the deposition records of core KD4 exhibit similar characteristics to those of the previous stage, whereby as the temperature rose, the climate warmed, the sedimentary environment became a shallow oceanic facies, and sediments were mainly derived from short-term rivers. The water depth continued to increase, the salinity gradually increased, and the Yellow River source material gradually became the main component of the sediment.
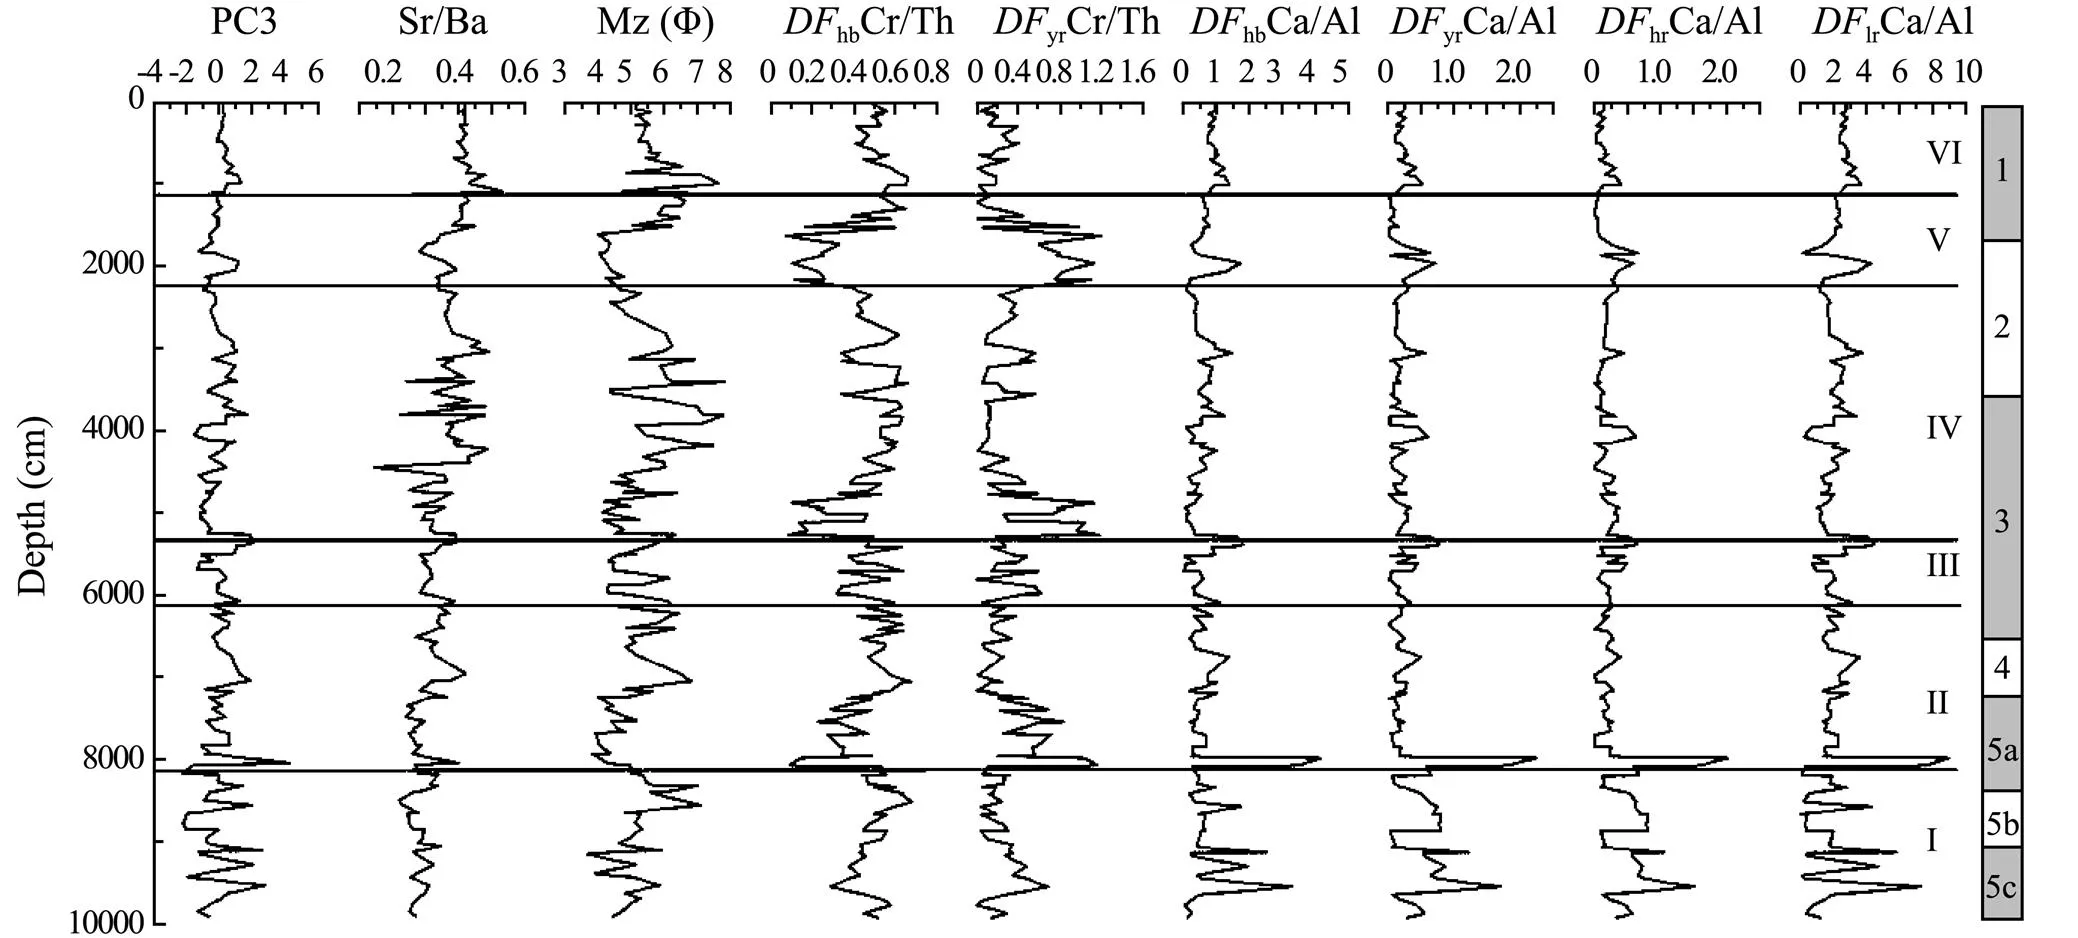
Fig.4 Comprehensive comparison of core-KD4 multiple indicators with the depth of the curve: factor analysis of the Yellow River provenance factor PC3; sedimentary environment salinity index Sr/Ba; sedimentary dynamic environmental indicators, sediment average particle size Mz; Cr/Th source discriminant function of the North China Platform and Yellow River; and Ca/Al source discriminant function of the North China Platform, Yellow River, Haihe River, and Luanhe River. According to the dating results and stratigraphic division, the deep-sea oxygen isotope cycle is MIS.
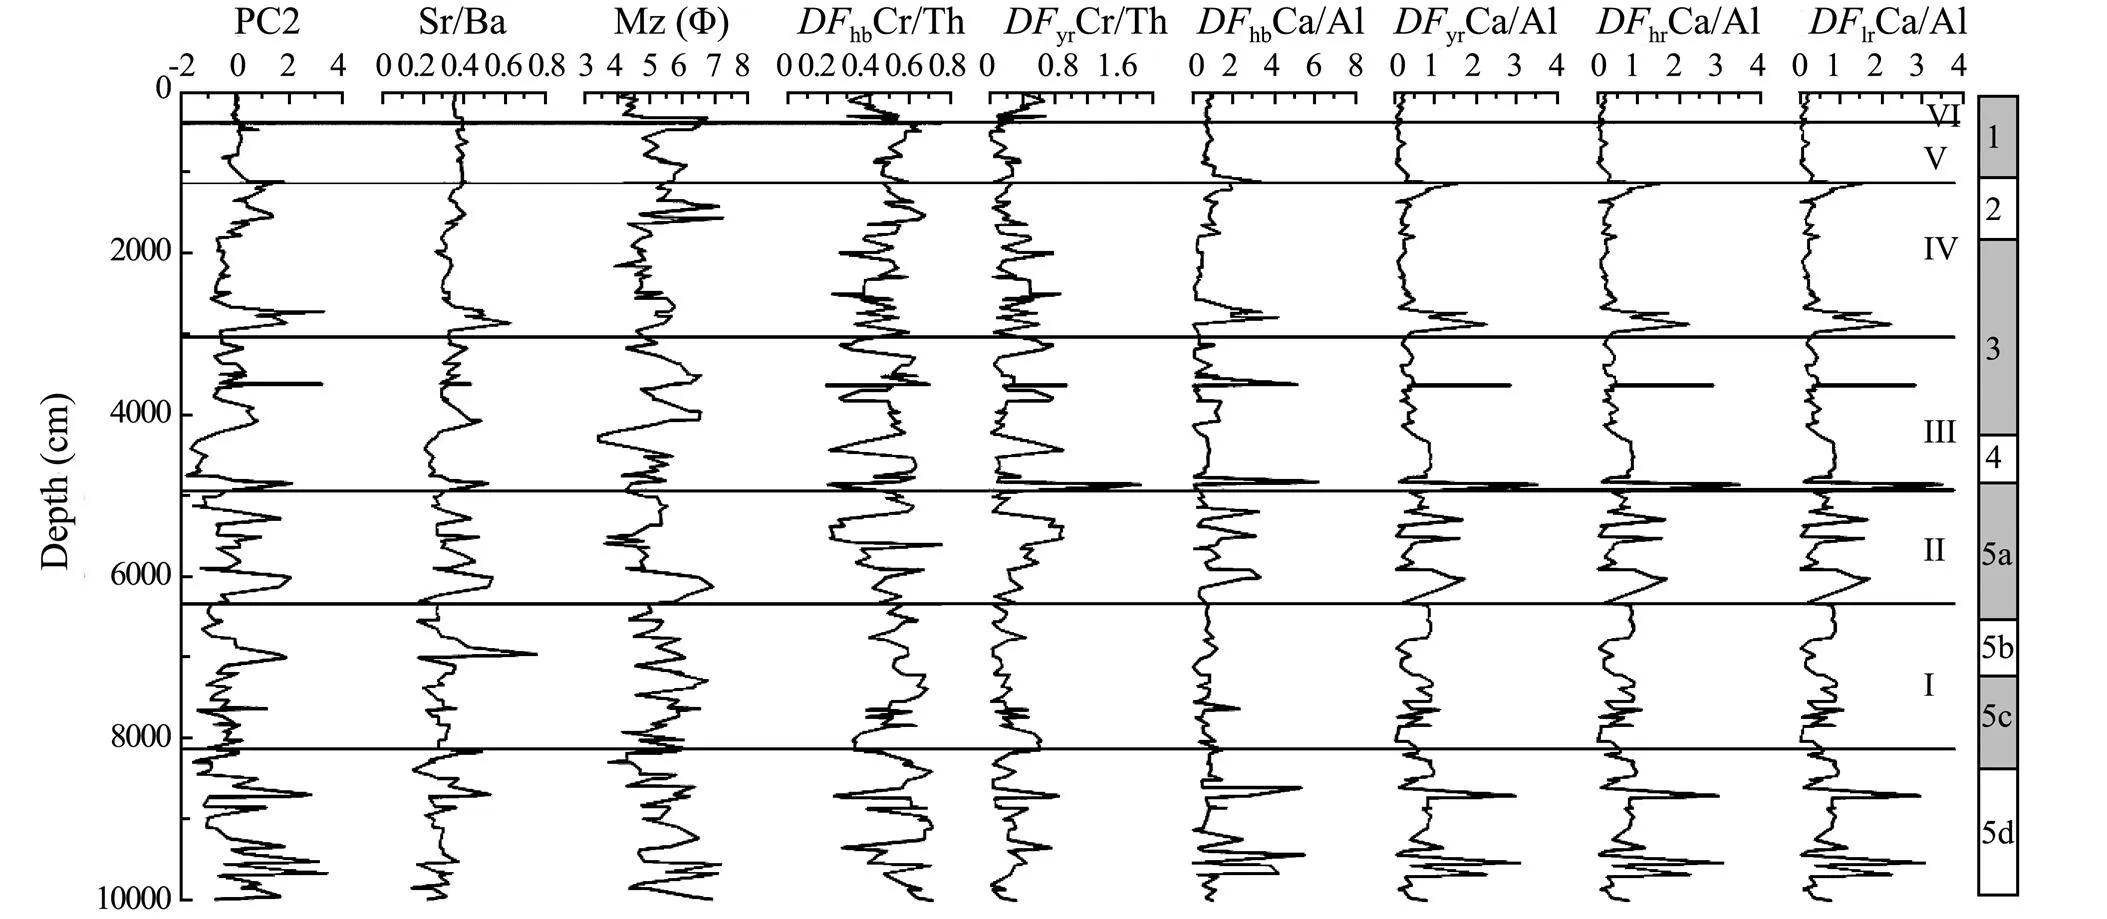
Fig.5 Comprehensive comparison of the core-ZK3 multiple indicators with the depth of the curve: factor analysis of the Yellow River provenance factor PC2; sedimentary environment salinity index Sr/Ba; sedimentary dynamic environmental indicators, sediment average particle size Mz; Cr/Th source discriminant function of the North China Platform and Yellow River; and Ca/Al source discriminant function of the North China Platform, Yellow River, Haihe River, and Luanhe River. According to the dating results and stratigraphic division, the deep-sea oxygen isotope cycle is MIS.
Phase III (MIS 3) corresponds to the core KD4 61–53m interval and core ZK3 49–30m interval. During this period, with a sharp drop in temperature, sea level also rapidly dropped. The study area was in the process of retreat: the salinity was reduced, sediment particle sizes increased, the hydrodynamic environment strengthened, and the sedi- ment source changed from the Yellow River to short-term rivers. Then, a set of terrestrial strata was deposited above and the Yellow River source material remained the main source of the region.
Phase IV (MIS 3–MIS 2) corresponds to the core KD4 53–22m interval and core ZK3 30–11m interval. Similar to the previous stage, at the beginning of this phase, the tem- perature increased, and a transgression process occurred in the study area, whereby the salinity increased, the hydrodynamic environment strengthened, and the sediment sources were obviously short-term rivers. The temperature continued to rise, the sea level increased, the hydrodyna- mic environment weakened, and the source material of the Yellow River became the main component of sediments in the study area. Up to the last glacial period, the study area retreated, and the sedimentary records show that the sediment source at the junction of the marine-continental sedimentary strata became a high-level source of the North China Platform, although this is not obvious. The subsequent deposition of continental sediments was still dominated by the Yellow River.
Phase V (MIS 2–MIS 1) corresponds to the core KD4 22–11.6m interval and core ZK3 11–3.5m interval. At the beginning of this phase a special event occurred. During the last ice age, the Yellow River was diverted or even dried up. As such, the Yellow River did not flow through the region, so the chemical compositions of the river- lacustrine sediments and Yellow River source material during the early part of this stage are significantly different. The chemical compositions exhibit characteristics close to that of the North China Platform surface sediment. At the end of the last glacial period, at the junction of the sea-continental strata, all indicators occurred rapidly and then recovered, which indicates that at this point in time, the climate and material sources experienced a great change. After entering the Holocene climate warming period, the study area was covered by seawater, sedimentary marine strata was deposited, the salinity gradually increased, water depth gradually increased, sediment particle size decreased, and the effect of the Yellow River on the sediment sources gradually increased.
Phase VI (MIS1) corresponds to the core KD4 11.6–0m interval and core ZK3 3.5–0m interval. This stage is spe- cial. At the beginning of the stage, during the 9600–8500 B.P. period, the Yellow River diverted and ran into the sea in the northern Jiangsu area. The sediment sources changed, which means that sediments were mainly from the upper part of the North China Platform, were carried by the surrounding short-term rivers, and were characterized by coarse sizes and higher salinity. The last part of the stage was from 8500 B.P. to present. The Yellow River ran into the sea along the west coast of the Bohai Sea, depositing Yellow River Delta sediments. Compared with the previous stage, during this period, the source index of the Yellow River sediments decreased rapidly and has remained at a low level, which indicates that the sediments of this period were mainly from the Yellow River.
5 Conclusions
Based on this geochemical study in Laizhou Bay, we conclude that the main source of sediments in the Yellow River estuary has been the Yellow River, followed by the surrounding short-term rivers, which have carried debris sediments from the upper part of North China since the late Pleistocene. The sediments exhibit an inverse correlation with vertical changes. The changes in the study area provenance are related to climate change. With the process of sea transgression, the source of sediments gradually evolved to the Yellow River. When the temperature increased and the climate warmed, the study area was covered by seawater. The study area was shallow, the hydrodynamic conditions were strong, the salinity was low, and the area comprised a coastal shallow marine sedimentary environment. During this period, most of the sediments were sourced from the surrounding short-term rivers in North China and the particles were coarse. The temperature and the sea level continued to rise, the depth of the study area increased, and the hydrodynamic conditions weakened. The coarse-grained sediments carried by the surrounding short-term rivers were not well rounded and were thus unable to reach the study area. Finally, the fine-grained sediments from the Yellow River became the main sediment source in the study area.
Acknowledgements
This work was supported by the China Geological Sur- vey Project (Nos. GZH201100202 and DD20160158) and the Taishan Scholar Project.
Armstrong-Altrin, J. S., Machain-Castillo, M. L., Rosales-Hoz, L., Carranza-Edwards, A., Sanchez-Cabeza, J., and Ruíz-Fer- nández, A. C., 2015. Provenance and depositional history of continental slope sediments in the southwestern Gulf of Me- xico unraveled by geochemical analysis., 95: 15-26.
Cho, Y. G., Lee, C. B., and Choi, M. S., 1999. Geochemistry of surface sediments off the southern and western coasts of Korea., 159 (1-4): 111-129.
Davis, J. C., and Sampson, R. J., 1986.Wiley, New York, 316-333.
Fralick, P. W., and Kronberg, B. I., 1997. Geochemical discri- mination of clastic sedimentary rock sources., 113 (1-2): 111-124.
Gong, C. Z., Liu, Y., Dai, Y. C., Xing, L., Wang, X. D., and Li, G. X., 2014. Geochemical features of the modern Yellow River mouth since late Pleistocene.,30 (11): 22-31 (in Chinese with English abstract).
Gu, Z. Y., Han, J. M., and Liu, D. S., 2000. Progress in geochemical research on the loess and other Quaternary deposits in China., 1: 41-55.
Hao, Q. Z., Guo, Z. T., Qiao, Y. S., Xu, B., and Oldfield, F., 2010. Geochemical evidence for the provenance of middle Pleistocene loess deposits in southern China., 29 (23): 3317-3326.
Jiang, F. Q., Zhou, X. J., Li, A. C., and Li, T. G., 2009. Quantitatively distinguishing sediments from the Yangtze River and the Yellow River using δEuN-ΣREEs plot., 52 (2): 232-241.
Kim, G., Yang, H. S., and Kodama, Y., 1998. Distributions of transition elements in the surface sediments of the Yellow Sea., 18 (12): 1531-1542.
Kremling, K., and Streu, P., 1993. Saharan dust influenced trace element fluxes in deep North Atlantic subtropical waters., 40 (6): 1155-1168.
Lan, X. H., Wang, H. X., Li, R. H., Lin, Z. H., and Zhang, Z. X., 2007. Major elements composition and provenance analysis in the sediments of the South Yellow Sea.,14 (4): 197-203.
Lan, X. H., Zhang, X. J., Wang, H. X., Zhao, G. T., Zhang, Z. X., and Lin, Z. H., 2008. Sedimentary geochemistry in core NT2 of the South Yellow Sea and its provenance., 28 (1): 51-60 (in Chinese with English abstract).
Lee, C. B., Jung, H. S., and Jeong, K. S., 1992. Distribution of some metallic elements in surface sediments of the southeastern Yellow Sea.,27: 55-65.
Lü, X. X., Versteegh, G. J. M., Song, J. M., Li, X. G., Yuan, H. M., and Li, N., 2016. Geochemistry of middle Holocene sedi- ments from south Yellow Sea: Implications to provenance and climate change., 27 (5): 751-762.
McLennan, S. M.,Hemming, S., McDaniel, D. K., and Hanson, G. N., 1993. Geochemical approaches to sedimentation, pro- venance, and tectonics. In:. Johnsson, M. J., and Basu, J., eds., the Geological Society of America, Boulder, 1-21.
Perri, F., Critelli, S., Mongelli, G., and Cullers, R. L., 2011. Se- dimentary evolution of the Mesozoic continental redbeds using geochemical and mineralogical tools: The case of upper Triassic to lowermost Jurassic Monte di Gioiosa mudrocks (Sicily, southern Italy)., 100 (7): 1569-1587.
Singh, A., Paul, D., Sinha, R., Thomsen, K. J., and Gupta, S., 2016. Geochemistry of buried river sediments from Ghaggar Plains, NW India: Multi-proxy records of variations in provenance, paleoclimate, and paleovegetation patterns in the late Quaternary.,449: 85-100.
Song, S., Feng, X. L., Li, G. G., Liu, X., Xiao, X., and Li, F., 2018. Change in sediment provenance near the current estuary of Yellow River since the Holocene transgression., 17 (3): 535-544.
Sun, D. Y., Tan, W. B., Pei, Y. D., Zhou, L. P., Wang, H., Yang, H., and Xu, Y. P., 2011. Late Quaternary environmental change of Yellow River Basin: An organic geochemical record in Bohai Sea (North China)., 42 (6): 575- 585.
Usunoff, E. J., and Guzmán-Guzmán, A., 1989. Multivariate an- alysis in hydrochemistry: An example of the use of factor and correspondence analyses., 27 (1): 27-34.
Wang, F., Li, J., Chen, Y., Fang, J., Zong, Y., Shang, Z., and Wang, H., 2015. The record of mid-Holocene maximum landward marine transgression in the west coast of Bohai Bay, China., 359: 89-95.
Xu, Q. M., Yang, J. L., Yuan, G. B., Chu, Z. X., and Zhang, Z. K., 2015. Stratigraphic sequence and episodes of the ancient Huanghe Delta along the southwestern Bohai Bay since the LGM., 367: 69-82.
Xu, Z. K., Li, T. G., Nan, Q. Y., Yu, X. K., Li, A. C., and Choi, J. Y., 2012. Paleoenvironmental changes in the northern Oki- nawa trough since 25kaBP: REE and organic carbon evidence., 23 (3): 297-310.
Xue, C. T., Zhou, Y. Q., and Zhu, X. H., 2004. The Huanghe River course and delta from end of late Pleistocene to the 7th century BC., 26 (1): 48-61.
Yang, S. Y., and Li, C. X., 2000. Elemental composition in the sediments of the Yangtze and the Yellow Rivers and their tracing implication., 10 (8): 54- 60.
Yang, S. Y., and Youn, J. S., 2007. Geochemical compositions and provenance discrimination of the central South Yellow Sea sediments., 243 (1-4): 229-241.
Yang, S. Y., Cai, J. G., Li, C. X., and Deng, B., 2001. New discussion about the run-through time of the Yellow River., 21 (2): 17-22 (in Chinese with English abstract).
Yang, S. Y., Jung, H. S., Li, C. X., and Lim, D. I., 2004.Major element geochemistry of sediments from Chinese and Korean Rivers., 33 (1): 99-105 (in Chinese with English abstract).
Yang, S. Y., Li, C. X., Jung, H. S., and Lee, H. J., 2002. Discrimination of geochemical compositions between the Chang- jiang and the Huanghe sediments and its application for the identication of sediment source in the Jiangsu coastal plain, China., 186: 229-241.
Yang, S. Y., Li, C. X., Lee, C. B., and Na, T. K., 2003. REE geochemistry of suspended sediments from the rivers around the Yellow Sea and provenance indicators., 48 (11): 1135-1139.
Yue, J., Dong, Y., Zhang, B. H., Mou, L., Wang, G. M., Chen, A. S., Yuan, B. Y., Liu, J. L., and Wei, J. H., 2011. Several geochemical indicators of the west coast of Bohai Sea., 85 (7): 1239-1250 (in Chinese with English abstract).
June 22, 2018;
May 10, 2019;
October23, 2019
© Ocean University of China, Science Press and Springer-Verlag GmbH Germany 2020
. Tel: 0086-532-66782542
E-mail: estuary@ouc.edu.cn
(Edited by Chen Wenwen)
 Journal of Ocean University of China2020年1期
- Journal of Ocean University of China的其它文章
- Circulation and Heat Flux along the Western Boundary of the North Pacific
- System Reliability Analysis of an Offshore Jacket Platform
- The Mineral Composition and Sources of the Fine-Grained Sediments from the 49.6˚E Hydrothermal Field at the SWIR
- Research Progress of Seafloor Pockmarks in Spatio-Temporal Distribution and Classification
- Application of the Static Headland-Bay Beach Concept to a Sandy Beach: A New Elliptical Model
- Climatology of Wind-Seas and Swells in the China Seas from Wave Hindcast
