
Comparison of invasive dynamic blood pressure between superior mesenteric artery and common carotid artery in rats
2020-03-02 10:44RuiningLiuXiaojunWeiShaopingLiChengJiangYanZhao
Rui-ning Liu, Xiao-jun Wei, Shao-ping Li, Cheng Jiang, Yan Zhao
Emergency Department of Zhongnan Hospital, Wuhan University, Wuhan 430071, China
KEY WORDS: Blood pressure; Superior mesenteric artery; Common carotid artery; Abdominal aorta
INTRODUCTION
Over the past few decades, experiments have often been carried out by monitoring physiological parameters, such as blood pressure (BP), to observe the physiological state accurately in the basic and clinical research. Techniques for measuring BP have improved rapidly and considerably.[1]Techniques for measuring BP in experimental animals can be divided into indirect(noninvasive) and di rect (invasive) methods. Although indirect methods are suitable for measuring BP in some circumstances (noninvasive detection or screening for substantial group differences in systolic BP or systolic BP changes in large numbers of animals), they are not recommended for quantifying BP or measuring BP variability, and the accuracy of indirect methods in animals is open to question. Therefore, direct method is used in our study. The direct BP measuring by f luid-f illed catheter is the classical and most widely used method.[2]Common carotid arterial (CCA) or femoral arterial BP monitoring with arterial cannulation is particularly preferred in animal experiments. However, choosing a suitable site is largely dependent on the investigative objective.
Dynamic cerebrovascular autoregulation (CA) shows the capability of the vasculature to respond to sudden BP change.[3]It is reported that aortic occlusion may induce acute hypertension in rats.[4-6]Occluding the descending aorta can induce acute hypertension and avoid potential pharmaceutical complications.[5]There are also many continuous autoregulation monitoring techniques based on calculating moving correlation coefficients. The essence is the correlation between a hemodynamic driving factor, such as MAP, and a surrogate for cerebral blood f low(CBF) or cerebral perfusion. Therefore, monitoring MAP makes a difference in CA-related research.[7-8]
Evi dence has shown that axillary artery can be used as a site of cannulation for BP monitoring. Choosing the carotid artery access may adversely affect cardiovascular function through several mechanisms, including impaired CBF.[2]The primary indication for axillary artery cannulation is the inability to establish safe perfusion via the femoral artery when occluding the aortic artery.[9]In our pre-experiment about dynamic CA observation in rats,we found that the axillary artery is very deep and needs much more time to expose. The cannulation has a low success rate and is easy to fall off. Additionally, exposing the axillary artery would induce additional harm to the upper limb besides the abdominal surgery for preparation of abdominal aorta occlusion. Meanwhile, we found that SMA could be used for BP monitoring and have a relatively stable value during clamping /de-clamping of the abdominal aorta in our preliminary experiments.
To date, dynamic BP monitoring through the cannulation in SMA in rats has not been investigated.Therefore, in order to f ind and validate another suitable cannulation site for BP monitoring with little influence on CBF in the cerebrovascular-related research, we designed this study. The purpose of this study was to determine the consistency of invasive dynamic BP measurement between SMA and CCA in rats during aortic occlusion and release induced by a microvascular clip.
METHODS
Ethics statement
All the animal experiments were performed in the Center for Animal Experiment of Zhongnan Hospital of Wuhan University and were approved by the Institutional Animal Care and Use Committee (IACUC) at Center for Animal Experiment of Wuhan University. The animals were treated humanely by trained personnel in accordance with the Guide for the Care and Use of Laboratory Animals.[10]
Animal preparation
Male-specific pathogen-free (SPF) Sprague-Dawley rats (n=8), weighing 250–300 g, were included in this study. All rats were healthy and housed in a climate-controlled room (temperature 26±2 ºC and a relative humidity of 60%±5%) with food and water ad libitum and a 12-hour light-dark cycle. The animals were maintained on surgical anesthesia throughout the measurement study and were euthanized at the end of the study using an overdose of anesthesia (pentobarbital sodium, 100 mg/kg, i.p.).
Surgical procedures
The study was designed as a self-control study.All rats were cannulated in the left CCA and SMA simultaneously for dynamic BP monitoring. Briefly,anesthesia was achieved with 3% pentoba r bital sodium at the dose of 40 mg/kg via an intraperitoneal injection.Rats were fixed in a supine position on a temperaturecontrolled heating pad to maintain body core temperature during instrumentation and experimental protocols.Through a midline neck incision, the subcutaneous tissue was bluntly dissected. The CCA and the vagus nerve were exposed carefully. Then a heparinized 24-gauge angiocatheter (0.7 mm × 19 mm, Becton Dickinson Medical Devices Co. Ltd., Suzhou, China) was inserted into the CCA, and the artery for cannulation was ligated distally and fixed with prepared ligatures. Afterward,the arterial clip was removed, and the catheter was subsequently connected to a pressure transducer (PT-100 Blood Pressure Transducer, Taimeng, China) of the BL-420F Experiment System (Taimeng, Chengdu, China ),a polygraph system, through a tubing system f illed with heparinized saline solution (50 IU/mL). The pulsatile arterial blood column indicated that the catheter was successfully inserted. The transducer for the observation of BP in CCA was connected with Channel 1 in the BL-420F experiment system.
Next, the abdominal cavity was opened, and the small intestine was exteriorized to expose the abdominal aorta and SMA, avoiding injury of the surrounding inferior vena cava and renal artery. Similarly, a 24-G-gauge angiocatheter was inserted into the SMA as described above. The connection method between the artery and transducer was the same as described above.The transducer for observation of BP in SMA was connected with Channel 2 in the BL-420F experiment system. The polygraph system was connected with a computer equipped with freely available software (TM_WAVE application). Both of the pressure transducers were placed at the same level of the heart. The zerolevel reference of this system was calibrated at the level of the manubrium. The whole tubing system was f lushed with sterile normal saline to eliminate air bubbles and prevent any kind of f luid leak within the circuit. Finally,a microvascular clip was placed around the abdominal aorta below SMA. With the use of this microvascular clip, blood flow in the abdominal aorta could be interrupted periodically to elicit fluctuation in systemic blood pressure.

Blood pressure recording and data collection
The study flow is shown in Figure 1A. The blood pressure (SBP, DBP, and MAP) values were recorded at a sampling rate of 100 Hz. SBP, DBP, and MAP values would be recorded during different time periods: the baseline (T1), the increasing period after clamping (T2),the platform period during clamping (T3), the decreasing period after de-clamping (T4) and the final platform period (T5), as shown in Figure 1B. We focused on the analysis of MAP values because the tissue perfusion pressure is primarily dependent on MAP rather than SBP or DBP. Based on previous researches,[5,11]once stable baseline conditions were established after resting for at least 15 minutes, a 2-minute baseline recording (without aortic occlusion) was obtained. Blood flow through the abdominal aorta was then periodically interrupted for 1 minute using the clip around the abdominal aorta. The BP elevated in a few seconds and rapidly increased to a stable level. After releasing the clip, the BP declined until another stable level was reached. Three trials were performed on each rat with 15-minute intervals between consecutive monitoring. The data from the software can be stored for further comparative analysis.
Statistical analysis
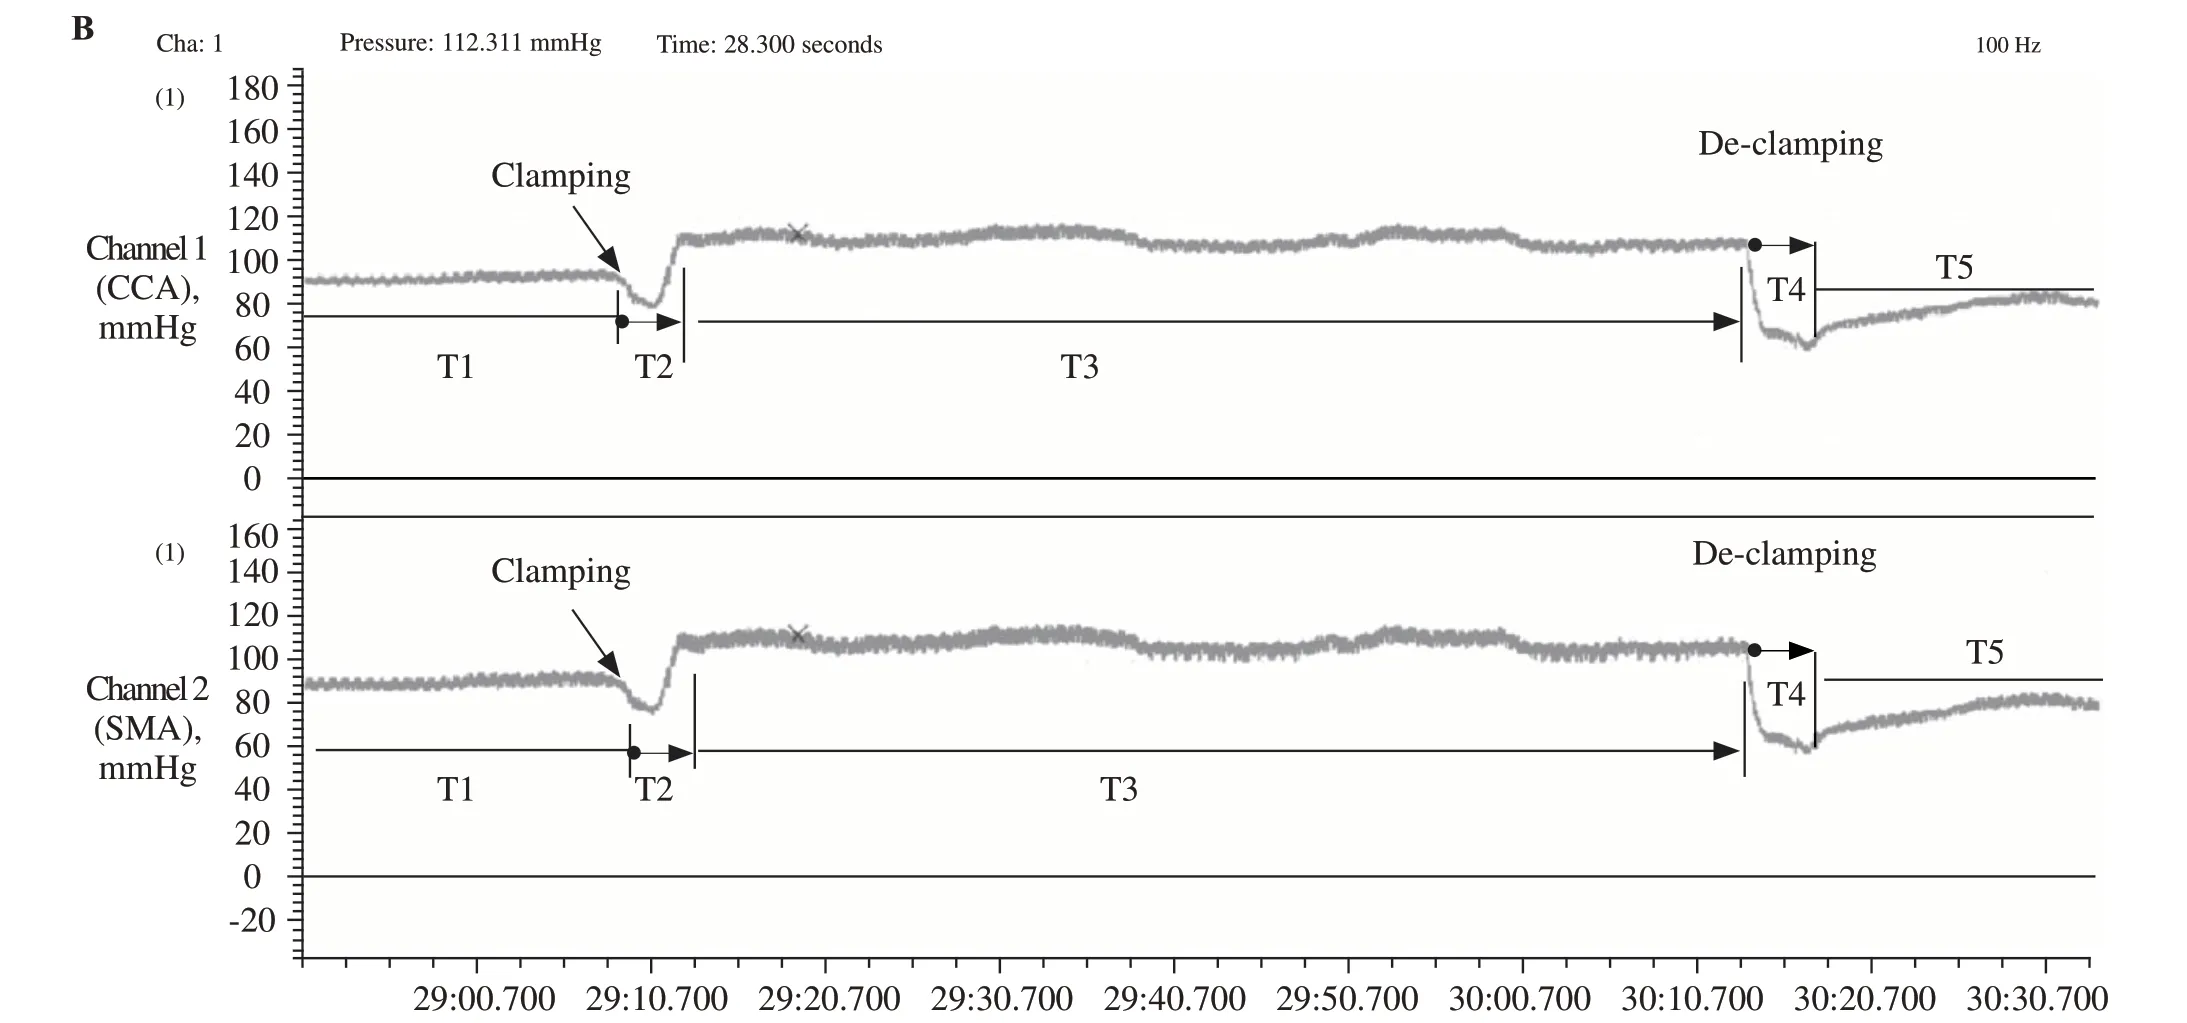
Figure 1. The study f low and the record of blood pressure. A: the blood pressure monitoring f low chart; B: the BP monitoring wave forms and 5 time periods (T1–T5) demonstration in one whole observation period from BL-420F experiment system. The clamping /de-clamping in the photograph means the abdominal aorta is clamped /de-clamped by using the microvascular clip. The X-axis is the time(s) and the Y-axis is BP value (mmHg) in the common carotid artery (CCA) (the upper part) and superior mesenteric artery (SMA) (the lower part).
Statistical analysis was performed using GraphPad Prism, version 5.0 (GraphPad Software Inc., San Diego,CA, USA) and SPSS software for Windows (Version 20.0, IBM Inc., Chicago, IL, USA). Descriptive data were expressed as the mean ± standard deviation (mean± SD) and analyzed as continuous data. Paired t-tests were performed to compare the values of SBP, DBP,and MAP. The association of BP monitoring between SMA and CCA was detected using Pearson’s correlation analysis. The Bland-Altman analysis was performed to assess the agreement of the SBP, DBP, and MAP values between SMA and CCA. Bias was estimated as the mean difference between BP from two cannulation sites, and the 95% limits of agreement were calculated as mean bias ±1.96 SD. Statistical signif icance was def ined as P<0.05.

Table 1. The SBP, DBP, and MAP of invasive blood pressure through SMA and CCA (mmHg)
RESULTS
Comparison of SBP, DBP, and MAP values measured at SMA and CCA
Blood pressure (SBP, DBP, and MAP) was recorded at T1, T2, T3, T4 and T5, as Table 1 shows. The results showed that there was no significant difference in SBP values between SMA and CCA at any time period.However, DBP values measured in the SMA differed significantly from those measured in CCA from T1 to T4, except at T5 (P=0.534). The mean value of MAP obtained from the SMA was significantly different only during T1 compared with the CCA (P=0.015). Among the pooled data, both of the MAP changes during T2 obtained from SMA and CCA were 23±5 mmHg; and the MAP changes during T4 were 48±10 mmHg and 47±9 mmHg, respectively.
The Pearson correlation analysis
Correlation of SBP, DBP, and MAP values of SMA and CCA were analyzed by Pearson correlation analysis,which is shown in Table 2. Notably, the comparison of BP values observed in SMA and CCA sites revealed an excellent agreement (P<0.001).
The Bland-Altman analysis
The Bland-Altman analysis was performed to assess the agreement between BP at SMA and CCA. Limits of agreement were set at 1.96 times standard deviation, and lower and upper limits of agreement (LOA) were mean bias±1.96 SD. Bias and 95% LOA of BP measurement between SMA and CCA at each period are shown in Ta ble 3. Within these values, the 95% LOA of MAP changes between SMA and CCA during T2 and T4 were-2.6 to 4.1 mmHg, and -4.4 to 5.4 mmHg, respectively(Table 3 and Figure 2).
DISCUSSION
In the present study, we tested a new BP monitoring site for invasive BP monitoring. All of the results suggested a good correlation and agreement on BP monitoring between SMA and CCA. Thus, the superior mesenteric artery might be a potential site for invasive arterial BP monitoring during abdominal aorta occlusion and release in rats. The main f inding was that there was no significant difference between SBP values obtained via SMA and CCA at any time period. However, asignificant difference was found in DBP values during T1 to T4, excepting for T5 (P=0.534). In contrast,MAP values obtained from SMA was significantly different only at T1, compared with the MAP from CCA(P=0.015). The differences about the DBP (T1–T4) and MAP (T1) might be due to the artery location, artery structure, and blood pressure elevation caused by the microvascular clip, or different tissue perfusion under various conditions. From another point of view, DBP and MAP values may be significantly different statistically,but the magnitude of differences is too minor to show any clinical signif icance. However, the paired t-test with nonsignificant results does not indicate agreement. It was possible that poor agreement between the two methods could be hidden in the distribution of differences, so it may induce the illusion of good consistency between the two methods.[12]Thus, further analysis for agreement by other statistical methods between SMA and CCA was needed.

Table 2. The Pearson correlation analysis between BP measurements at SMA and CCA
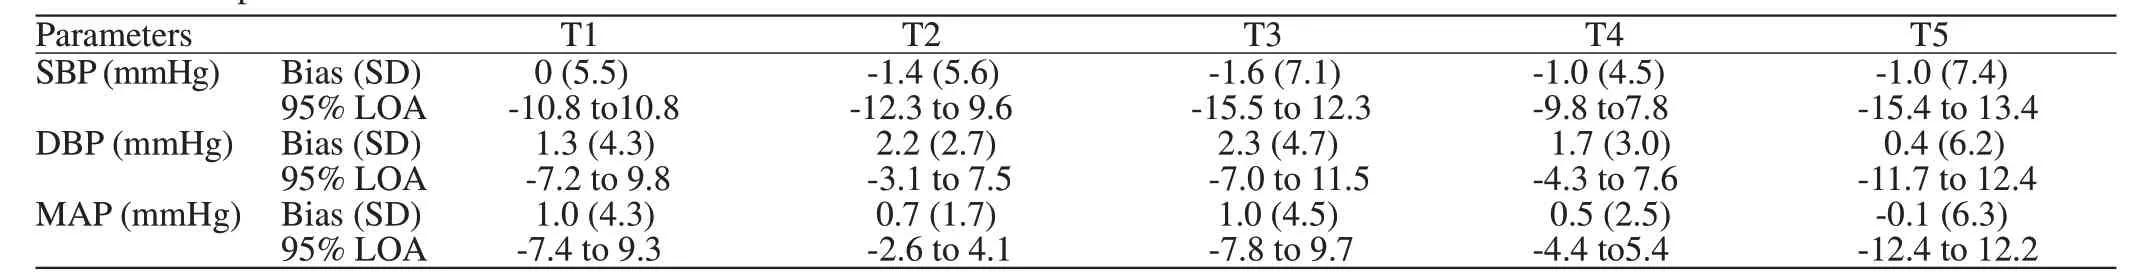
Table 3. Bias and 95% limits of agreement (mmHg) of blood pressure (SBP, DBP and MAP) values measured in SMA compared to CCA at different time periods

Figure 2. Bl and-Altman plots for assessing the agreement of increasing MAP values after clamping (T2) (A) and decreasing MAP value after declamping (T4) (B) between SMA (MAPSMA) and CCA(MAPCCA). The solid line represents bias and dashed lines show the upper and lower limits of agreement. The X-axis is the average of superior mesenteric and carotid arterial blood pressure values, and the Y-axis is the mean difference between superior mesenteric and carotid arterial blood pressure measurements.
Mignini et al[13]found that there were no differences in SBP, DBP, and MAP values measured in the femoral artery versus the radial artery in critically ill patients.In contrast, Ahmad et al[14]concluded that BP measured in the peripheral artery and central artery could not be interchangeable in critically sick patients after cardiopulmonary bypass. In contradiction with our results, a great deal of previous research found that systematic gradients exist in SBP measured between peripheral and central arterial BP measurements under various hemodynamic conditions.[1,14–15]The SBP was amplified from the aorta toward peripheral arteries,whereas MAP and DBP only showed slight changes.Systemic pressure increased as the measurement location was moved toward the periphery of the body,away from the heart.[16]This phenomenon was known as pulse pressure amplification phenomenon.[17]Briefly,the change in impedance from the aorta to the capillary produced ref lected pulse waveforms. Those waves could produce higher peaks than the original aortic systolic peak at different distances from the aortic origin.[13]Our results suggest that no significant difference is found in SBP values measured from SMA and CCA.This might be explained by the reason that the distance and impedance from the aorta between both sites for producing ref lected pulse waveforms were not enough to make a great and visible difference.
Although the values of DBP (T1–T4) and MAP(T1) via both sites were signif icantly different (P<0.05),a minor gradient measured through SMA and CCA was demonstrated. Meanwhile, highly significant correlations between SMA and CCA were found,although the correlation coefficient was not a measure of agreement but rather association. It is inappropriate to deduce that the two methods were interchangeable based only on a high correlation.[18,19]To address this problem,the best statistical approach is the Bland and Altman method.[12,20]The Bland-Altman analysis showed mean bias no more than 5 mmHg and SD less than 8 mmHg,which was well within the criteria of the good agreement recommended by Association for the Advancement of Medical Instrumentation (AAMI) guidelines. Another more liberal criterion set by the American College of Veterinary Internal Medicine (ACVIM) indicates good agreement with SD not exceeding 15 mmHg.[1,21–23]Our results suggest that the small mean bias and the narrow 95% limits of agreement, combined with good correlation,indicate the interchangeability of measurement from both sites.
Although there is a potential for infection and catheter loss for catheter implantation, most of the operational disadvantages of fluid-filled catheter systems can be overcome with appropriate procedures,strict aseptic operation, and development of surgical skills.[2]We tried to minimize variability in the whole measurement system. Because of this, simultaneous BP recordings of both sites were performed on the same monitor and the tubing system connected to each arterial catheter was supplied by the same manufacturers.[15]The whole tubing system was f lushed with sterile heparinized saline during the intervals between consecutive monitoring so as to ensure the reliability of the results.
Blood pressure fluctuations can be achieved through many ways in experimental or clinical research.Relatively fast changes in BP can be induced by a number of different maneuvers, such as the Valsalva maneuver, hand-grip, cold stress test, or changes in posture.[24,25]Additionally, blood pressure can be lowered by controlled bleeding and increased by norepinephrine application or mechanically inflating a balloon catheter to occlude the descending aorta without pharmacologic manipulation, which may disturb the vascular responses to be investigated.[26-28]Occlusion of the aorta provides a convenient means for producing acute changes in BP.[4,5,29]Arterial occlusion could be performed at four sites (thoracic, diaphragm, abdominal, and iliac). Aortic occlusion distal to the renal arteries, however, caused an indiscernible change in the pressure in dogs.[30]Occlusion of the abdominal aorta proximal to the renal arteries results in an increase in arterial BP, occlusion of the abdominal aorta distal to the renal arteries does not elevate arterial BP, and occlusion of the vena cava lowers arterial BP. In short, the levels of occlusion could produce varying degrees of BP increment.[6]In the study of frequency response characteristics of CBF autoregulation in rats, the BP changes were achieved using a string placed around the abdominal aorta. In addition to the string, there were many other tools (balloon catheter, a plastic cuff, Scoville-Lewis aneurysm clip) that could be chosen for aorta occlusion.[5,6,31]In our study, rapid BP change was induced by the occlusion of abdominal aorta located below SMA using a microvascular clip.
To the best of the authors’ knowledge, this is the f irst study in the literature that deals with BP monitoring between SMA and CCA. Though we have validated the agreement between both sites in healthy adult SD male rats, some limitations must be considered. First,the site for BP monitoring was in healthy male rats without any disease or any other interventions, whereas it is unclear whether similar results could be obtained in the female, other strains of rats or critically ill rats(e.g., those with ischemic stroke or shock). Second, why there was some discrepancy in DBP and MAP values is not fully understood. Third, the SMA measurement may potentially be good for study of CBF but not for study related to mesenteric circulation and/or digestion.Further studies should be undertaken to achieve a more comprehensive understanding of the agreement of BP monitoring between SMA and CCA.
CONCLUSION
In conclusion, the present study evaluates the feasibility of BP measuring at SMA in vivo and demonstrates a high strength of association and agreement of BP measurement between SMA and CCA. Therefore,superior mesenteric artery can be a new and alternative site for invasive BP monitoring during abdominal aorta occlusion and release, which may be used in cerebrovascular-related research.
Funding:The study was supported by Zhongnan Hospital of Wuhan University Science, Technology and Innovation Seed Fund, Project (cxpy2017039).
Ethical approval:The study was approved by the Institutional Animal Care and Use Committee (IACUC) at Center for Animal Experiment of Wuhan University.
Conf icts of interest:No benef its in any form have been received or will be received from a commercial party related directly or indirectly to the subject of this article.
Contributors:RL, XW and SL contribute equally to this article.All authors contributed to the design and interpretation of the study and to further drafts.
 World journal of emergency medicine2020年2期
- World journal of emergency medicine的其它文章
- Availability and quality of procedural sedation and analgesia in emergency departments without emergency physicians: A national survey in the Netherlands
- Presenting patterns of dermatology conditions to an Australian emergency department
- Effect of neutrophil CD64 for diagnosing sepsis in emergency department
- Post-dilatation improves stent apposition in patients with ST-segment elevation myocardial infarction receiving primary percutaneous intervention: A multicenter, randomized controlled trial using optical coherence tomography
- Predictive role of interleukin-6 and CAT score in mechanical ventilation in patients with chronic obstructive pulmonary disease at the acute exacerbation stage in the emergency department
- Changes in peak inspiratory f ow rate and peak airway pressure with endotracheal tube size during chest compression