
Characterisation of pore fluid salinity dependent evaporative dewatering of kaolin using dielectric spectroscopy
2020-02-18 03:07PrthNrynMishrThierryBoreAlexnderScheuermnnLingLi
Prth Nryn Mishr, Thierry Bore, Alexnder Scheuermnn, Ling Li
a Geotechnical Engineering Centre, School of Civil Engineering, The University of Queensland, Brisbane, St Lucia, 4072, Australia
b School of Engineering, Westlake University, Hangzhou, China
Keywords:Kaolin Evaporative dewatering Pore fluid salinity Electromagnetic (EM) methods Vector network analyser Dielectric permittivity Sensitivity analysis
A B S T R A C T Realising the importance of pore fluid salinity on the dewatering behaviour of fine-grained porous systems, the present study systematically investigated such impacts on temporal moisture dynamics of kaolin subjected to evaporative dewatering. A detailed discussion is provided pertaining to the background processes dictating evaporative dewatering response and corresponding alterations in the dielectric behaviour of kaolin.Frequency dependent dielectric spectra of soil,which can be considered as the fingerprint of the transient changes in the condition of water phase within the pore system of the soil and associated densification,are monitored in real time during dewatering using an open-ended coaxial probe with a vector network analyser. The spatial sensitivity of the coaxial probe has been quantified through layered media approach. Combining the results of volume change behaviour of the material along with its moisture loss response, the study characterised the hydro-mechanical response of the material from the windows of frequency dependent dielectric spectroscopy.
1. Introduction
A soil skeleton rich in liquid filled voids yields a porous state prone to fluidisation with little or no resistance to shearing(Pastor et al., 2010). Consistency boundaries that correspond to specific states of shear resistance of soil are progressively encountered reliant on the chemical nature (Lambe and Whitman, 1969) and transitional dynamics of pore water (Mishra et al., 2018a) in the void space. As the soil progressively loses moisture, densification and resistance to shearing are induced in the soil skeleton. This method of progressive moisture loss commonly referred to as dewatering can be achieved either by application of external stress or activation of internal stress within the soil skeleton (Chu et al.,2013). Dewatering plays a vital role in several ground improvement practices, improving the shear strength, stability and workability of soil and making it suitable for constructional purposes.
In addition, for soft porous geomaterials abundant in finegrained fraction, ionic concentration and pH value have been shown to govern the formation of the fabric (Palomino and Santamarina, 2005). Especially, soils rich in ionic pore fluid, as in the cases of dredged marine sediments and clays in engineered barrier systems, demonstrate noticeable alterations in several physico-chemical and geotechnical properties such as strength and stability (Di Maio and Fenellif, 1994; Tiwari et al., 2005),compressibility (Chen et al., 2000; Wahid et al., 2011), hydromechanical behaviour (Siddiqua et al., 2011), osmotic and volume change behaviour (Di Maio,1996; Di Maio et al., 2004), hydraulic conductivity(Graham et al.,2001;Mishra et al.,2009),and complex electrical conductivity(Lesmes and Frye,2001).In microscale,these changes may be linked to pore fluid chemistry dependant alterations in inter-particular configurations and forces in clayey systems (Pedrotti and Tarantino, 2018).
In general,evaporation,viscous flow and diffusion of pore fluid form the critical basis for dewatering and shrinkage of soils (Hu et al., 2013). Evaporative dewatering can take place from soil surface if the following three conditions are fulfilled(Hillel,1982;Tang et al., 2011): (i) continual supply of heat to the surface of soil to accommodate the latent heat requirements; (ii) higher vapour pressure in air above the soil surface than that in the soil surface;and(iii)uninterrupted supply of water to the evaporating surface of soil from the interior. Temporal evolution of moisture during evaporative dewatering of soils typically follows a two or three staged process(Idso et al.,1974;Han and Zhou,2013;Mishra et al.,2017), as presented in Fig. 1. In the beginning, when the soil is saturated,there exists a continuous hydraulic connection between the soil surface and the atmosphere, which attributes to a smooth movement of liquid molecules from soil,yielding a fast reduction in soil moisture. As the soil starts to experience loss of moisture, it undergoes reduction in volume and subsequent densification,yielding higher dry density.Densification of soils causes reduction in pore space and hindrance in connectivity of pore network,which essentially results in a decrease in hydraulic conductivity. Moreover, matric suction, an important parameter depicting soil moisture dynamics, increases with reduction in moisture content. This leads to binding of water molecules with greater force to the soils as they progressively undergo drying (Tang et al., 2011). In soils with saline pore fluid, osmotic suction also increases, as the pore fluid tends to get more concentrated in salt with reduction in moisture induced by drying. All of these factors hold a causal connection with decrease in drying rate, followed by development of a stiff crust on the surface with much reduced hydraulic conductivity depending upon hydro-mechanical properties of the soil (Abu-Hejleh and Znidarˇci′c, 1995) due to the lack of continuous water phase.Development of the crust slows down transport of soil water vapour through the air filled pores of the crust to account for the evaporative demand, and the mode of drying is primarily contributed by the movement of vapours, marking the second stage of drying(see Fig.1).The third stage of drying is characterised with a low or constant rate of moisture loss controlled by molecular forces,which, sometimes, is considered to be merged with the second stage (Han and Zhou, 2013).
In light of the above discussion,it is imperative that continuous monitoring of the state parameters such as moisture content and dry density of soil (Schwing et al., 2014) helps to ascertain the progress of the chosen dewatering method. In this regard, broadband electromagnetic (EM) methods may be used as a nondestructive means to monitor the required parameters for tracking the progress of dewatering in a timely manner (Mishra et al., 2017, 2018b). Soils can be idealised to be comprised of major phases,viz.soil solids,air and water;and as presented in Fig.2,water phase is constituted by pore water(free and capillary water)and bound water(Saarenketo,1998).As drying proceeds,free water evaporates from the soil structure, leading to air entry and sequential densification (see Fig. 2). As such, the EM response of a multiphasic soil system is a holistic weighted representation of the response of the individual phases (Wagner and Scheuermann,2009; Scheuermann et al., 2018), and therefore, phase dynamics altering the state parameters could theoretically be well captured in the framework of EM measurements on the soil.It may be worth mentioning that, of all the constituents of a soil structure, free water has the highest complex permittivity. Temperature and frequency dependent real part of complex permittivity of free water is around 80(in GHz range and at 20°C),whereas the imaginary part depends upon the ionic constitution of the solution(Kaatze,2000).On the other hand, owing to the restricted mobility of the water molecules in the presence of an EM field, complex permittivity of bound water is lower than that of free water (Friedman, 1998;Saarenketo, 1998). For one monomolecular bound water layer,real part of the complex permittivity has been reported to be 3.2 in the literature (Dirksen and Dasberg, 1993). The complex permittivity of soil grains is essentially independent of frequency and temperature (Wagner et al., 2013), and its real part is typically reported to be 3-15(Robinson,2004).Permittivity of the air phase is around 1 and has the least individual contribution to holistic permittivity of the soil system.

Fig.1. Schematics of progress of evaporative dewatering in geomaterials.

Fig. 2. Phasal dynamics of soil system during drying.
Therefore, a systematic parametric study to ascertain the influence of pore fluid salinity on the temporal moisture loss, combined with volume change and densification of kaolin from the windows of frequency dependent dielectric measurements, is reported herein. The dielectric measurements have been performed with an open-ended coaxial probe, the spatial sensitivity of which has been established through a layered media approach based finite element modelling. A detailed discussion pertaining to the physical processes involved and correlating the observed macroscopic and dielectric responses of kaolin during evaporative dewatering is provided.
2. Material characterisation and sample preparation
A reference fine-grained material, kaolin, commercially available as‘Eckalite I',has been used in this context.The material has a liquid limit of 90% (ASTM D4318-10e1, 2010), plastic limit of 36%(ASTM D4318-10e1, 2010) and shrinkage limit of 35% (Schwing,2015; Mishra et al., 2019). A more detailed characterisation of the material can be found elsewhere(e.g.Schwing,2015;Mishra et al.,2018a,c).Analytical grade KCl with deionized water(DI water)was used to prepare the saline permeant fluids at four molal concentrations ranging from 0.2 mol/kg to 1 mol/kg. For this purpose,required amount of salts was added to the DI water, and continuously mixed for about 30 min with a magnetic stirring system.Following this,the material was mixed with the saline solutions to saturation(targeted moisture content of around 100%).In order to allow uniform mixture and distribution of the fluid in the prepared samples,the prepared samples were sealed in airtight bags,and left in desiccators for at least 24 h before carrying out any tests on them.Table 1 summarises the sample nomenclature and properties of the saline fluid solutions used in this investigation.
3. Experimental programme
All the tests were conducted in cylindrical sample moulds of 70 mm diameter and 14 mm height at ambient laboratory conditions (22.5°C ± 1.5°C). Independent tests on representative witness samples at similar placement and atmospheric conditions have been performed and analysed to provide an integrated approach for capturing the dielectric signature on the temporal evolution of moisture and volume during the evaporative dewatering (see Fig. 3).
The samples in the moulds sitting on top of the balance were used to note the alterations in the average moisture content over time subjected to evaporative dewatering (Fig. 3a). For this purpose, weight of the samples was continuously logged through the balance.Assuming that there is no change in the weight of the dry soil solids and salts and the weight of air in the soil skeleton is negligible,the progressive mass loss undergone by the sample can be ascribed to the moisture escaping out of the sample. With the knowledge of dry weight of the sample and the overall weight of the sample at any instant of time,gravimetric moisture contents of the samples over time were computed.It is worth mentioning that the state variables reported herein correspond to a three-phased idealisation (soil solid-saline liquid-air) of the soil.
Dielectric permittivity(ε*)is a measure of a material's response to the presence of an external field (Moore and Mitchell, 1974;Cassidy, 2009). While the real part of the frequency dependent dielectric permittivity specifies the transmittability of EM energy by the medium (Moore and Mitchell, 1974), the imaginary part depicts losses due to polarisation and conductivity (Fam and Santamarina, 1997). Quite often dielectric measurements on a material are depicted with a dimensionless quantity called complex relative dielectric permittivity (ε*r.eff), which is expressed as the ratio of dielectric permittivity of the material to that of the free space (8.85 ×10⁻¹²F/m).
Table 1 Sample nomenclature and characteristics of the pore fluids.
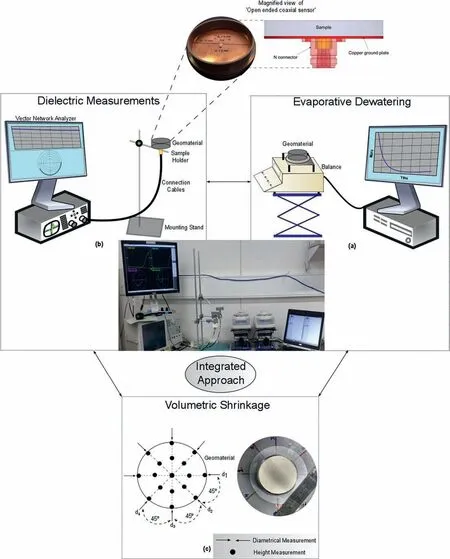
Fig. 3. Integrated framework involving temporal moisture loss, volume change and dielectric measurement during evaporative dewatering of kaolin.
In the present investigation, a homemade probe from ‘N' type connector (Mishra et al., 2017) based on open-ended coaxial technique(Gregory and Clarke,2007)was used.The open-ended probe has outer and inner conductors of 5 mm and 3 mm diameters,respectively,which has been embedded in a representative sample mould (Fig. 3b). The present investigation resorted to one port measurement system (reflection only). Incident signals from a vector network analyser(VNA)travel through the coaxial probe to the material and are reflected back dependent on the properties of the material under investigation. The frequency dependant scattering parameter S11(ω), thus obtained through direct measurement by VNA, correlates the incident and reflected signals. It is worth mentioning that in order to mitigate any systematic errors associated with the VNA, calibration against standardised open short and load has been performed prior to any measurement(Mishra et al., 2018b). Following a bilinear relationship (Bao et al.,1994), S11parameter is then linked to the complex relative dielectric permittivity(ε*r.eff)(Bate and Burns,2014)as mentioned below:

where c1, c2and c3are the frequency dependent calibration constants obtained from calibration of the probe. For high frequency measurements, usually an open-water-liquid (OWL) calibration(Wagner et al., 2014) is performed to obtain the calibration constants appearing in Eq. (1). With the knowledge of temperature(Ellison, 2007; Kaatze, 2007) and frequency (Hilhorst et al., 2001)dependent dielectric behaviour of deionised water (Debye model)and that of the calibration liquid (methanol) used (Gregory and Clarke,2009),and treatingfor air as 1,Eq.(1)can be rewritten as
where the superscripts O, W and L denote the corresponding quantities for open, water and liquid calibrations, respectively.Moreover, the calibrations were checked against standard liquids(tap water, ethanol, etc.) and the probes were appraised to deliver satisfactory performance over the frequency range of 500 MHz to 3 GHz(Bore et al.,2016).It may be noted that the upper limit of the frequency was imposed by the measuring device.
Furthermore, results from the direct measurement based volumetric shrinkage tests (Mishra et al., 2019), conducted to appraise the evolution in volume and density of the representative samples during the process of the dewatering from a slurry state (Fig. 3c),have also been incorporated in the analysis of the current experimental framework.
4. Spatial sensitivity of the probe
In order to estimate the spatial sensitivity of the coaxial probe, a three-dimensional (3D) finite element modelling based approach has been used with a commercial software ANSYS HFSS(https://www.ansys.com/products/electronics/ansys-hfss) which basically solves Maxwell's equation. In a previous study (Wagner et al., 2014), a complete 3D finite element analysis was reported on the same probe geometry.In Wagner et al.(2014),the 3D field calculations were firstly used in order to determine the complex reflection coefficient, or scattering function S11(ω), at the connector of the open-ended probe in equivalence to measurements. Based on the simulations performed on reference liquids(e.g. well characterised solvent such as ethanol, methanol, and acetone) and lossy materials, different calibration scenarios were investigated (open-water-short (OWS) and OWL). Secondly, the spatial sensitivity has been determined by computing the electrical and magnetic field distributions along a profile normal to the middle conductor (vertical profile) and along a profile parallel to the open-ended probe at the sensor aperture (lateral profile). This analysis required determination of a criterion to determine the lower limit of sensitivity (a lower limit of -40 dB was used).
In the context, we propose to apply another methodology for determination of the spatial sensitivity, which consists of modelling a two-layered configuration and was introduced in Meaney et al. (2014) for biomedical application dealing with multilayered material such as skin. Basically, the objective was to determine the configuration at which the top layer has no more influence on the determination of the electric permittivity of the bottom layer, i.e. the material in contact with the probe aperture.During experiments, the probe was immersed in liquids (different liquids were tested such as water and salt water) facing a moving Teflon cylinder. This method was originally developed for semirigid open-ended probe and validated with numerical simulations. One of the important aspects to validate the quality of the measurement is to ensure that vertical subsidence will not affect the measurement; the simulation approach employed in the current scenario is helpful for such a validation. Moreover, it is worth noting that the determination of the spatial sensitivity is fundamental for such study; a too large spatial sensitivity may capture gradientwise alterations in soil properties during dewatering of thick soil samples which may not serve the intended purpose.Such a scenario could be handled either by installing multiple sensors across the sample to capture local changes and constructing a spatial profile through integrating results obtained from individual sensors, or using spatial time domain reflectometry (Scheuermann et al., 2009).
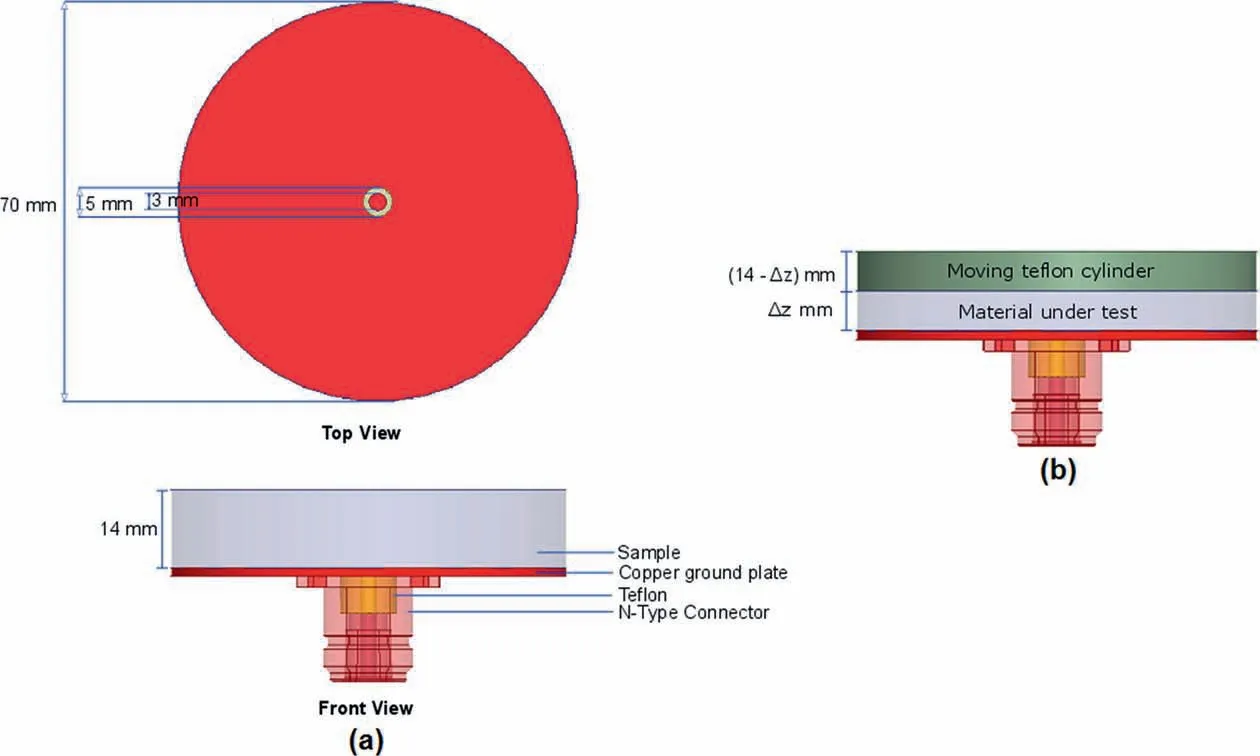
Fig. 4. (a) Schematics of the probe geometry; and (b) Schematics for layered media approach based numerical modelling.

Fig. 5. Input spectra used in the 3D finite element modelling of the probe: (a) Real and (b) imaginary parts.

Fig. 6. Estimated vs. input spectra: (a) Real and (b) imaginary parts.
In this context, the open-ended probe facing a two-layered medium has been modelled to determine its spatial sensitivity.Geometry of the probe is presented in Fig. 4a. Here, only the results for the vertical spatial analysis will be presented. For the lateral sensitivity,we rely on the results proposed by Wagner et al.(2014). Note that the computations were performed over a large frequency ranging from 1 MHz to 10 GHz. In the first step, the probe with a single material was numerically modelled in order to perform a ‘virtual' OWL calibration. For this purpose, S11(ω) was obtained through the numerical model, while temperature and frequency dependent input spectra of the calibration materials(DI water, methanol, and air) were computed as explained in the previous section. As such, the input spectra have been presented in Fig. 5. Thus, calibration functions c1, c2and c3were determined using Eq. (2). The quality of calibration was validated with three other reference liquids (checks): isopropanol at 30°C, ethanol at 20°C and ethanol-water mixture (mole fraction of ethanol equal to 0.22) at 20°C. For isopropanol and ethanol, the extensive database from Gregory and Clarke (2009) was used, whereas for ethanol-water mixture, data from Petong et al. (2000) were used.Finally, the corresponding scattering functions of these liquids(checks) were estimated based on Eq. (1) with the calibration functions. A good agreement can be observed over the whole frequency range between the input and estimated spectra (see Fig.6).The average error over the frequency range for the real and imaginary parts for the three liquids (checks) can be found in Table 2.
In the second step,the probe facing the layered configuration is modelled (see Fig. 4b). The computations were performed in a parametric fashion by moving the position of the Teflon block.Here, the parametric study was performed with three liquids:isopropanol, ethanol and ethanol-water mixture whereas Δz ranged from 0.1 mm onwards.For each configuration,the scattering function was computed and used to determine the complex permittivity.The results are presented at the frequency of 1 GHz in Fig.7,where the estimated value of the real part of the permittivity is plotted as a function of Δz for the three liquids. We can observesimilar behaviours for the three materials. First, the curves are virtually linear until a separation, after which they tail off and asymptotically approach the theoretical dielectric permittivity of the material.
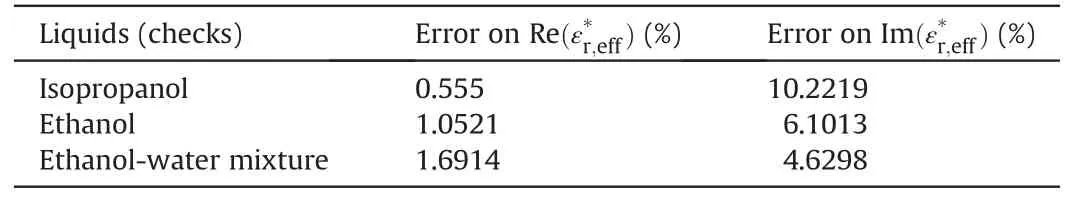
Table 2 Errors in estimation of complex permittivity.
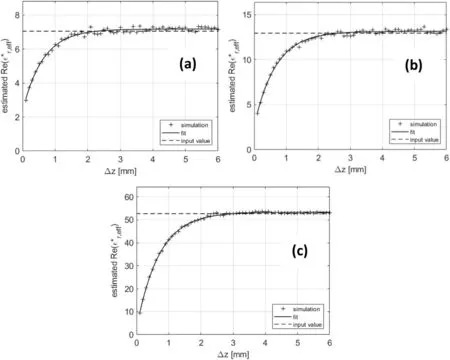
Fig. 7. Real part of estimated complex permittivity as a function of Δz at the frequency of 1 GHz: (a) Isopropanol, (b) ethanol, and (c) ethanol-water mixture.
In Meaney et al. (2016), an analysis based on the fitting of the linear part of the curve and the intersection of the asymptotical value was proposed.Here,the complete curves were directly fitted with the following equation:

The root mean square error(RMSE)and the values of the fitted parameters are tabulated in Table 3. The quality of the fits can be illustrated by the satisfactory values of the RMSE.
The vertical spatial sensitivity was finally estimated from the parameter τ.Basically,Eq.(3)can be considered as the response to a step of a first-order system. In general, it is assumed that after 5τ,99%of the final value of vertical sensitivity is reached.This criterion was used to define the vertical spatial sensitivity,which comes out to be 3.1375 mm for isopropanol, 3.3595 mm for ethanol and 3.49 mm for ethanol-water mixture.It is worth noting that a value of 7 mm was estimated in Wagner et al. (2014) with the electrical and magnetic field distribution method for the same probe. Our analysis estimated a value almost two times smaller. As explained earlier, the layered media method should be preferred since it is directly connected to shrinkage problem and seems more appropriate since it is based on permittivity which is the physical quantity of interest for dielectric measurement. In further studies,this analysis needs to be extended to lateral sensitivity and lossy material. An analysis as a function of frequency could also be performed.
5. Results and discussion
Fig. 8a demonstrates the evolution of gravimetric moisture content of the kaolin samples with several initial pore fluid concentrations upon subjection to evaporative drying. As it can be clearly observed, all of the curves exhibit a three-staged process,having a linear, transitional and steady decay of moisture. As explained earlier, this observation may be attributed to the alterations in soil structure and hydraulic connection with atmosphere in response to the progressive drying.Samples having higher initial concentration of pore fluid yielded slower rate of drying, e.g.KDKC1.0 can be observed to lose moisture slower than KDKC0.2.The gravimetric moisture content vs. time curves can be observed to be asymptotically approaching zero moisture content towards the completion of the third stage of drying. Results of the drying response for three other materials, i.e. kaolin with tap water (KT),kaolin in 0.2 mol/kg of NaCl solution(KDNC0.2)and kaolin in 1 mol/kg of NaCl solution (KDNC1.0) conducted inside an environmental chamber (Mishra et al., 2017) have also been included in Fig. 8.
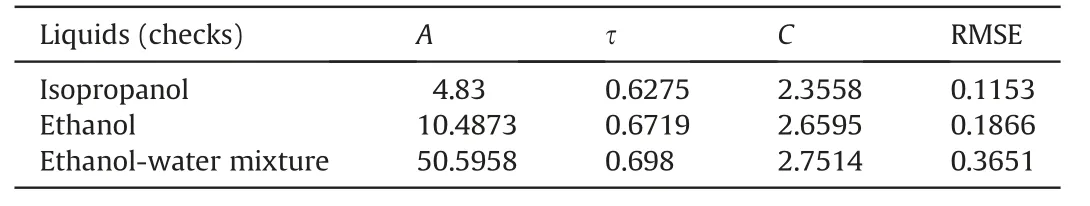
Table 3 Parameters obtained from the fit of Eq. (3).

Fig. 8. Temporal evolution of (a) gravimetric moisture content (Corte and Higashi,1960) fit and (b) drying rate for kaolin samples with different pore fluid concentrations (temporal differential curves).
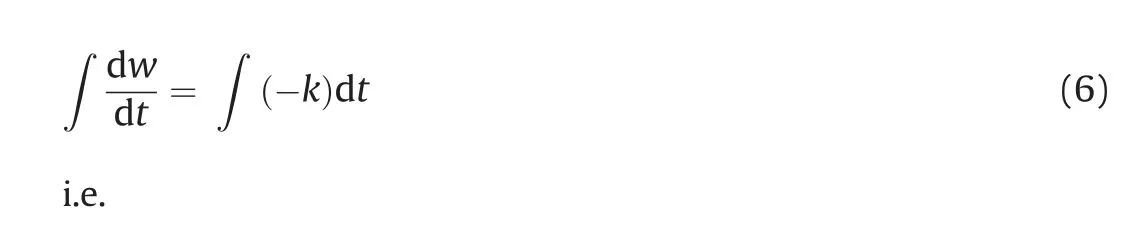
Corte and Higashi (1960) observed that water content vs. time plots during drying,for soil samples initially in a slurry state,follow an exponential decay.At any given instant during drying,the rate of moisture loss is proportional to the moisture content of the soil sample (w):

i.e.

where k is the decay constant or desiccation speed in a more physical sense (after Corte and Higashi,1960), and the associated negative sign is construed as an indicator of reduction in moisture over time. Rearranging Eq. (4) and integrating it, we obtain
ln w = -kt+c (7)
where the constant of integration c can be obtained by introducing the initial condition: w = w0at t = 0, in which w0is the initial moisture content of the soil sample.
Thus, Eq. (5) can be modified as follows (Corte and Higashi,1960):
w(t) = w0exp(-kt) (8)
Theoretically, for fine-grained porous media, it is difficult to drive 100% moisture out of the skeleton. Therefore, an analogical‘half-life' approach encountered frequently in radioactive decay is employed in the current framework of dewatering.In this context,half-life(λ)is defined as the time taken by kaolin to lose 50%of its initial moisture content. Extending the definition of λ mathematically, Eq. (7) yields

i.e.
ln 2 = kλ (10)
or
λ = ln2/k (11)
In the present study,desiccation speed and half-life are used as two quantitative parameters to distinguish the pore fluid dependence on drying behaviour of kaolin.
As discussed earlier,Corte and Higashi(1960)fit has been used to parameterise w vs. t plots (Fig. 8a) with good correlation coefficients (R >0.99). However, it is worth mentioning that the fit tends to perform better as the initial pore fluid concentrations in the sample are increased. Table 4 summarises the statistical parameters of the fit along with the desiccation speed and half-life.A drastic reduction of around 47% (from 0.0428 h-1to 0.0226 h-1)was observed in the desiccation speed when the initial pore fluid concentration in the kaolin sample altered from 0.2 mol/kg to 1 mol/kg KCl. For the respective alteration in pore fluid concentration, half-life increased by about 89% (from 16.2 h to 30.67 h).Fig. 9 presents the trends for evolution of desiccation speed and half-life of the samples with alteration in initial concentration of pore fluids. In general, desiccation speed reduced and half-life increased with increase in initial pore fluid concentration in soils.Similar response was observed for the samples with NaCl as pore fluid.KDNC0.2 showed higher desiccation speed and lower half-life than KDNC1.0 (Mishra et al., 2017). The kaolin sample with tap water exhibited the highest desiccation speed(Mishra et al.,2017)and the lowest half-life.
In soils with a saline pore fluid,osmotic suction comes into play along with matric suction (Shimojimaa et al.,1996; Mishra et al.,2017). As explained earlier, matric and osmotic suctions lead to increase in the bonding forces acting on the water molecules in the soil skeleton. As a consequence, water molecules require more energy to be removed from the soil as drying progresses. The atmospheric conditions provide this energy. Furthermore, the first stage of drying is dictated by the atmospheric demand.As such,the rate of moisture loss is reliant on the vapour pressure above the evaporating surface which in turn is affected by the temperature and intermolecular forces. Under isothermal conditions, as per Raoult's law (Smith et al., 2001), saturated vapour pressure is lowered with increase in salinity of the pore water up to a critical level (Smith et al., 2001; Norouzi Rad and Shokri, 2012). Loweringof vapour pressure with increase in salinity may correspond to the reduction in the rate of moisture loss(Nassar and Horton,1989a,b,1999; Shimojimaa et al., 1996; Norouzi Rad and Shokri, 2012) as observed in the current experimental framework. Furthermore,salinity also has an impact on hydraulic properties of soil(Barbour and Fredlund,1989; Lima et al.,1990; Mishra et al., 2009), which might have a connection with the rate of moisture loss. These effects slow down the transport of water through soil skeleton.Therefore,the higher the initial salinity of the pore fluid,the lower the desiccation speed, thus the higher the half-life.

Table 4 Parameterisation of the pore fluid dependent evaporative dewatering curves of kaolin.
Moreover, Fig. 8b presents temporal evolution of the first differential of gravimetric moisture content with respect to time for the samples.The initial plateau in the dw/dt vs.t curves suggesting constant rate of drying corresponds to the first stage of w vs.t plots.In this stage,a continuous hydraulic connection exists between the soil and atmosphere,facilitating smooth transfer of moisture.With elapsed time, the second stage with successively reducing rate of drying is encountered owing to the decreased soil moisture,decreased relative humidity gradient across the soil-air interface and increased suction.It can also be observed from Fig.8b that the initial rates of drying(modulus of dw/dt)is lower for samples with higher initial pore fluid concentration(e.g.4.4%h-1for KDKC1.0 to 2.4% h-1for KDKC0.2), which corroborates well with the previous explanations. After leaving the plateau, the curves show a decreasing trend with a crossover point (at about 32 h,1.1% h-1).This point signifies an equal rate of drying for all the samples irrespective of the initial pore fluid concentration. After the crossover point is reached, the curves continue to show a decreasing trend until they asymptotically reach 0 along the dw/dt axis, corresponding to the third stage of drying.

Fig. 9. Evolution of desiccation speed and half-life of kaolin with alteration in initial concentration of pore fluids.
Shrinkage is a mechanical reaction observed in soil skeleton during evaporative dewatering, which is not usually given due importance in hydraulic characterisation related studies on soils.The temporal evolution of dry densities of the samples during evaporative drying has been established (Fig. 10) based on the volumetric measurements on the representative samples (Mishra et al., 2019) and a parametric model aided fitting approach(Fredlund et al., 2002). It can be noted that, with increasing time,the dry unit weight increases with decrease in moisture content and then attains a steady state irrespective of any further changes in moisture content. Such a steady state in dry unit weight is realised close to shrinkage limit of the material where no more changes in the volume of the material take place with changing moisture content. The more the initial pore fluid salinity of the sample was, the higher the steady state dry unit weight reached,which has been explained through increased physio-chemical stress and inter-particular attraction under increased pore fluid salinity (Mishra et al., 2019). Initial temporal evolutions of dry densities at low initial pore fluid salinity(0.2 mol/kg and 0.4 mol/kg KCl) are very similar. However, at high initial pore fluid salinity,these rates get ordered(KDKC0.2 <KDKC0.8 <KDKC1.0).
It may be worth mentioning that continuous measurements of the frequency dependent dielectric response over the entire duration of dewatering for all the samples have been performed in the study. However, for the sake of brevity, Fig. 11 presents such a measurement for only one sample (KDKC0.2) with change in gravimetric moisture content (from 101.6% to 2.8%) over the frequency range of 500 MHz to 3 GHz. As such, each line in Fig. 11 presents the frequency dependent dielectric spectra (500 MHz-3 GHz) for KDKC0.2 at any intermediate stage of dewatering.
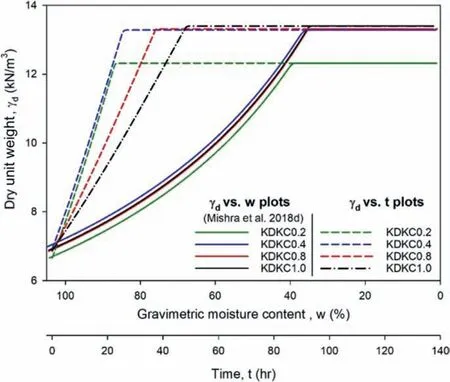
Fig. 10. Evolution of dry unit weight of the samples with time and gravimetric moisture content.

Fig.11. Frequency dependent dielectric response of KDKC0.2 during dewatering.
From Fig.11,it can be noted that at any given moisture content,the real part ofis somewhat independent of frequency in the range of 500 MHz-3 GHz. However, the imaginary part ofincreases with decrease in frequency, which may be attributed to the contribution of direct electrical conductivity at low frequency(Santamarina et al., 2001) and possible presence of interfacial polarisation (Schwing, 2015).red uction in gravimetric moisture. This observation can be
Moreover,both the real and imaginary parts ofreduce with explained on the basis of the fact that the water phase contributing the highest to the overall dielectric permittivity of the soils gets driven out with progressive dewatering.As such,a sudden drop in permittivity (around 60%-70% of gravimetric moisture content depending on the pore fluid)could be observed during the process.Similar drops have also been observed (Santamarina and Fam,1997; Saarenketo, 1998; Bore et al., 2016; Mishra et al., 2017),which corroborate well with the present study.
The fraction of pore space in a soil skeleton occupied by air is specified by volumetric air content(θa),which can be expressed as the difference in porosity(η)and volumetric moisture content(θw).With progressive drying, air enters into the soil skeleton and continually occupies more and more pore space. As explained earlier, air phase has a significantly low permittivity, which, when abundant in the system, might have reduced the holistic permittivity drastically.
During the evaporative drying,free water from the soil structure evaporates fast, as practically there is no binding force associated with it. In contrast and as the name suggests, the bound water phase is strongly attached and has low permittivity.Moreover,the percentage of bound water(p)can be estimated using the following relationship (Santamarina and Fam,1997):
p = 0.018c(αK+NhK++αCl-NhCl-)×100 (12)
where c,α and Nhare the molar concentration, stoichiometric salt hydration coefficient (αK+= αCl-= 1 for 1:1 hydration of KCl producing K+and Cl-) and hydration number (4 for K+and 1 for Cl-, Conway,1981), respectively.
Furthermore, as per Robinson et al. (2002), permittivity of bound wateras a function of its distance from grain surface(x) is given by
where εWand dBWare the maximum permittivity of water and thickness of bound water phase, respectively. From Eq. (12), it is imperative that the closer the bound water layer to the soil surface,the lesser the permittivity. The second and third stages of drying witness significant rise in individual contribution of bound water to the holistic permittivity of the system, which can be ascribed as another reason for the observed drop.Santamarina and Fam(1997)observed sluggish increase in real part of the permittivity at low moisture contents in fine-grained systems. In their study, samples with different water contents were prepared (different pore fluid solutions were used:NaCl,KCl,etc.).The drop was explained on the lines of ‘low polarisability of bound water' along with ‘restricted ionic mobility' that occur in fine-grained systems at low moisture contents due to dominance of ‘surface forces' and ‘discontinuous conduction paths'.
It is true that the frequency range of interest in the present study is definitively too high to obtain a complete picture of bound water phase and interfacial process. Nevertheless, the bound water should have a small impact on the permittivity at 1 GHz.Indeed,the relaxation frequency of bound water is probably in the MHz region(Escorihuela et al., 2007; Loewer et al., 2017; Bore et al., 2018) or less (Heimovaara et al., 1994; Lin, 2003), which means that at a frequency of 1 GHz, only the static permittivity should be visible(authors generally agree with a value around 5 for the static permittivity of bound water). The complex permittivity can be modelled as a sum of the different phases:a 4-phase mixing model can be used to take into account the bound water (Dobson et al.,1985; Dirksen and Dasberg, 1993). Therefore, in this framework,the effect of the bound water phase at a frequency of 1 GHz is implicit.
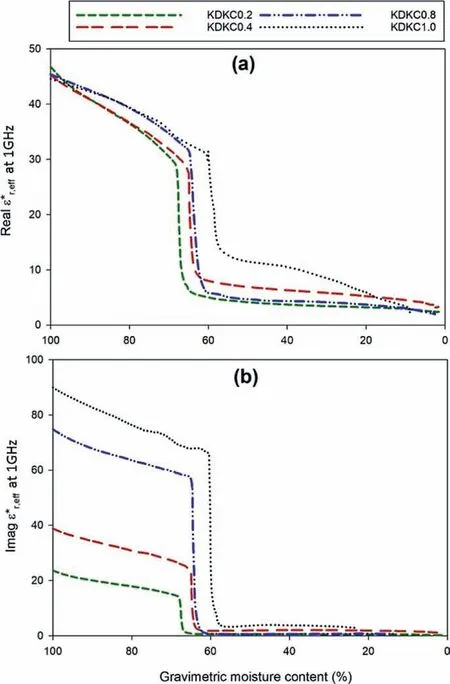
Fig.12. Evolution of(a)real and(b)imaginary parts of ε*r,eff at 1 GHz with gravimetric moisture content for kaolin.
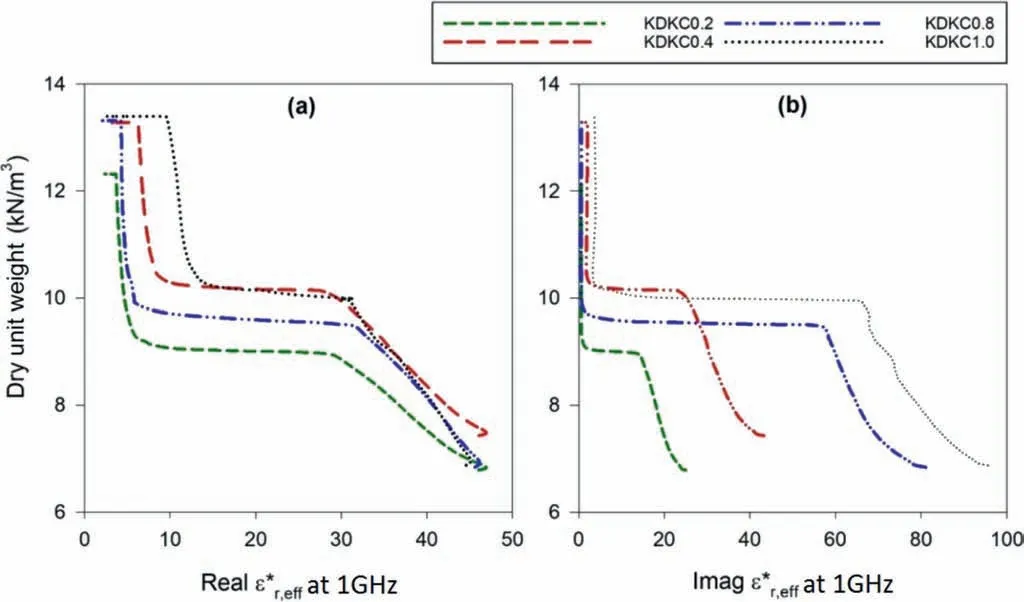
Fig.13. Evolution of (a) real and (b) imaginary parts of at 1 GHz with dry unit weight for kaolin.
Moreover, the drop is also believed to be dependent upon the atmospheric boundary conditions.Salt precipitation and structural evolution in the pore network of the soil could have a causal connection with the drop. In the current scenario, continuous measurements were performed over a large range of moisture contents (measurement started above liquid limit to dry conditions). During this process, the soil progressively undergoes structural changes with alteration in its saturation regime (saturated/capillary →funicular →pendular/dry).Air entry also plays a critical role in soil structure evolution during drying.These processes may not be captured during dielectric measurements on reconstituted samples prepared at different moisture contents as is the case in most of the investigations in this regard.In this context,the change in soil structure could be the origin of the drop. Similar shrinkage tests were performed by Bore et al. (2016) on an organic material(artificial faeces). The evolution of the permittivity observed there had a more complex shape: several drops were observed. The authors pointed out the change of structure during dewatering as a possible origin of such behaviour.Moreover,similar drop has been observed during hydration of cementitious material (Karlovˇsek et al., 2016; Shen et al., 2016). Here, the authors proposed a change in the material structure(the growing of cement matrix)as the origin of the drop.
At the moment,it was complicated to select between these two arguments for the origin of the drop. Dielectric mixing equations could be a good start for a quantitative study of dewatering.But the lack of complete model for the dielectric properties of bound water phase (e.g. a model that would integrate the effect of pore chemistry and topology of particles effect) makes this solution not applicable. Molecular dynamics could provide much information but need to be applied in real case (see for example the work of Gekle and Netz (2012) applied in simple configurations). From the experimental point of view, these aspects require a further extensive and detailed investigation through computed tomography(CT)scanning the sample throughout the process.
Figs. 12 and 13 demonstrate the pore fluid salinity dependent evolution of dielectric response of the samples with gravimetric moisture contents and dry unit weight,respectively,at a frequency of 1 GHz.It can be observed that the imaginary part ofis more sensitive to the pore fluid salinity dependency. Magnitude of the imaginary part was large at high moisture content (around 70%-100%)and low unit weight(around 6.9-9 kN/m3).As the moisture content reduced and the unit weight increased during the dewatering process, the drop was encountered as explained before.After the drop, the imaginary parts reached a steady state. As evident from Fig. 12a, the real parts ofstarted off at almost similar magnitude at high moisture content irrespective of the pore fluid.Prior to the drop,the curves were sorted in order of pore fluid salinity, with the ones having higher pore fluid salinity demonstrating higher value of ε*r,eff(real and imaginary). However, after the drop, this order was not maintained. With progressive dewatering and moisture loss,uncontrolled salinity changes occur inside the soil skeleton, which could have resulted in this kind of observation. Nonetheless, referring to Figs. 12 and 13, the drop appears to be dependent upon the pore fluid chemistry,which may be related to the altered dewatering response under the influence of salinity.
6. Conclusions
The present study focused on an integrated approach to understand pore fluid salinity dependent evaporative dewatering response of kaolin with the aid of dielectric spectroscopy. The following general conclusions can be summarised from the study:
(1) Pore fluid salinity influenced the drying response of kaolin.The higher the initial pore fluid salinity,the slower the speed of evaporative dewatering.
(2) Frequency dependent dielectric spectra of soil,which can be considered as the fingerprint of the transient changes in the condition of the water phase within the pore system of the soil and the associated densification,have been continuously monitored during dewatering using an open-ended coaxial probe with a VNA.
(3) A 3D finite element method based numerical modelling approach based on layered media approach has been performed to establish the spatial sensitivity of the probe,which showed that the vertical spatial sensitivity of the probe is around 3.2 mm.
(4) While the real part of the complex permittivity in the studies reported is somewhat independent of frequency, the imaginary part is strongly frequency dependent in the range of 500 MHz-3 GHz.
(5) Temporal evolution of the dielectric spectra revealed pore fluid salinity and atmospheric boundary condition dependent sharp drops at certain stages of the evaporative dewatering which may be attributed to any of the following individual phenomenon or their combination: air entry, increase in the bound water phase,structural evolution of pore network, and salt precipitation. Further investigations are required to better understand the causal connections of the drop in detail.
Nonetheless, the study highlighted potential of the dielectric measurements during dewatering to quantitatively keep track of the state variables. Moreover, challenges remain to be addressed through modelling such drops in the dielectric window encountered during continuous evaporative drying, through the available physical models, which may potentially be one of the scopes for future work.
Declaration of Competing Interest
The authors wish to confirm that there are no known conflicts of interest associated with this publication and there has been no significant financial support for this work that could have influenced its outcome.
Acknowledgments
This work was supported through ‘Australian Government Research Training Program Scholarship' (formerly ‘International Postgraduate Research Scholarship'), UQ Centennial Scholarship(the University of Queensland) and Top-up Scholarship (School of Civil Engineering, the University of Queensland) awarded to Mr.P.N.Mishra.The support through the Port of Brisbane/UQ research venture is gratefully acknowledged. We thank the anonymous reviewers for their time and suggestions to improve the manuscript.
 Journal of Rock Mechanics and Geotechnical Engineering2020年1期
- Journal of Rock Mechanics and Geotechnical Engineering的其它文章
- On the use of 1g physical models for ground movements and soil-structure interaction problems
- Ground behaviour analysis, support system design and construction strategies in deep hard rock mining - Justified in Western Australian's mines
- Prediction of TBM jamming risk in squeezing grounds using Bayesian and artificial neural networks
- Multi-scale modelling of gas flow in nanoscale pore space with fractures
- Three-dimensional double-rough-walled modeling of fluid flow through self-affine shear fractures
- Numerical study on tensile failures of heterogeneous rocks