
On the use of 1g physical models for ground movements and soil-structure interaction problems
2020-02-18 03:07MarwanAlHeibFabriceEmeriaultHuuLuyenNghiem
Marwan Al Heib, Fabrice Emeriault, Huu-Luyen Nghiem
a INERIS, Parc technologique Alata, Verneuil-En-Halatte, F-60550, France
b Université Grenoble Alpes, 3SR, Grenoble, F-38000, France
c CNRS, 3SR, Grenoble, F-38000, France
Keywords:Subsidence Physical modelling Geotechnical problems Soil-structure interaction
A B S T R A C T The paper focusses on the use of physical modelling in ground movements (induced by underground cavity collapse or mining/tunnelling)and associated soil-structure interaction issues.The paper presents first an overview of using 1g physical models to solve geotechnical problems and soil-structure interactions related to vertical ground movements.Then the 1g physical modelling application is illustrated to study the development of damage in masonry structure due to subsidence and cavity collapse.A largescale 1g physical model with a 6 m3 container and 15 electric jacks is presented with the use of a threedimensional (3D) image correlation technique. The influence of structure position on the subsidence trough is analysed in terms of crack density and damage level. The obtained results can improve the methodology and practice for evaluation of damage in masonry structures. Nevertheless, ideal physical model is difficult to achieve. Thus, future improvement of physical models (analogue materials and instrumentation)could provide new opportunities for using 1g physical models in geotechnical and soilstructure applications and research projects.
1. Introduction
Physical modelling is commonly used in order to study the behaviour of prototypes (Wood, 2006). The universal definition of physical modelling adopted by the Technical Committee of the International Society for Soil Mechanics and Geotechnical Engineering (ISSMGE) (TC104) is “a simplified physical representation of a finite boundary problem for which similarity is sought in the context of scaling laws”.In recent years,computer methods complement and to some extend replace the experimental approach. Nevertheless,physical models have been applied to understanding,assessing and helping stakeholder decisions in numerous disciplines, ranging from the biological and environmental sciences to aeronautics and infrastructure engineering. Key aspects of physical modelling are the process of idealisation adopted to represent geomaterial and structure behaviour, geometric effects, construction costs, the environment, leading to the design of the model.
This paper focusses on the use of physical modelling in ground movements (induced by underground cavity collapse or mining/tunnelling) and associated soil-structure interaction issues. It will first present the state-of-the-art on the 1g models with interest revived in complementarity with centrifuged ng models,where g is the gravitational acceleration (Jacobsz, 2012). The second part is dedicated to an illustration of 1g small-scale modelling for assessment of the behaviour of masonry structures adjacent to underground cavity and the potential damage (cracks).
In civil and environmental engineering, physical modelling has been used with success for decades (Garnier, 2001; Green, 2014),allowing visualisation of the problem and validation and qualification of the numerical modelling(Shiau et al.,2016).The physical modelling and experimental approach are also successful for addressing complex physical problems; the benefits of hands-on teaching and using experimental works have been widely published (Shiau et al., 2016).
In geomechanics,the first simple physical model was developed by Terzaghi (1936), and it is a very simple device (trapdoor) to model ground movements and investigate the arching phenomenon (Adachi et al., 2003). In mining engineering with respect to strata control, a simple box was used to predict the subsidence(Knothe, 1957). The physical modelling currently covers different scales and research areas from laboratory scale to full scale to calibrate the behaviour under realistic conditions (White et al.,2013; Green, 2014).
Researchers aim at combining the advantages of both numerical and physical modelling and improving them (Nakai et al., 1997;Pang, 2009; Aydan et al., 2010). The complexity and uncertainty of engineering problems represent a great challenge to numerical method even with the increase in computer power, leading some researchers to question how far numerical simulation can go.Thus,physical simulations have been reused. Approaches combining physical and numerical modelling extend significantly the capacity of researchers to understand complex phenomena.
The main benefits of physical modelling can be of size reduction,simplification,convenience,and study of complex system(e.g.soilstructure interaction problem). It provides experimental data and observations to validate theoretical and analytical approaches(Fig.1). Despite these advantages, the physical models have their limitations (listed in Section 2). Both physical and numerical modelling techniques are the complementary tools to understand physical phenomena (e.g. soil-structure interaction and structure damage induced by underground movements).
2. Physical modelling for ground movements and soilstructure interactions: state-of-the-art
2.1. Types of physical modelling
The type of physical models depends on the similarity ratio of the prototype from large-to small-scale and from 1g to ng (Fig.1)(Allersma, 1995; Garnier, 2001; Aklik et al., 2010). The main advantages in decision to choose a small-scale physical model in the analysis of an engineering problem include its simplicity and limited cost,the possibility to gain an insight into the behaviour of complex structures or processes and to provide experimental data for validation of numerical models along with parametric studies.The technical and financial aspects of the physical modelling affect the test performance and the quality of the results (Wood, 2004;Green, 2014). The single gravity (1g) laboratory model presents generally three main characters.First,the physical model provides a source of reliable data for supporting numerical modelling and back analysis as the boundary conditions are well defined and controlled.Second,the size of the models can be quite large so that the linear model scale for typical prototypes may be small (Wood,2006). Finally, the full compliance with scaling laws is generally impossible.The use of 1g models is limited because in situ stresses cannot be realistically represented. The ng (centrifuge) physical modelling,based on artificially increasing gravity using a centrifuge to obtain true similarity of stress-strain relationship between the model and the prototype, allows replication of full-scale (prototype) ground stresses within scaled-down models. This ensures that the soil behaviour of the model is the same as that in field,since soil behaviour is a function of the stress level.
The cost of small-scale modelling (whether in centrifuge or under single gravity)is a small fraction of full-scale testing.Physical modelling under single gravity (1g) is generally more economical compared to centrifuge modelling. Therefore, it provides economical means to obtain testing data for validation of numerical models. Scale factors should be then derived, which allow for calculation of the prototype-scale parameters from model-scale measurements (e.g. displacements,strains,stresses, and forces).
Despite their limitations, 1g models are widely used in soft ground tunnelling, mining, geomorphology and soil-structure interaction (Meguid et al., 2008; Trueman et al., 2008; Xu et al.,2011; Berthoz et al., 2012; Al Heib et al., 2013; Green, 2014; Shiau et al., 2014; Pozo et al., 2016).
2.2. Application of physical modelling to soil-structure interaction due to ground movements
Physical modelling is a useful tool for studying engineering problems (Meguid et al., 2008). The physical modelling in geomechanics illustrates the physics of the phenomenon and predicts the behaviour under certain conditions, which may have not been known yet. The physical modelling is also used in rock mechanics and mining science to increase significantly the number of the observations of the rock behaviour and damage evaluation and propagation. The physical modelling techniques highlight the deformation and degradation processes. It is also a useful tool for understanding the mechanism of strata development and consequences on the strata surface(Dyne,1998;Adachi et al.,2003;He et al., 2009; Trckova,2009; Thongprapha et al., 2015; Ghabraie et al., 2017).

Fig.1. Different approaches to study physical engineering problems.
The success of physical modelling is obtained in a wide range of applications including geology,morphology,geotechnical and soilstructure interaction (Randolph, 2001; Adachi et al., 2003; Wood,2004; Caudron et al., 2007; Garnier et al., 2007; Meguid et al.,2008; Trckova, 2009; Masoumi and Vanhonacker, 2013; Green,2014; Hajihassani et al., 2014). The physical modelling includes model geometry, and different types or combinations of loading and soil conditions (Randolph, 2001; Green, 2014; Bałachowski,2017). It is also possibly used in understanding structure behaviour at different stages of construction process and under different permanent, accidental, static and dynamic loads (weight, earthquake, subsidence, etc.).
Several studies investigated the effects of tunnelling on ground movements, tunnel face stability, and soil movement patterns using physical modelling (two- (2D) and three-dimensional (3D))under single gravity or multiple gravities (Meguid et al., 2008).Physical modelling at different scales was developed and employed in different applications of geotechnical engineering problems(Ahmed and Iskander, 2011; Muthreja et al., 2012). Meguid et al.(2008) presented a review of the physical modelling techniques to mimic excavation of tunnels from trapdoor to minatory tunnel boring machines(TBMs).Dinh(2010)extended 1g physical models to simulate the behaviour of rigid inclusions, with analogue soil varying from sand to very soft foam, and the rigid inclusion was simulated by wood beam, polyvinyl chloride (PVC) and steel bars.
2.3. Physical model design
The physical modelling design starts with the purpose of the study objective and the main scientific questions should be answered using the physical modelling.The main steps to build the model are the physical model type,the physical model dimensions,the scale factor,the analogue materials and the instrumentation of the model. The physical modelling procedure and steps should be verified and controlled in terms of laboratory characterisation,numerical modelling and repeatability of the same model under the same conditions for several times. The physical modelling reduces the size of a large and complex structure (e.g. underground excavation,building, and buried structure) named the “prototype”that maintains the same physical characteristics and interactions with the environment to reproduce the true behaviour of the structure in a relevant set of loading conditions. The link between prototype and model is governed by analytical expressions between their relevant geometrical and physical parameters (similarity,similitude laws or scale factors).To design the scaled physical model, one must respect the following considerations:
(1) The design of physical model depends on the purpose of study and constructive characteristics of the prototype;
(2) The physical model(m)must be a true scalar representation of the prototype (p); and
(3) The ratio between the prototype parameter and model parameter defines the scale factor.
According to the similarity theory,the prototype is linked to the model by scale factors, noted by U* = U(m)/U(p), where U(m)is the physical dimension of the model,and U(p)is the physical dimension of the prototype (real scale).
Wood (2004) and Garnier et al. (2007) identified three scale factors that should be taken into consideration when designing physical models: the geometric scale factor, the effective stress scale factor and the effective stress-gradient ratio. For small-scale physical modelling, the length is chosen as the reference and the corresponding geometric scale factor can be noted by L*=L(m)/L(p),where L(m)is the length of the model, and L(p)is the length of the prototype. Obviously, the value of L* is smaller than 1, noted by L* = 1/n (n ≥1). The scale factors on the effective stress and its gradient with depth result from the geometric scale factor and the scale factor on gravity and unit weights.
The boundary conditions should be selected in a similar manner to the prototype. The adopted scale factor should maximise the advantages and reduce the impacts on the results. When different candidate solutions are available, different assessment criteria must be considered: desired outcomes, degree of representation,feasibility of model regarding the availability of the facilities,manufacturing costs and time, and qualified operator and safety conditions.
2.3.1. Geomaterial similarity
According to Garnier et al. (2007), the analogue geomaterial used in geotechnical physical modelling should be (i) repeatable,(ii)operator-independent,and should result in(iii)a tight tolerance in soil conditions.The following parameters should be considered:the specific weight, the elastic parameters and the strength parameters.
The specific weight scale is equal to 1 in the 1g physical model.The Poisson's ratio scale is also equal to 1,and the Young's modulus scale is equal to the scale factor (n). Equivalent geomaterials are generally used to account for possible scale factors on elastic parameters. The granular material (sand) is generally used to simulate the soil because of the limited number of parameters(Garnier,2001;Pozo et al.,2016;Hassoun et al.,2018).The behaviour of the sand depends mainly on the friction angle and density. The scale factor for the friction angle is equal to 1, which facilitates the physical model construction. Different sands are employed with angles of internal friction varying between 30°and 41°. Lee and Yoo (2006) and Lee and Bassett (2007) investigated the behaviour of a tunnel adjacent to a row of loaded piles under 1g conditions. In 2D physical model, the soil is generally replaced by analogue material like Schneebeli rods(Jenck et al.,2005).The 2D model used multi-sized 75-mm-long aluminium rod mixture of various diameters(2 mm,3 mm,6 mm,9 mm,12 mm,and 20 mm).It represented a well-graded, idealised granular material under plane strain conditions.
To consider cohesion(in the case of cohesive soils or soft rocks),different approaches have been employed. Ghabraie et al. (2017)used sand-plaster mixture to simulate the bedding planes and the strata to study longwall excavation. He et al. (2009) used gypsum to model the behaviour of the ground strata to simulate the behaviour of mine roadways. The ratio of water to gypsum was calculated according to the uniaxial compression tests on rock samples. Chemenda et al. (2005) used liquid and solid hydrocarbons to study the landslide and slope stability in three dimensions.The composite analogue material is characterised by an elastoplastic (brittle) behaviour which is sensitive to temperature. Fig. 2 presents an example of small-scale physical model used to simulate the behaviour of a cohesive soil reinforced with geosynthetics when subsidence occurs near the ground surface (Hassoun et al.,2018).
2.3.2. Structure similarity

Fig. 2. (a) Small-scale physical model for localised subsidence of a cohesive soil layer: (b) without and (c) with geosynthetic reinforcement (Hassoun et al., 2018).
Reproducing the true behaviour of a structure (in particular masonry ones) is very complex and presents a challenge for physical modelling for ng and 1g models. The similarity of the structures and components depends on the scale of the physical model. Different options can be considered as possible, i.e. the structure similarity for modelling soil-structure interaction. The equivalent stiffness (EI) is generally more respected than the material characteristics (Al Heib et al., 2013). Few examples of structure models are presented(Laefer et al.,2011;Giardina et al.,2012;Al Heib et al.,2013).Buildings have been mainly modelled as an equivalent beam using the method suggested by Pickhaver et al.(2010). Giardina et al. (2012) studied the building damage due to tunnel excavation using small-scale physical model (Fig. 3). The adopted scale is 1/10, and it is a masonry facade obtained by the assemblage of scaled bricks and thin mortar joints. In soilstructure interaction studies, when considering deep foundations or piles used for soil reinforcement/improvement, the piles are generally represented by wooden bars or metallic bars(aluminium and steel bars) (Caudron et al., 2007; Houda et al., 2013; Bauer et al., 2014; Bel et al., 2016). Recently, 3D printing (3DP) has been used to study soil-structure interaction with ng (centrifuge)physical model(Rittar et al.,2017).The structure is then fabricated without missing essential details. The application in Section 3 describes different techniques used to model a masonry structure using very small pieces of dense wood.
2.3.3. Instrumentation of the physical model
One of the crucial tasks in physical modelling design is the instrumentation of the model.A complete instrumentation allows a detailed exploitation of the physical modelling results (stress,strain,displacement,crack,etc.).Different instrumental techniques have been used in 1g physical modelling for studying strata movements related to mine operations (Fig. 4). The suitable instrumentation accuracy and devices depend on the main objective of the physical modelling. The appropriate data acquisition devices and analysing techniques can be selected in accordance with the objective,role,and desired output.The correlation image techniques are used for monitoring the development of cracks.Photogrammetry is also used to obtain the total displacement contours. In addition, small and accurate stress/strain gauges are used to measure stress and strain (Ghabraie et al., 2015; Nghiem et al., 2015).
Meguid et al.(2008)proposed the use of the conventional linear variable differential transformer (LVDT) to measure the displacements around a tunnel at specific points.Digital image correlation(DIC)method is employed for measuring displacement using video cameras to record the images of the surface of objects (Garcia and Orteu, 2001). He et al. (2009) used the incorporated infrared (IR)detection and IR radiation temperature (IRT) techniques to obtain detailed information in terms of initiation, nucleation and coalescence of the damage in rock masses and the eventual failure of roadways subjected to external loading. The terrestrial laser scanner (TLS), optical non-contact displacement transducers(optoNCDT)and a digital camera are also used to detect the ground movements under the applied loads, as shown in Fig. 5 (Ghabraie et al., 2017). Fig. 5 presents an example of physical model to simulate the behaviour of mining operation and associated subsidence. Obtaining the measurements (e.g. displacements and deformations during different stages of the experiment)is extremely time-consuming and in many cases impossible to perform(Fig. 6).
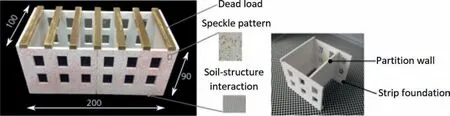
Fig. 3. 3D printed building model (Rittar et al., 2017). Dimensions are in mm.

Fig. 4. Different types of 1g instrumentation and data acquisition devices. AE: acoustic emission; DIC: digital image correlation.
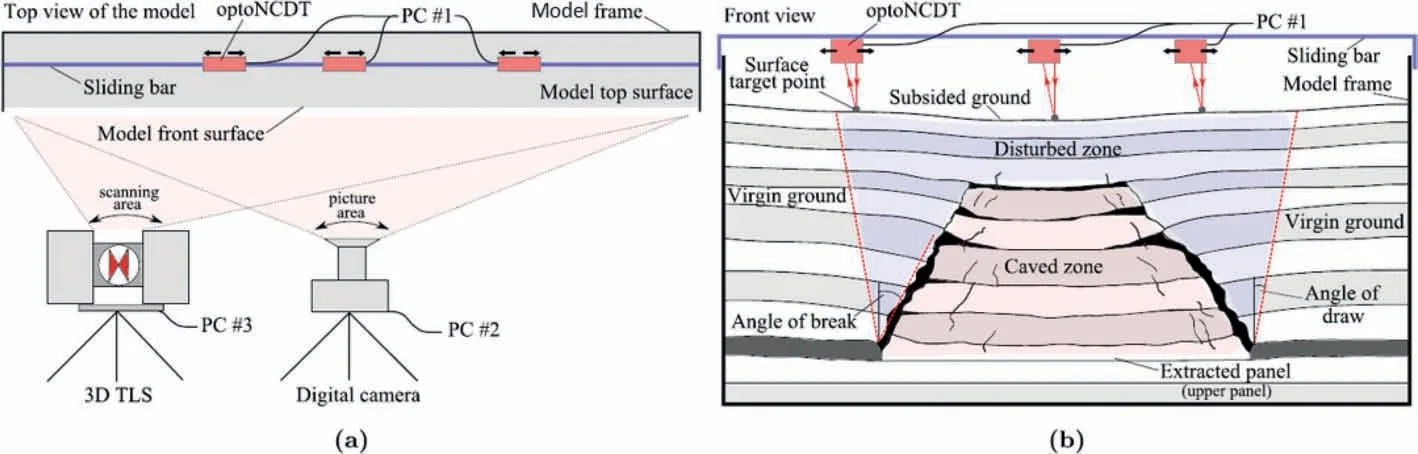
Fig. 5. Physical model to simulate the consequences of the longwall mining on the surface; the model used different modern measurement techniques (Ghabraie et al., 2015).

Fig. 6. Example of hybrid TLS-DIC technique output for surface and substrata vertical deformation contours due to mining excavation (Ghabraie et al., 2015).
The acoustic emission (AE) measuring system and IR thermography technique are used to measure the progress of failure and deformation.The signals from AE measurement system can depict the transition from elastic to plastic behaviour.It can also show the occurrence of local cracking around discrete AE sensors at different times.But, AE measurements are unable to produce an illustrative output. IR thermography requires a complicated calculation process. The cavity growth mapping with 3D laser scanner can precisely monitor full-field cracking and caving process in a timely manner; however, it cannot show the failure areas clearly compared with the AE measuring system. The main advantage of the method is the monitoring of the surface subsidence.
Small pressure cells are generally used to monitor stresses or forces.For example,Jenck et al.(2005)instrumented the pile heads by load cells to measure the vertical load acting on the pile and to determine the load distribution at the platform base between the soft soil and the stiff piles, as the platform weight is known.
2.4. Recent 1g physical models
Table 1 presents several examples of recent physical models for soil,rock and soil-structure interactions over the last two decades.The state-of-the-art clearly highlights the physical modelling (1g)used to simulate the behaviour of complex configurations. The main objective is to observe the physical behaviour of the structure under specific loads (subsidence, tunnel excavation, cracks, landslide, etc.).

?
The geometric scale factor(n)covers a large range,from 10(e.g.Beguin et al., 2012; Giardina et al., 2012; Houda et al., 2013;Sreelakshmi et al., 2016) to more than 200 (e.g. Zhu et al., 2011;Ghabraie et al., 2015; Zhang et al., 2017). A small factor value(n = 10) is often used to simulate the details of the structure.
To simulate the soil, different types of sands are generally used(e.g. Lee et al., 2004; Beguin et al., 2012; Sreelakshmi et al., 2016),because the sand offers the main advantage of a friction angle equal to that of prototype and physical model. Unfortunately, it is generally more difficult to simulate the rock and to introduce the cohesion, thus gypsum, plaster, iron powder, and other materials have been used with specific water content in physical modelling(e.g. Trckova, 2009; Ren et al., 2010; Ghabraie et al., 2017).
To simulate the structural elements (foundation, masonry structures, etc.), different materials are used to obtain the equivalent bending and shear stiffnesses,whereas wood, aluminium and steel are used to simulate small-scale piles(Bel et al.,2016;Houda et al.,2013)and small dimensions of real masonry bricks(Giardina et al.,2012;Chen et al.,2016).In addition,very original equivalent materials have been used to simulate specific behaviour (creep,thermic deformation, etc.), e.g. latex balloon, liquid, and solid hydrocarbon (Chemenda et al., 2005; Zhang et al., 2017).
From the presented examples, the evolution of the instrumentation is noticed from the beginning to the recent physical models:the first physical models are only based on the direct observations,while very sophisticated monitoring systems like fibre optics are used recently (Zhang et al., 2017). The digital camera and laser scanner are used to determine the whole deformation of the ground and/or structure (Ghabraie et al., 2017).
Chen et al. (2016) carried out a series of small-scale physical tunnel model tests to represent the true behaviour of a tunnel under external loading; the length scale is 1/10 using masonry blocks and mortar. The main result was the identification of the cracks and damage of the support elements due to external loads.The results have been compared to numerical modelling and in situ observation.
He et al. (2009) carried out a large-scale physical model to capture the mechanism of roadway instability in deep mines.They carried out physical modelling of the deformation and failure processes of roadways. Due to size limitation of the centrifuge model,it is not likely to model the whole soil-rock profile down to the depth of the mining operations. Therefore, a hydraulic system was designed to model the bedrock displacement due to mining so that the effect on the surface ground movements could be studied.
Giardina et al. (2012) studied the response of a masonry structure(Fig.7).This study presented an experiment carried out on a 1/10-scaled masonry facade subjected to tunnelling-induced settlement.The main objective of this study was to provide accurate and reliable experimental data for validation of numerical results. The masonry structure was simulated by small masonry bricks with equivalent specific mortar. A specific mechanical system was developed to apply the subsidence curve on the structure. The photogrammetry of the facade was observed and analysed during different phases of the simulations. The results demonstrate the effects of soil-structure interaction and the presence of openings and brittle masonry cracking on the final damage, with up to 6.3 mm crack width for a maximum applied settlement of 10 mm.
2.5. Summary
It is shown that 1g physical modelling is a modern and an excellent tool for studying geotechnical industrial problems, e.g.mechanical, hydro-mechanical, thermal, and soil-structure interaction. Thanks to the development of very small measurement devices (for measuring displacements, pressures, etc.) and image correlation, the interpretation of the physical modelling results becomes accessible. The physical modelling (whether 1g or using centrifuge)presents an intermediate approach between the in situ experiment and the numerical modelling. The realistic conditions of the physical modelling allow enriching the observations and providing data to improve the numerical models. The main limitation of the physical model is the scale factor for all geometrical and mechanical parameters of the material and geomaterials.
For this, the impact of underground movements on a masonry structure will be presented as an example using large-scale 1g physical model.
3. Example of 1g physical modelling applied to damage in masonry structures induced by ground movements

Fig. 7. Physical model (experiment) to simulate the effect of the tunnel excavation on masonry structure (Giardina et al., 2012).
The state-of-the-art related to soil-structure interaction and geoengineering problems presented above will be illustrated with an example. The objective of this physical model is to understand the development of damage in a masonry structure due to underground collapse (natural cavities, mines, etc.). The previously presented steps to build physical model will be discussed using a largescale physical model.
The masonry structures can be damaged by collapse of the natural and anthropic cavities (Burland et al.,1977; Franzius et al.,2004; Sung et al., 2006; Standing and Lau, 2017; Giardina et al.,2018). The considered 1g physical model has been designed with respect to the theory and practice of physical modelling requirements(Wood,2004;Caudron et al.,2007;Hor et al.,2011).The objective of the physical model is to simulate the movements of the ground surface due to mining and/or underground cavity failure(and associated soil-structure interaction) and to evaluate the damage and vulnerability of structures and infrastructures. The model has been presented in detail by Al Heib et al. (2013). It has been designed as an experimental tool to study ground movements,consequences on structures and infrastructures,and to test and improve technical solutions to reduce vulnerability and risk.The rigid container supports a soil mass of up to 3 m×2 m×1 m.The model is equipped with 15 electrical jacks, each presenting a square section (250 mm × 250 mm) and the maximum displacement(250 mm).The movements at ground surface are achieved by vertical downwards movements of electrical jacks placed on the bottom of the model. The electrical jacks can move separately,simulating different scenarios of underground collapse of cavities or mining; different magnitudes and shapes of movements can be applied on the lower boundary of the container (Fig. 8). In this context, we will present the results of damage induced in a masonry structure for different critical positions of this structure in the subsidence trough. The characteristic dimensions of the physical model are related to the dimensions of the prototype by a geometric scale factor n. The dimensions are determined in order to reproduce the ground movements and the behaviours of the masonry structures. The physical model of structure and soil corresponds to a scale factor (n) equal to 40.

Fig.8. Large-scale 1g physical model(with 15 electrical jacks).(a)General view of the 1g physical model; (b, c) Details on electrical jacks used for the application of ground movements.
3.1. The analogue soil
The analogue soil is Fontainebleau sand (essentially silica with SiO2content >98%),which is well-known by researchers in physical geotechnical modelling and mainly for ng physical centrifuge modelling (Garnier, 2002; Yavari et al., 2014). The density and mechanical characterisations of this sand have been presented in Al Heib et al. (2013). The similarity of the conditions requires the stress σsand Young's modulus of the soil Esto be reduced by 1/n:σ*=E*=1/n(n=40)because the stress and the Young's modulus of a point are increasing with the depth H,i.e.σs≈εEs≈γH,where γ is the soil unit weight, and ε is the strain of a point in soil.
3.2. The structure
The reference building corresponds to an individual house.The modelled geometry is based on the database of individual houses damaged during the collapses of several iron mines (Serhal et al.,2016). The dimensions of the masonry two-floor house are 10 m×10 m(Young's modulus of 6000 MPa and Poisson's ratio of ν = 0.3) with reinforced concrete slabs (Young's modulus of 30,000 MPa and Poisson's ratio of ν=0.2)and shallow foundations are considered (Fig. 9).
The first model considers a simplified representation of the structure: this equivalent slab is made of polycarbonate and directly lies on the cohesionless sand surface(Al Heib et al.,2013).This structure model is very easy to reproduce, and it allows carrying out several tests in a short time period. Nevertheless, the simulation of the masonry building by a slab cannot identify the damage and the induced cracks. Difficulties related to material choice have been tackled and are extensively discussed (Al Heib et al., 2013). A second physical model “more realistic” has then been investigated. The foundation is made of silicon and blocks of masonry walls are made of wooden pieces (Azobe wood, dense wood type). The contact between blocks corresponds only to friction(cohesionless).Table 2 summarises the mechanical properties of the physical model (Fig. 9).
Geometrical and mechanical properties presented in Table 2 adequately meet the requirements of similarity conditions, and verification is required to ensure the global similarity behaviour between the model and the prototype. The first condition is related to the scale factor of the bearing capacity of soil. The bearing capacity in the prototype scale is qa(p)= 185 kN/m2, and this value must be reduced by 1/40 in the model scale, i.e.qa(m)= 4.63 kN/m2. In the model scale, the real stress due to structure model weight at the soil-structure interface is σstr(m)= 0.41 kN/m2<4.63 kN/m2(Table 2). Consequently, the bearing capacity in the model scale is satisfied because it is much higher than the applied stress. The second condition is linked to the scale factors of relative stiffness.According to Table 2,the scale factor of the relative bending stiffness is r*f=1.15 >1 and that of the relative axial stiffness is r*a=0.048 ≈0.05.This means that the model has a relative bending stiffness slightly greater than required one, while the relative axial stiffness satisfies the similarity conditions.
3.3. Measurement technique
The displacements and deformations of the soil and structure are measured using the DIC technique (Fig.10). The measurement procedure and methodology are well described in Al Heib et al.(2013). The localisation of the cracks in the masonry structure(opening joints)is determined using a correlation quality indicator provided by VIC-3D for each correlation analysis (VIC-3D, 2010).

Fig. 9. Physical model of the typical house of small-scale model: (a) Plane view; (b) Cross-section; and (c) Model of the masonry structure. All the dimensions are given in mm.
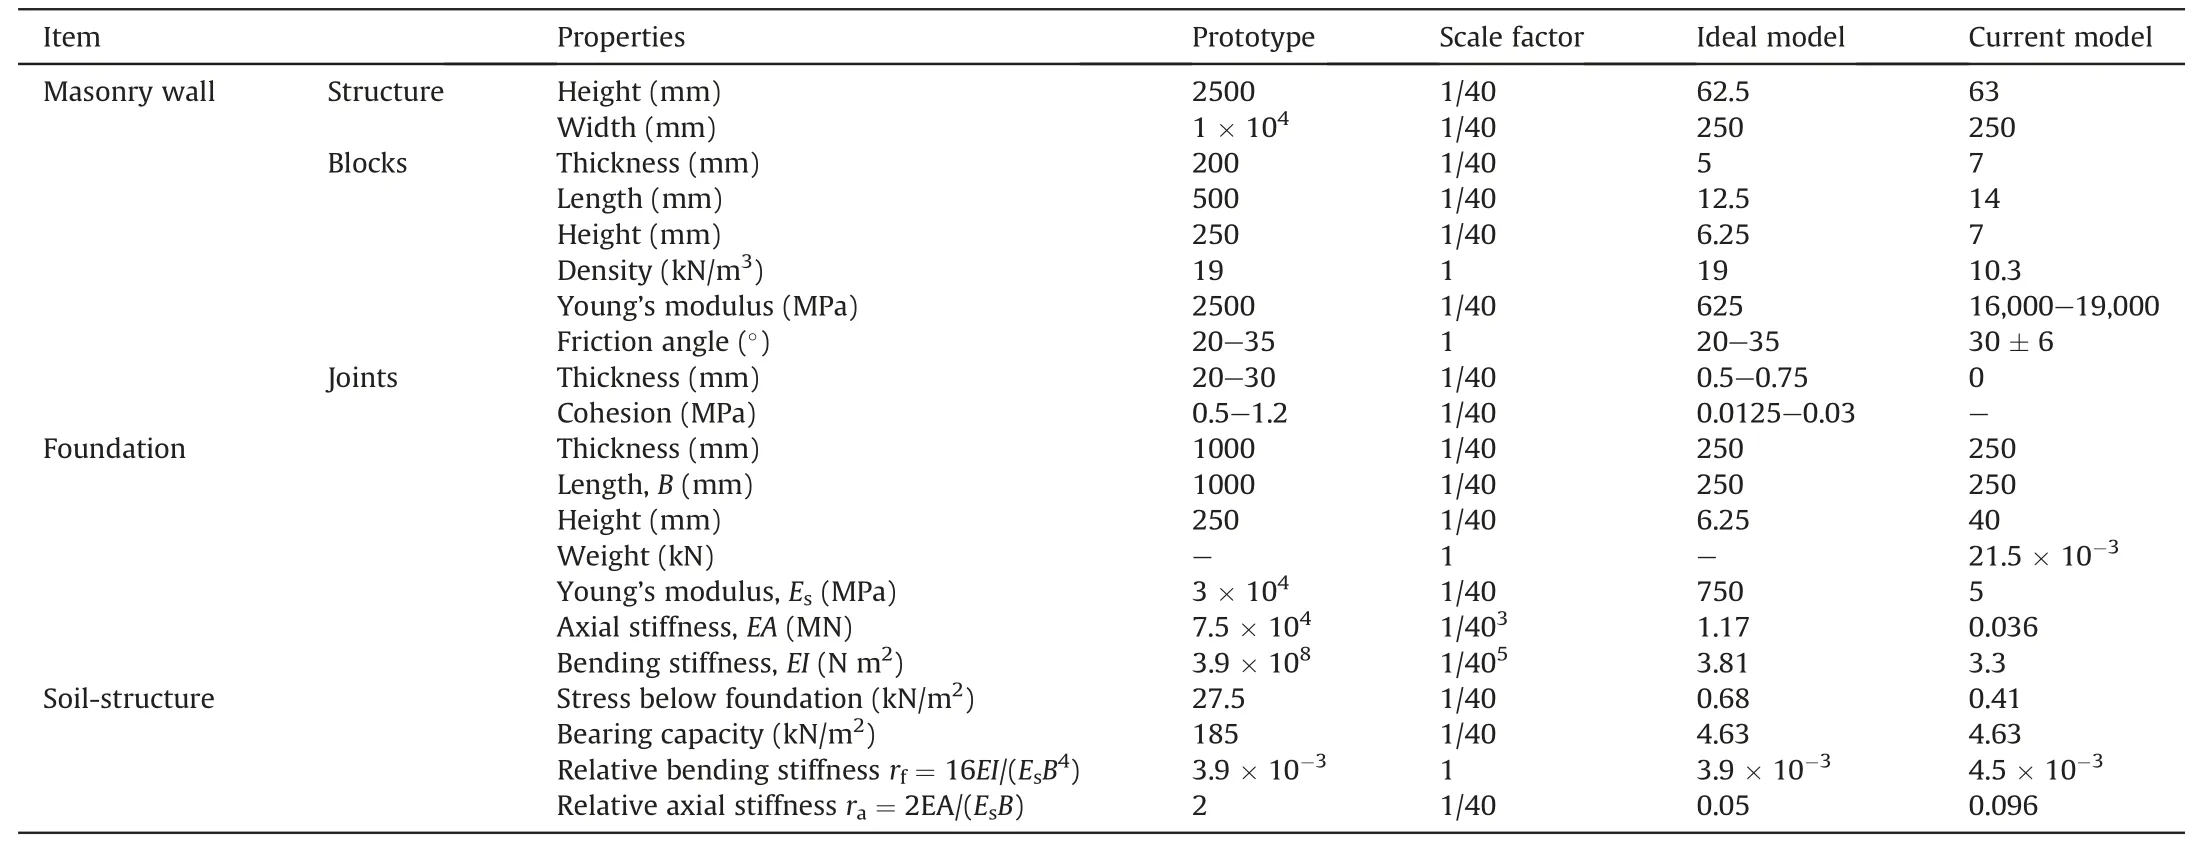
Table 2 Geometrical and mechanical properties of the small-scale physical model.
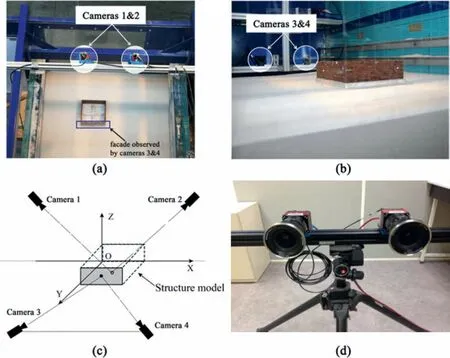
Fig. 10. 3D physical model of soil-structure interactions. (a) Two cameras monitoring the soil surface movement; (b) Two cameras monitoring one facade of the structure; (c)Position of cameras; and (d) Detailed view of two cameras mounted on the support system.
3.4. Test procedure
The test procedure includes the following five steps:
(1) Preparation of the soil surface to create a cover layer of sand with a homogeneous density.The density was controlled by lightweight and variable energy dynamic penetrometer tests(Panda test).
(2) Construction of the structure model: foundation and masonry walls.
(3) Installation of the structure model on the ground surface for different positions.
(4) Installation and calibration of cameras. A snapshot is then taken by cameras 1 and 2 to ensure that the ground surface is flat enough with a tolerance of less than 5 mm over the whole 3 m × 2 m surface.
(5) Application of the displacement of jacks with a constant velocity and image acquisition.
The acquisition by cameras is launched with a frequency of 0.5 Hz simultaneously with the development of ground movements(the jack moves vertically downwards with a constant velocity of 0.15 mm/s). The test ends when the displacement of the jack reaches 30 mm,corresponding to 1.2 m considering the adopted scale factor(1/40).Before dismantling the experiment,images are taken and analysed to determine the displacements of both the ground surface and the structure. All the steps of the experiment are generally performed within one working day(10 h approximately).
Using the DIC software on all the recorded images, one can easily determine the evolution of vertical and horizontal displacements and strains during the experiment. Fig.11 presents the examples of the obtained final displacement.Different profiles can be drawn to analyse the soil and structure behaviour, not only at the end of the experiment but also during all the applied movements of the vertical jack.
3.5. Analysis of structure damage induced by ground movements
In this study,tests were carried out in greenfield conditions and in the presence of structure to study the influence of structure position.The objective is to evaluate the effect of the position of the structure relative to the cavity centre. Different researchers investigated this question using analytical and numerical models (Potts and Addenbrooke,1997; Franzius et al., 2004). The position of the structure is characterised by the ratio e/L, where e is the distance from the structure centre to the cavity centre,and L is the structure length.
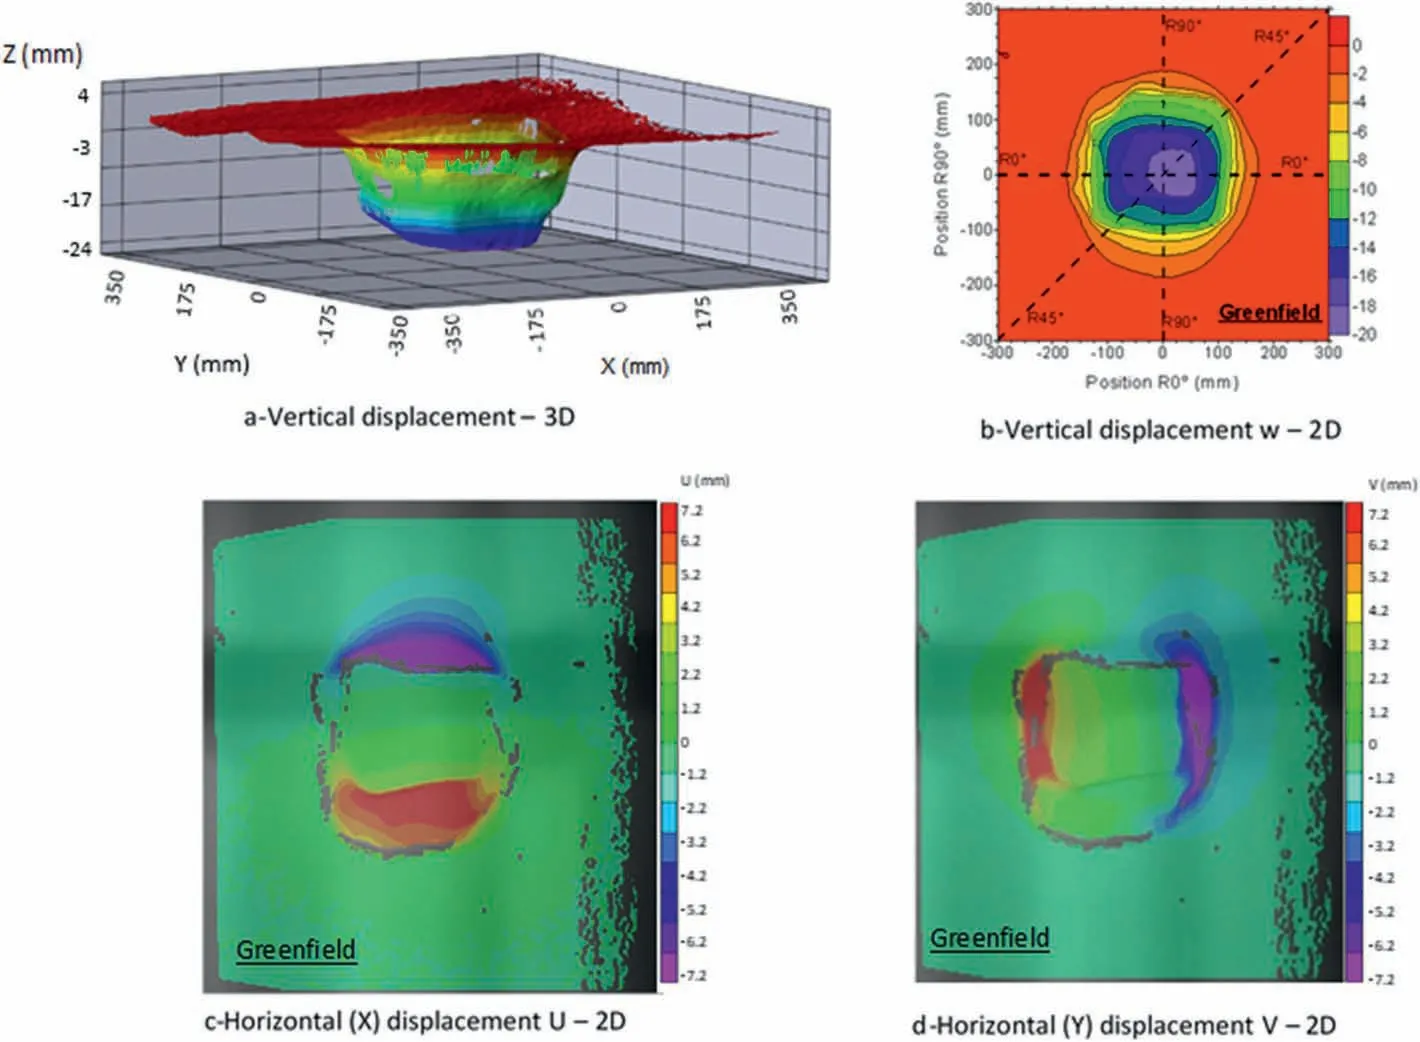
Fig.11. Example of the visualisation of(a)3D subsidence and(b)2D iso-contours of subsidence,2D iso-contours of horizontal displacements in(c)X direction and(d)Y direction.The model corresponds to 300 mm thickness of a sand layer subjected to 30 mm vertical displacement of the jack.
The damage assessment process of the masonry structure is divided into two steps: (i) the first step involves damage quantification using movement indicators, and (ii) the second step deals with the qualitative analysis of the failure modes (e.g. using crack maps) to eliminate other factors (e.g. construction defects, and temperature (Nghiem et al., 2015)). Five damage categories and classes based essentially on crack width are used to quantify the damage level (Boscardin and Cording,1989; Burland,1995; Serhal et al., 2016).
Fig.12 presents three critical positions of the structure in relation to the subsidence profile.In this figure,the position P1relates to the case where the structure is completely in compression(sagging) with no-eccentricity in both X and Y directions, i.e. eX/L = eY/L = 0. The position P2describes the structure in tensile situation (hogging)with ratios eX/L = eY/L = 0.5. Finally, the position P3corresponds to a mixed configuration where the structure is subjected to tensile stresses in the X direction (eX/B = 0.5) and compression stresses in Y direction(eY/L = 0).

Fig.12. Applied vertical displacements(red point),induced subsidence(the maximum subsidence is 24 mm,corresponding to the red zone),and damage observed on the masonry structure. The red point is the centre of the cavity (jack).

Fig.13. Crack maps of P3 configuration when the jack displacement reaches(a)10 mm and(b)20 mm.(X,Y)are the coordinates of the observed wall.In prototype scale,class D0&1 corresponds to crack width from 0 to 1 mm.
For the three positions and three values of vertically applied subsidence(10 mm,20 mm,and 30 mm),the behaviour of soil and the masonry structure is completely different compared to that in greenfield (Fig. 11) and different positions of the structure(Fig. 13). The presence of the masonry structure modified the amplitude and the shape of the subsidence trough compared to the greenfield configuration. The subsidence trough becomes dissymmetric depending on the position of the structure. In addition, the amplitude of the subsidence decreases (red colour corresponds to 24 mm). The level of damage logically increases with increase of the amplitude of the vertical displacement(subsidence), from light damage for subsidence smaller than 10 mm (few cracks are observed) to severe and destruction for 30 mm.The damage for the positions P2and P3is characterised by the complete destruction of one wall. Fig. 13 represents the damage maps for position P3based on the localisation of the cracks for the five damage levels (see Table 3). In position P3, the behaviour of the structure is due to the combined effect of tilt and horizontal strain(Fig.12).Large cracks and severe damage(D4&5)initially appear at mid-span of the wall and then rapidly increase,especially when the jack displacement increases from 10 mm to 20 mm (Fig.13). In this configuration(P3),the structure loses the support from the soil and it is in cantilever position that favourites the tensile stress and crack opening.

Table 3 Typical damage classification systems(Boscardin and Cording,1989;Burland,1995;Serhal et al., 2016).
Fig.14 represents the evolution of the relative cumulated length of cracks corresponding to different damage classes(D3,D4and D5)and for 6 physical models (2 tests for each position), and the total jack displacement is 30 mm. The effect of the structure position with respect to the centre of the subsidence trough is clearly visible.When the jack displacement reaches 10 mm, the observed wall(Fig. 10) at position P1presents a cumulated length of cracks in damage categories D3and D4&5limited to= 2.1% and= 0.4%. For the structure in position P2, the observed crack lengths are greater due to the overall loading in extension and tilt:3(m)= 9.9% and4&5(m)= 1%. Regarding the position P3, the observed wall presents cumulated damages3(m)= 6.6% and4&5(m)=0.7%.Fig.14 indicates that the evolution of crack lengths is related to the amplitude of the displacement of the jack (subsidence)and the position of the structure.For positions P1and P2,the evolution is nonlinear and reaches stabilised values. On the opposite, for position P3, the damageis steadily increasing and leads to the total collapse of the wall.The obtained results showed that the structure in position P1(sagging zone) is subjected to a moderate level of damage.Cracks are located at the two extremities of the wall,indicating a local failure.For the structure at position P2,the structure is in a very severe damage level, in which numerous cracks are observed on the upper part of the wall, located in the contact areas between the soil and the foundation.The evolution of the crack length for classes D3and D4&5can be divided into two parts. Linear tendency is observed when the jack displacement increases from 0 to 10 mm, and then the crack density becomes stable, indicating a stationary trend until the end of the test. At position P3, the structure is highly damaged, causing the fall of blocks and the collapse of walls.Consequently,this damage state is classified as a very severe damage level. For the observed wall,numerous wide cracks are reported at the top of the wall as that in the case of the position P2, but the crack density is much higher,particularly when the jack displacement exceeds 10 mm.Therefore,the collapse of walls can be observed when the jack displacement is greater than 20 mm.

Fig.14. Relative cumulated length of cracks (L*D) for damage classes: (a) D3 and (b) D4&5, and three positions (P) and two tests (T).
4. Conclusions
The study of geotechnical problems benefits from the advance of modelling.In this context,we presented first an overview of using 1g physical models to solve geotechnical problems and soilstructure interactions related to vertical ground movements. Then we focused on the illustration of the usefulness of 1g physical modelling to study the masonry damage due to subsidence and cavity collapse. The main findings are listed as follows:
(1) Selection of 1g and/or ng physical modelling depends on the laboratory capacity and the purposes of study. The applications of 1g experiments are linked to the scale factor varying from 10 to 700.Advanced measurement techniques like fibre optics and laser scanning are now used in some applications of physical modelling.
(2) The main difficulty of building 1g physical model is to respect the full similarity laws. Thanks to feedback and researcher efforts, new materials are continuously suggested and applied in geotechnical and soil-structure interaction topics.
(3) A large-scale 1g physical model with a 6 m3container and 15 electric jacks is constructed. An illustration of the model capacity has been presented: determination of the damage process in a masonry structure subjected to soil subsidence.In particular, we observed and analysed the influence of structure position on the subsidence trough.
(4) Additional improvement of physical model, analogue materials and instrumentation is required to provide new opportunities for using 1g physical models in geotechnical and soil-structure applications and research projects.
Declaration of Competing Interest
We wish to confirm that there are no known conflicts of interest associated with this publication and there has been no significant financial support for this work that could have influenced its outcome.
 Journal of Rock Mechanics and Geotechnical Engineering2020年1期
- Journal of Rock Mechanics and Geotechnical Engineering的其它文章
- Inhibition effect of swelling characteristics of expansive soil using cohesive non-swelling soil layer under unidirectional seepage
- Ground behaviour analysis, support system design and construction strategies in deep hard rock mining - Justified in Western Australian's mines
- Prediction of TBM jamming risk in squeezing grounds using Bayesian and artificial neural networks
- Multi-scale modelling of gas flow in nanoscale pore space with fractures
- Three-dimensional double-rough-walled modeling of fluid flow through self-affine shear fractures
- Numerical study on tensile failures of heterogeneous rocks