
Exploring the Performance of Magnetic Immobilized Lysozyme on Sludge Hydrolysis and Mechanism of Improving Dewaterability of Excess Sludge
2019-12-06 09:00:00XUEFei薛飞CHENQin陈钦LIYulongLIUEryanLIDengxin
XUEFei(薛飞)CHENQin(陈钦)LIYulongLIUEryanLIDengxin
1 College of Environmental Science and Engineering, Donghua University, Shanghai 200051, China2 State Environmental Protection Engineering Center for Pollution Treatment and Control in Textile Industry, Donghua University, Shanghai 201620, China
Abstract: The performance of the immobilized lysozyme and the native lysozyme on enhancing the excess sludge dewaterability was investigated. The results indicated that the specific resistance to filtration (SRF) decreased by 62.8% for native lysozyme and 53.6% for immobilized lysozyme at the enzyme dosage of 9 mg/g (dry sludge). Correlation analysis was carried out to explore the role of different extracellular polymeric substance (EPS) fractions on excess sludge dewaterability. The results illustrated that the SRF negatively correlated with protein, polysaccharide from soluble EPS (S-EPS) and loosely bound EPS (LB-EPS) and positively correlated with that from tightly bound EPS (TB-EPS). Three-dimensional excitation emission matrix (3D-EEM) fluorescence analysis combined with the scanning electron microscope (SEM) images, revealed that sludge floc structure and microbial cells were destroyed by enzymatic treatment, and that the enzymatic hydrolysis could help to improve the transformation of hydrophilic groups from TB-EPS and the performance of the excess sludge dewatering process. The assessment of hydrolysis using the immobilized enzyme provided a new insight for the safe disposal of the sludge.
Key words: excess sludge; immobilized lysozyme; dewatering; magnetic nanoparticles
Introduction
The activated sludge technology is widely used in present municipal wastewater treatmentplants (WWTPs) generating a large amount of excess sludge. The large quantities of excess sludge would require considerable attention, the effective treatment, and the dispose methods as they cause serious environmental and health problems[1]. After condensation, the excess sludge still contains more than 94% water flowing in huge volumes. From 2007 to 2013, the amount of excess sludge produced, increased at an average annual rate of 13% in China. More than 5 million tons of sludge (dry solid basis) was being disposed by the improper dumping /or without further dewatering treatment[2]. Since sludge disposal is a very complicated process, the effective and safe treatment process is still inevitable. However, it is still an uphill task due to distinct properties of sludge floc, such as surface charge, particle size, flocculating ability, and extracellular polymeric substances (EPS)[3].
A number of technologies have being used to improve the sludge dewatering, such as ultrasonication[4], thermal treatment[5], freezing and thawing[6], and chemical treatment, including ozone treatment[7], acid and alkaline hydrolysis[8]. Nonetheless, there are some shortcomings in the aforementioned methods. In that regard, most of them require large energy-consumption, complex operating conditions, and they are not eco-friendly. Therefore, there is an urgent need to develop the efficient and environment-friendly methods for the sludge dewatering. In recent years, the biological-enzymes treatment methods have been proven to be an effective catalyst method for sludge disposal. It has better dewater ability and is very economical. It also has reduced the reaction time. Besides, all the products during the whole enzymatic process are environmentally friendly. According to the previous investigations, the enzymes are able to improve the sludge biodegradation rate by a considerable amount. Chenetal.[9]and Guoetal.[10]found that enzymatic hydrolysis significantly improved the degree of dewaterability of wastewater sludge. Arun and Sivashanmugam[11]pointed out that multi-enzyme combination could accelerate hydrolysis of excess sludge. The protease and the amylase were widely used in sludge pre-treatment process due to the effective solubilisation of excess sludge. In another case, lysozyme was used to promote the waste activated sludge bio-degradability, it showed a great performance in disrupting the bacteria flocs and attacking the macromolecules in the sludge[12]. Additionally, the contents of the organic substances such as protein, polysaccharide, and humic acid in the sludge underwent a change, which were caused by the lysozyme as it hydrolyzed the extracellular polymeric substances (EPS)[13]. In summary, the available studies on enzymes to improve the sludge dewatering only relied upon free enzymes which are difficult to recover and to reuse.
Magnetic metalnanoparticles have been widely used in enzyme immobilization due to their super paramagnetic, high surface area, and easy separation from the reactor under the external magnetic field[14-15]. Cellulose as the most common and inexpensive natural organic compound, showed some attractive properties, such as self-assembly, biodegradability, eco-friendliness, thermal stability, and solvent stability[16]. Namdeo and Bajpai[17]studied the preliminary starch degradation of α-amylase, and immobilized onto cellulose-coated magnetite nanoparticles. In another study, a novel cold active esterase was immobilized onto Fe3O4@cellulose nano-composite to enhance catalytic properties[18]. However, the previous studies mainly focused on the properties of immobilization enzyme, and the significant part is that the studies on enzyme immobilized onto magnetic nanoparticles for improving the sludge biodegradability were not effective enough.
In the current study, Fe3O4nanoparticles and magnetic cellulose nanocomposites were synthesized separately. The lysozyme was immobilized onto the magnetic cellulose nanoparticles successfully. The performance and efficiency of the immobilization-lysozyme hydrolysis and the EPS for improving the dewatering of the sludge were investigated. Three-dimensional excitation emission matrix (3D-EEM), fluorescence techniques, and the scanning electron microscope (SEM) were used to explore the mechanism of enhancing the sludge dewaterability from the perspective of changes on EPS factions and the sludge morphology.
1 Materials and Experiment
1.1 Materials
1.1.1Chemicalsandenzyme
Cellulose microcrystalline (CM), ferric chloride hexahydrate (FeCl3·6H2O), sodium acetate (NaAC), polyethylene glycol (molecular weight 1 500), lysozyme whose activities were 20 000 U·mg-1, and epoxyl- chloropropane were purchased from Sino Pharm, Shanghai, China. Dimethyl sulfoxide(DMSO)was obtained from Lingfeng Chemical Reagent Co., Ltd., Shanghai, China. Other chemicals were purchased domestically and used without further purifications.
1.1.2Wasteactivatedsludge
Waste activated sludge was obtained from the Songjiang Municipal Sewage Treatment Plant in Shanghai, China with a capacity of 1.38×10⁵m3/d. The collected sludge was stored at 4 ℃ before being utilized. pH, water content, total suspended solid (TSS), volatile suspended solid (VSS) and VSS/TSS of the sludge were 6.97 ± 0.01, (99.12 ± 0.11)%, (6.53 ± 0.61) g/L, (5.12 ±0.51) g/L, and 0.78, respectively.
1.2 Experimental procedure
1.2.1Magneticcellulosemicrospheressynthesis
Firstly,Fe3O4was synthesized by a previously prepared method[19]. Briefly, FeCl3·6H2O (1.35 g, 5 mmol) was dissolved in ethylene glycol(40 mL) to form a clear solution, followed by the addition of NaAc (3.6 g) and polyethylene glycol(1.0 g). The mixture was stirred vigorously for 30 min and then sealed in a Teflon-lined stainless-steel autoclave (50 mL capacity). The autoclave was heated to and maintained at 200 ℃ for 10 h and was then cooled at the room temperature(25 ℃). Having being washed several times with ethanol and deionized water, the black products were freeze-dried. The magnetic cellulose microspheres were synthesized by the following method, and the synthesized process was shown in Fig. 1. A solution with NaOH/urea/H2O with corresponding ratios of 7∶12∶81 by weight ratio was used to dissolve cellulose[20]. The aqueous solution was pre-cooled below -10 ℃. A total of 5 g cellulose was immediately dispersed in the pre-cooled solvent of 100 mL by vigorous stirring to obtain a transparent cellulose solution. A total of 0.3 g Fe3O4was added to the 20 mL deionized water to obtain a magnetic fluid by ultra-sonication for 15 min. Then, this magnetic fluid was added into the cellulose solution to obtain a mixture of the magnetic nanoparticles and the cellulose solution. A suspension containing 300 mL paraffin oil and 20 mL Span 80 were mixed in a three-necked flask and then stirred at 1 000 r/min for 30 min. Subsequently, 60 mL cellulose solution mixture was added into the suspension drop by drop within 1 h at the room temperature. After stirring for 2 h, the suspension in the vessel was kept for an additional 3 h at 1 000 r/min. The pH was adjusted to 7 by adding dilute hydrochloric acid (10%). Thus, at this stage the magnetic nanoparticles (Fe3O4) were coated with cellulose. After the removal of the liquid paraffin, the magnetic cellulose microspheres were washed with deionized water and acetone three times respectively to remove the residual liquid paraffin and Span 80. Finally, the magnetic cellulose microspheres were freeze-dried.

Fig. 1 The synthesized process of MCMs
1.2.2Immobilizationoflysozyme
The lysozyme immobilization was carried out by the forthcoming method. About 0.1 g magnetic cellulose nanoparticles were added to a glutaraldehyde solution of 10 mL, with a concentration ratio of 1.0% (v/v). The mixture was stirred rigorously for 4 h at the room temperature. Following the cross bonding, the glutaraldehyde/magnetic cellulose nanoparticles were separated with an external magnetic field. The based material was washed by phosphate buffer (pH=7) for three times. After that, 5 mL lysozyme (1 mg/mL) was added into the based material for adsorption for 1 h at the same temperature as a cross-linking procedure. The lysozyme/magnetic cellulose bio-conjugate material was separated by the external magnetic field, then, the supernatant solution was collected. The powder was rinsed for three times with phosphate buffer. The material obtained was re-suspended in the buffer solution and stored in the refrigerator at 4 ℃. The amount of enzyme immobilized onto microspheres was determined in protein terms by using Bradford method. A typical flowchart illustrating the immobilization process was shown in Fig. 2.

Fig. 2 Typical flow chart of illustrating the immobilization strategy of lysozyme
The loading percentage of enzyme was presented in Table 1 based on the following equation:
(1)
wherepis immobilization efficiency (%),C0is the initial concentration of lysozyme solution (mg/mL),V0is the initial volume of lysozyme solution (mL),C1is the concentration of lysozyme in mixed solution after immobilization (mg/mL), andV1is the volume of mixed solution after immobilization (mL).
1.2.3Immobilizedlysozymeactivityassays
The activity of immobilized lysozyme was measured by the following steps. The 10 mg (dry weight) immobilized lysozyme was added into 2.5 mLMicrococcuslysodeikticuscellsuspension (0.2 mg/mL) in the phosphate buffer (60 mmol/L, pH =6.24) at 25 ℃. The absorbance of the initialMicrococcuslysodeikticuscellsuspension was about 0.7. After that, the suspension was aspirated with a pipette and the absorbance was calculated in every 15 min at 450 nm. Magnetic cellulose nanoparticles were employed as blanks. The results of immobilized lysozyme activity calculated by the following equation were shown in Table 1.
(2)
whereUis enzyme activity (U·mg-1),ΔA1is variation of sample absorbance value at 450 nm,ΔA2is variation of absorbance value of blank control 450 nm,tis reaction time, andmis the quality of the enzyme in the reaction.

Table 1 Characteristics of immobilized lysozyme
1.2.4Characterizationofthesupportmaterials
Transmission electron microscopy (TEM) of the MCMs was carried out on a JEOL JEM-2010 (HT) electron microscope with an accelerating voltage of 200 kV. The magnetic properties of the prepared nanoparticles were measured on a vibrating sample magnetometer (VSM, Quantum Design Company, USA) with a maximum applied magnetic field of 2.4×10⁶A·m-1at the room temperature. The pure cellulose, Fe3O4, MCMs, native lysozyme, and immobilized lysozyme samples were pressed into disks and analyzed by a Rigaku D/max-2550 PC X-ray diffractometer (Japan) equipped with Cu Kαradiation source (λ= 0.154 nm) operating at 40 kV and 40 mA. The XRD patterns were obtained in the scanning range of 2θof 10°-90°. FTIR spectra of cellulose, MCMs, and immobilized lysozyme were recorded on a Nicolet 6700 FTIR spectrometer (Thermo-Fisher, USA). The powders were dispersed in KBr and then pressed into a tablet before measurements.
1.2.5Enzymatichydrolysisforexcesssludgeprocedure
Sterile three necked flasks with 250 mL were used to determine the kinetics of enzymatic hydrolysis of the sludge. The flasks were divided into two sequences. In the first sequence, sludge of 50 mL was poured into each flask, then the native lysozyme (9% lysozyme weight/TSS weight) was added. In another sequence, the immobilization-lysozyme was added into the flask, whose weight was consistent with that of the native lysozyme. During the reaction time, both the flasks were kept stirring at speed of 140 r/min on a water bath shaking bed at 35 ℃. At different time intervals within 10 h, sludge samples were extracted from the two sequences for the EPS analysis.
1.2.6Determinationofsludgedewaterability
Since the determination of specific resistance to filtration (SRF) has the similar physical process to the high pressure dewatering, it was used to evaluate the sludge dewaterability in this work. The SRF was conducted in a 250 mL Buchner funnel by a filter with 0.45 μm filter paper. The Buchner funnel was filled with 100 mL sludge suspension, and a constant pressure of 0.6 MPa was applied by an air pump. The volume of filtrate under pressure was continuously recorded every 10 s before surface cracking was detected.
The SRF of the sludge was calculated by
(3)
wherePis the pressure applied(kg/m2),Ais the filter area(m2),μis the filtrate viscosity (kg·s/m2),ωdenotes dry solid weight per unit volume sludge on the filtrate media(kg/m3), andbis the time-to-filtration ratio, which is the slope of the curve that is obtained by plotting the ratio of the time of filtration to the volume of filtrate (t/V) versus the filtrate volume (V).
1.2.7ExtractionofEPS
The extraction method for EPS was based on the Refs.[21-22]. The sludge was first centrifuged at 2 000 r/min for 20 min at 4 ℃; the supernatant was the S-EPS. The collected sludge pellets were re-suspended by adding 0.10 % NaCl solution to the original volume. Afterwards, the mixture was well shaken for 5 min and then centrifuged again at 5 000 r/min for 20 min at 4 ℃. The organic matter present in the collected supernatant was LB-EPS. Finally, the collected sediments in the tube were again suspended with 0.10% NaCl to the original volume and treated with ultrasonication (35 kHz for 5 min). Then, it was centrifuged again at 20 000 r/min for 20 min, and the supernatant was collected in TB-EPS, while the sediment was left in the pellet.
Polysaccharide anthrone sulfuric acid method with glucose was used as a standard[23]. The content of protein was measured by Lowry-Folin method with the bovine serum albumin (BSA) as standard[24]. COD (regarded as total EPS) was measured using HACH DR1010 spectrophotometer subsequent to 2 h digestion.
1.2.8Three-dimensionalEEMfluorescencespectroscopy
The 3-D EEM fluorescence spectra were measured on a QM/TM fluorescence spectroscope (Photon Technology International Co., USA). The scanning emission spectra range from 250 to 550 nm at 5 nm increments and the excitation wavelength ranges from 220 to 500 nm at 5 nm increments. The excitation and emission slits bandwidths were used at 10 nm. As well, the scanning rate was set at 4 800 nm/min.
1.2.9Reusabilityofimmobilizedlysozyme
In the reusability investigation, the enzyme catalysis reaction was carried out for 15 min. Immobilizedlysozyme was separated from the reaction medium by the magnetic field, and rinsed twice with phosphate buffer (pH=6.24; 0.2 mol/L). The treated immobilized lysozyme was used and the second time of enzyme catalysis reaction was carried out, immediately. In the same way, the above operations were repeated for 10 times. Their catalytic activities against the special substrate (Micrococcus lysodeikticu) in 15 min were calculated with the absorbance at 450 nm[25].
2 Results and Discussion
2.1 Characterization of Fe3O4@cellulose microspheres
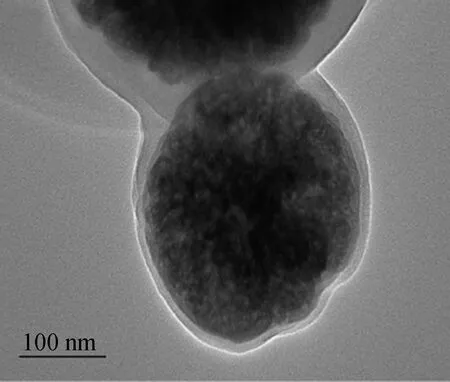
To verify the core-shell structure of MCMs, the TEM images of MCMs were performed. As shown in Figs. 3(a), (b) and (c). TEM images indicated that MCMs were fairly smooth and spherical in shape. The sol-gel reaction resulted in the formation of a firm sheath of cellulose around the Fe3O4microspheres. The thickness of the cellulose shell was determined to be around 10-15 nm from the TEM images (shown in Fig. 3(c)). The particle size distributions of MCMs were measured (shown in Fig. 3 (d)). It can be seen that the size range of MCMs is from 100- 650 nm, with a mean size between 400-500 nm. Furthermore, the span was defined as (D90-D10)/D50 so as to indicate the particle size distribution[26]. The span of the MCMs was 2.475; therefore, it can be regarded as a mean size of the MCMs with a narrow size distribution[27].

(a)
(b)

(c)

(d)
The XRD diffraction curves of bare Fe3O4, cellulose, MCMs and immobilized lysozyme are shown in Fig. 4(a). The characteristic peaks of MCMs at 2θ=30.18°, 35.42°, 42.81°, 53.23°, 57.14° and 62.7° could be well indexed to the (220), (311), (400), (422), (511), and (440) crystal faces according to JPCDS75-1609. The XRD curve of initial cellulose had typical crystalline peaks of cellulose I at 2θ=12°-17°(1-10), 17°(110), 22.31°(220). In addition, the MCMs exhibited diffraction peaks of cellulose at 2θ= 19.8° (110) and 21.72 (020), which were ascribed to the typical crystal of cellulose II. The (040) peak was relatively weak in cellulose II, which may be due to the impact of (311) peak in Fe3O4. The results indicated the transformation from cellulose I to cellulose II[28]. This phenomenon can be attributed to the crystallization behavior of cellulose from a solution. The magnetite crystalline phase was observed after the immobilization of lysozyme. To sum up, after coating with cellulose and immobilized lysozyme, the nanoparticles maintained the crystalline structure of Fe3O4, as confirmed by the characteristic peaks.

(a)

(b)
The magnetic hysteresis curves of the Fe3O4microspheres and MCMs were illustrated in Fig. 4(b). A magnified image of -1 600 A/m to 1 600 A/m ranges was shown in the inset of Fig. 4(b). The samples exhibited small remanence and coercivity, which indicated that MCMs had super-paramagnetic characteristics[29-30]. Fe3O4microspheres and MCMs exhibited typical super-paramagnetic behaviors and the saturation magnetization values of them were 81.82 and 34.87 A·m2/kg, respectively. The saturation magnetization value of MCMs was lower than that of pure Fe3O4microspheres due to the existence of cellulose layers on the surface of Fe3O4microspheres. Hence, the MCMs exhibited quite sensitive response of magnetic behavior and could easily be removed from the reactor by applying the external magnetic field.


Fig.5 FTIR spectra of immobilized lysozyme, pure cellulose and MCM
2.2 Effects of enzymatic pretreatment on dewatering of excess sludge
2.2.1VariationofSRF
SRF was measured to evaluate the dewaterability of excess sludge hydrolyzed by the native lysozyme and immobilized lysozyme. Figure 6 presented the result of excess sludge treated with lysozyme. It could be seen that the SRF of the sludge decreased rapidly from 5.47×10¹³m·kg to 2.01×10¹³m·kg and 5.37×10¹³m·kg to 2.49×10¹³m·kg, respectively, with addition of native lysozyme and immobilized lysozyme in the first 5 h; then the SRF decreased and stayed nearly constant from 5 h to 10 h. The reduction rates of SRF were 62.8% and 53.6%, after hydrolyzed by the native lysozyme and the immobilized lysozyme. Overall, the native lysozyme and the immobilized lysozyme showed good ability to enhance dewaterability of the sludge. This phenomenon could be attributed to the fact that sludge flocs, which were repositories for water are disrupted by enzymatic hydrolysis, and bound water was released from sludge flocs to supernatant, leading to the enhancement of dewaterability. It was noted that SRF with immobilized lysozyme treatment was little higher than that of the native lysozyme treatment, however, it could be attributed to the catalytic activity of immobilized enzyme which was lower than that of the free enzyme.

Fig. 6 Variation of SRF with applying lysozyme hydrolysis
2.2.2VariationofEPScomponents
Extracellular polymeric substances (EPS) are a complex organic matter with high molecular weight, secreted by bacteria and other microorganisms for self-preservation and mutual adhesion[35]. Previous studies showed that the enzymatic-hydrolysis was a devolatilization process, mainly used to dissolve the microbial cell, leading to augmenting the sludge floc as well as the dominant macromolecule of EPS, such as polysaccharide and protein are transformed into a simple small molecular substance[36-37]and therefore it will enhance the dewatering of the sludge. Henceforth,the variations in EPS distribution and composition were investigated.
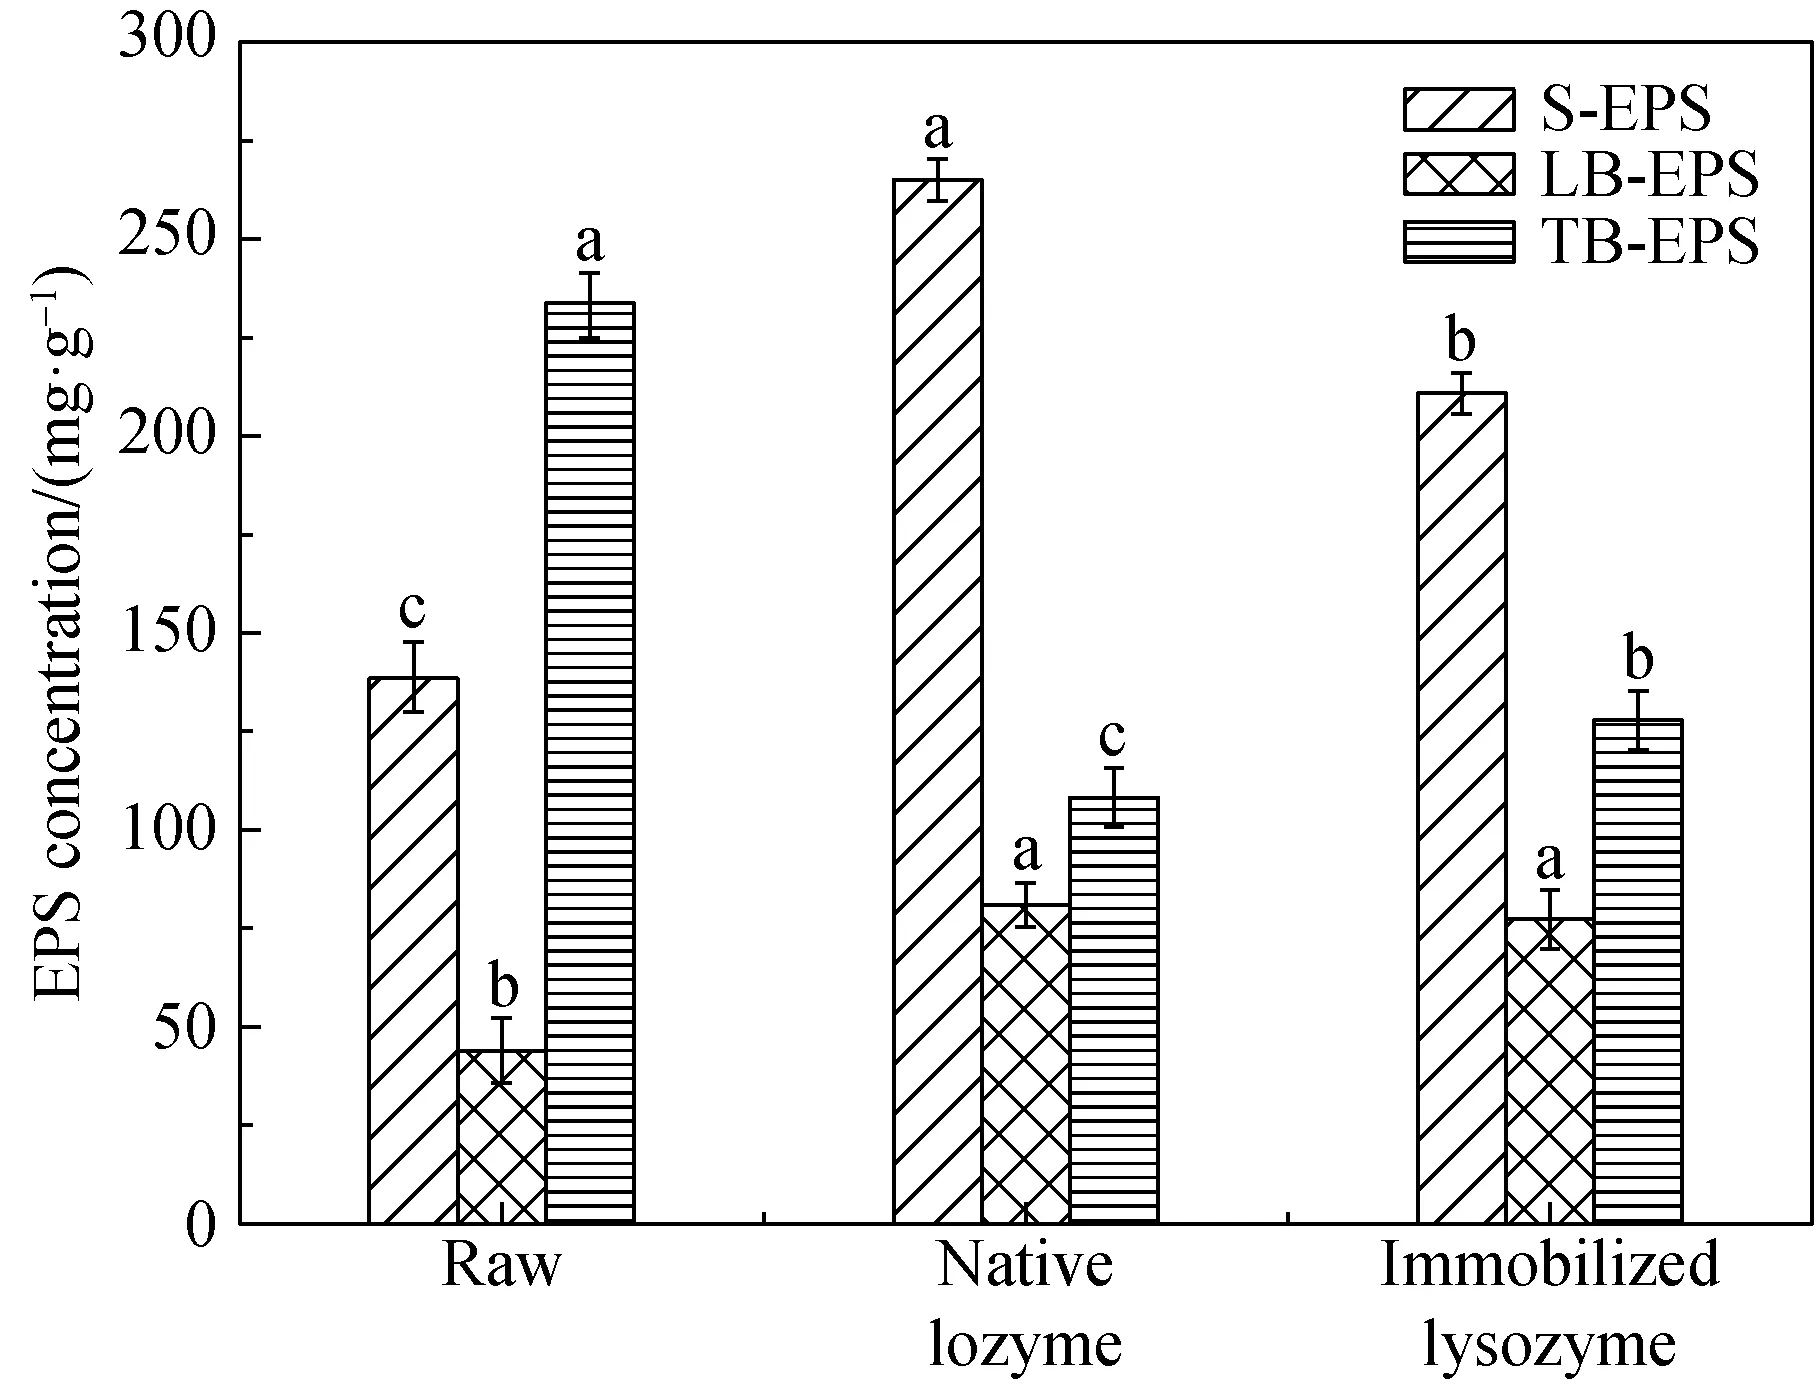
Thevariation of EPS, protein and polysaccharide, after employing native lysozyme and immobilized lysozyme treatments were illustrated in Fig. 7. As shown in Fig. 7(a), the concentration of extractable EPS (S-EPS and LB-EPS) was increased, after the sludge was treated with native lysozyme and immobilized lysozyme. With addition of native lysozyme and immobilized lysozyme, S-EPS concentration significantly increased from (138.61±8.87) mg/g to (265.09±5.42) mg/g and 210.49±6.71 respectively. At the same time, LB-EPS was increased from (44.33±7.95) mg/g to (81.90±5.26) mg/g and (77.27±6.90) mg/g, respectively. In contrast, TB-EPS concentration obvious decreased from (233.41±8.47) mg/g to (108.09±7.42) mg/g and (128.19±8.03) mg/g, during the native lysozyme and immobilized lysozyme enzymatic activity. According to the previous studies, a part of the sludge floc structures was formed by orderly biochemical polymerization reaction, but there were a large number of macromolecular matters formed by nonspecific interaction in the process[38]. Consequently, the lysozyme had ahigher efficiency and ability to hydrolyze the linkages among macromolecules in TB-EPS. This led to the macromolecules matter degradation followed by converting them into low molecular weight and released into the liquid phase.
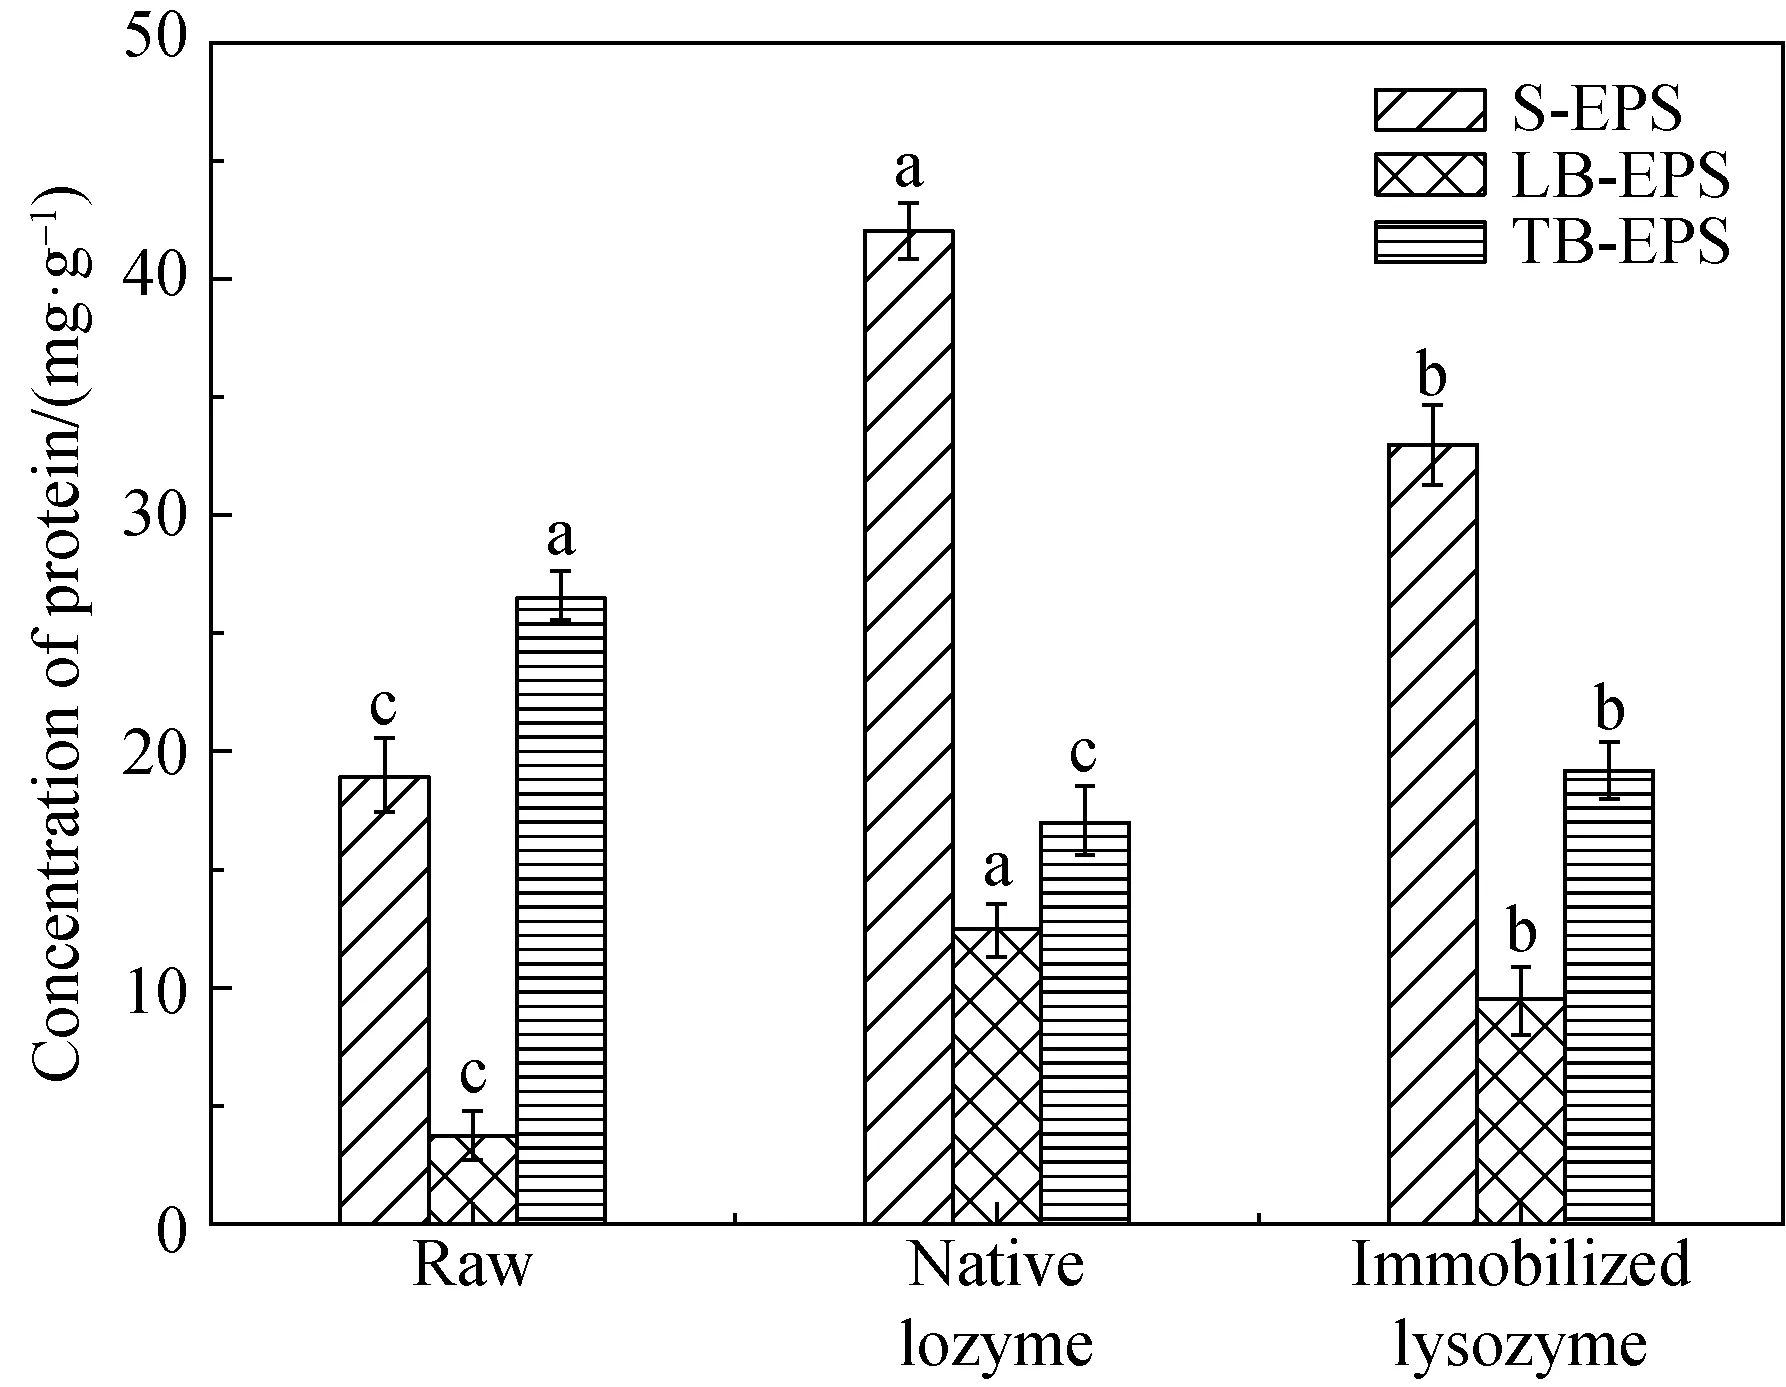
The EPS consisted of a capsule, a mucus layer and other surface materials. Proteins and carbohydrates were two of the most predominant organic matters in EPS. Previous studies demonstrated that the sludge bacteria autolyzed or hydrolyzed led to amounts of protein and polysaccharide releasing from the sludge, under the application of lysozyme treatment. Therefore, the variation of protein and polysaccharide concentration during sludge hydrolysis could provide more thorough understanding of the influence of enzymatic hydrolysis. Figures 7(b) and (c) depicted the influence of enzymatic hydrolysis on polysaccharide and protein. It could be seen that the results were in accordance with previous observations of EPS variation from Fig. 7(a). The concentrations of polysaccharide in S-EPS (shown in Fig. 7(b)) were increased from (21.15±0.53) mg/g to (62.36±1.09) mg/g and (50.35±1.56) mg/g, and the concentrations of polysaccharide in LB-EPS turned to be (19.77±1.27) mg/g and (14.06±1.10) mg/g. Unlike the variation of polysaccharide in S-EPS and LB-EPS, the concentrations of polysaccharide in TB-EPS were reduced from (37.27±0.90) mg/g to (15.97±1.10) mg/g and (25.03±1.25) mg/g. It is quite evident from Fig. 6(c) that the concentrations of protein in TB-EPS were reduced from (26.61±1.07) mg/g to (17.09±1.42) mg/g and (19.25±1.25) mg/g. The protein concentrations in S-EPS increased from (18.94±1.58) mg/g TSS to (42.01±1.21) mg/g and (33.35±1.69) mg/g, and the protein concentrations in LB-EPS increased from (3.81±1.07) mg/g to (12.50±0.97) mg/g and (9.57±1.49) mg/g.
(a) (b)
(c)
2.2.3CorrelationanalysisbetweenSRFandEPScomponents
The EPS components and concentrations play an important role in sludge dewatering process[39-40]. Thus, the correlation analysis was investigated to illustrate the SRF and different EPS components. The correlation of EPS components and the dewatering performance of sludge were shown in Fig. 8. As shown in Figs. 8(a) and (c), strong positive correlations were indicated between SRF and polysaccharide (R2=0.97,p<0.01), protein (R2=0.98,p<0.01) in TB-EPS under the application of native lysozyme hydrolysis. In addition, SRF correlated negatively with protein and polysaccharide from S-EPS and LB-EPS. With the application of immobilized lysozyme hydrolysis, the results of correlation analysis were illustrated in Figs. 8(b) and (c). The correlation between SRF with protein and polysaccharide in different EPS fractions was consistent with under native lysozyme treatment. The SRF was negatively correlated with protein in S-EPS and LB-EPS, which indicated that the enzymatic hydrolysis of protein and transamination of amino acids was beneficial to the removal of hydrophilic function groups and enhanced the dewaterability of excess sludge. This phenomenon may be related to the changes in protein chemical structure by applying enzymatic hydrolysis. In summary, these results revealed that concentration of EPS fractions was the major factor of sludge dewaterability, and it was beneficial to the enhancement of sludge dewatering performance by applying native lysozyme and immobilized lysozyme hydrolysis.

(a) (b)

(c) (d)
2.2.4Changeinsludgestructureandsettlingpropertyunderenzymatictreatment
The SEM was used to further explore themicromorphology of the sludge. The composition of the EPS matrix in sludge flocs was complex and heterogeneous and the spatial distribution of EPS played an important role in the structure of the flocs[41]. The sludge morphology images were presented in Fig. 9. As shown in Fig. 9(a), the sludge flocs of raw excess sludge were wrapped around a large number of zoogloea floc, such as a lump scrap bacteria and filamentous bacteria. Smooth surface and the sludge flocs seemed to arrange in a sequence that no clear boundaries between the floc particles could be seen. Concurrently, the structure of the sludge flocs was loose, due to the presence of filamentous bacteria. The native lysozyme and immobilized lysozyme subject to hydrolysis (shown in Figs. 9(b) and (c)), the EPS, lump scrap bacteria and filamentous bacteria in sludge flocs were broken down and the orientation of sludge flocs was dismantled. Meanwhile, it could be seen that there was almost no integral floc structure. The structure of the flocculation was closely bonded and the boundary between the sludge was very clear, which was favorable for the settlement of the sludge. This finding was well agreed with the results of sludge settling performance (Fig. 9(d)).


(a)

(b)

(c)

(d)
Fig. 9 SEM images of sludge morphology: (a) raw sludge; (b) sludge after native lysozyme treatment; (c) sludge after lysozyme immobilization treatment: (d) variation of sludge setting performance
2.3 Three-dimensional EEM fluorescence spectroscopy of sludge EPS
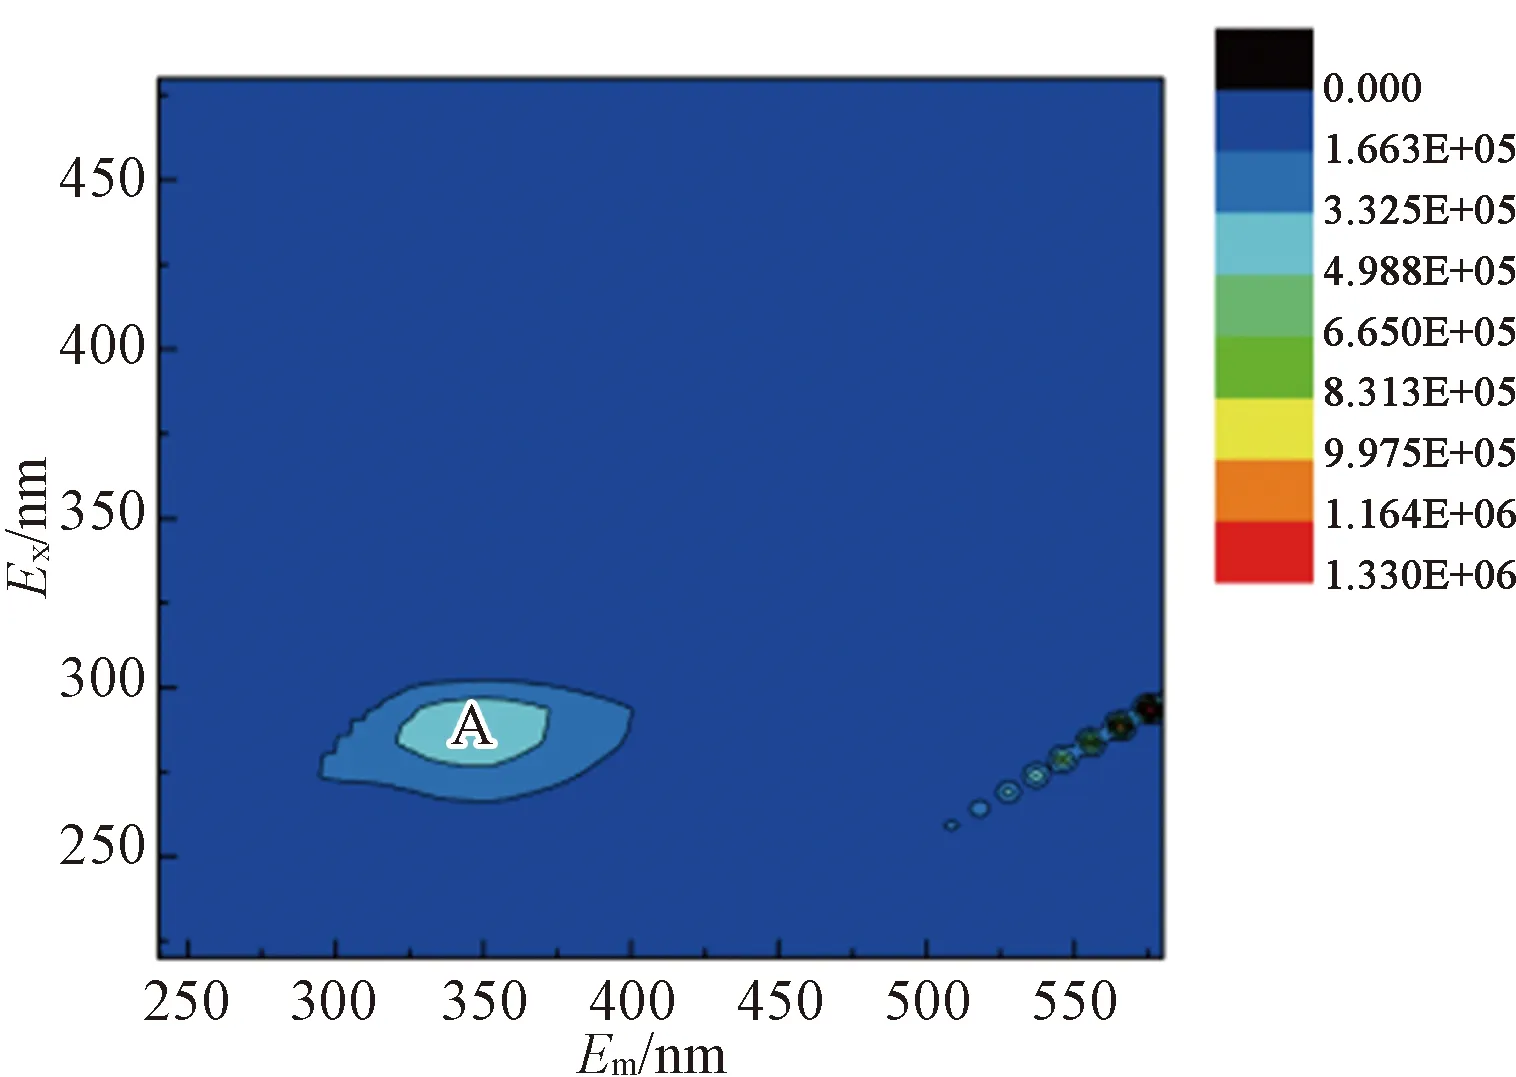
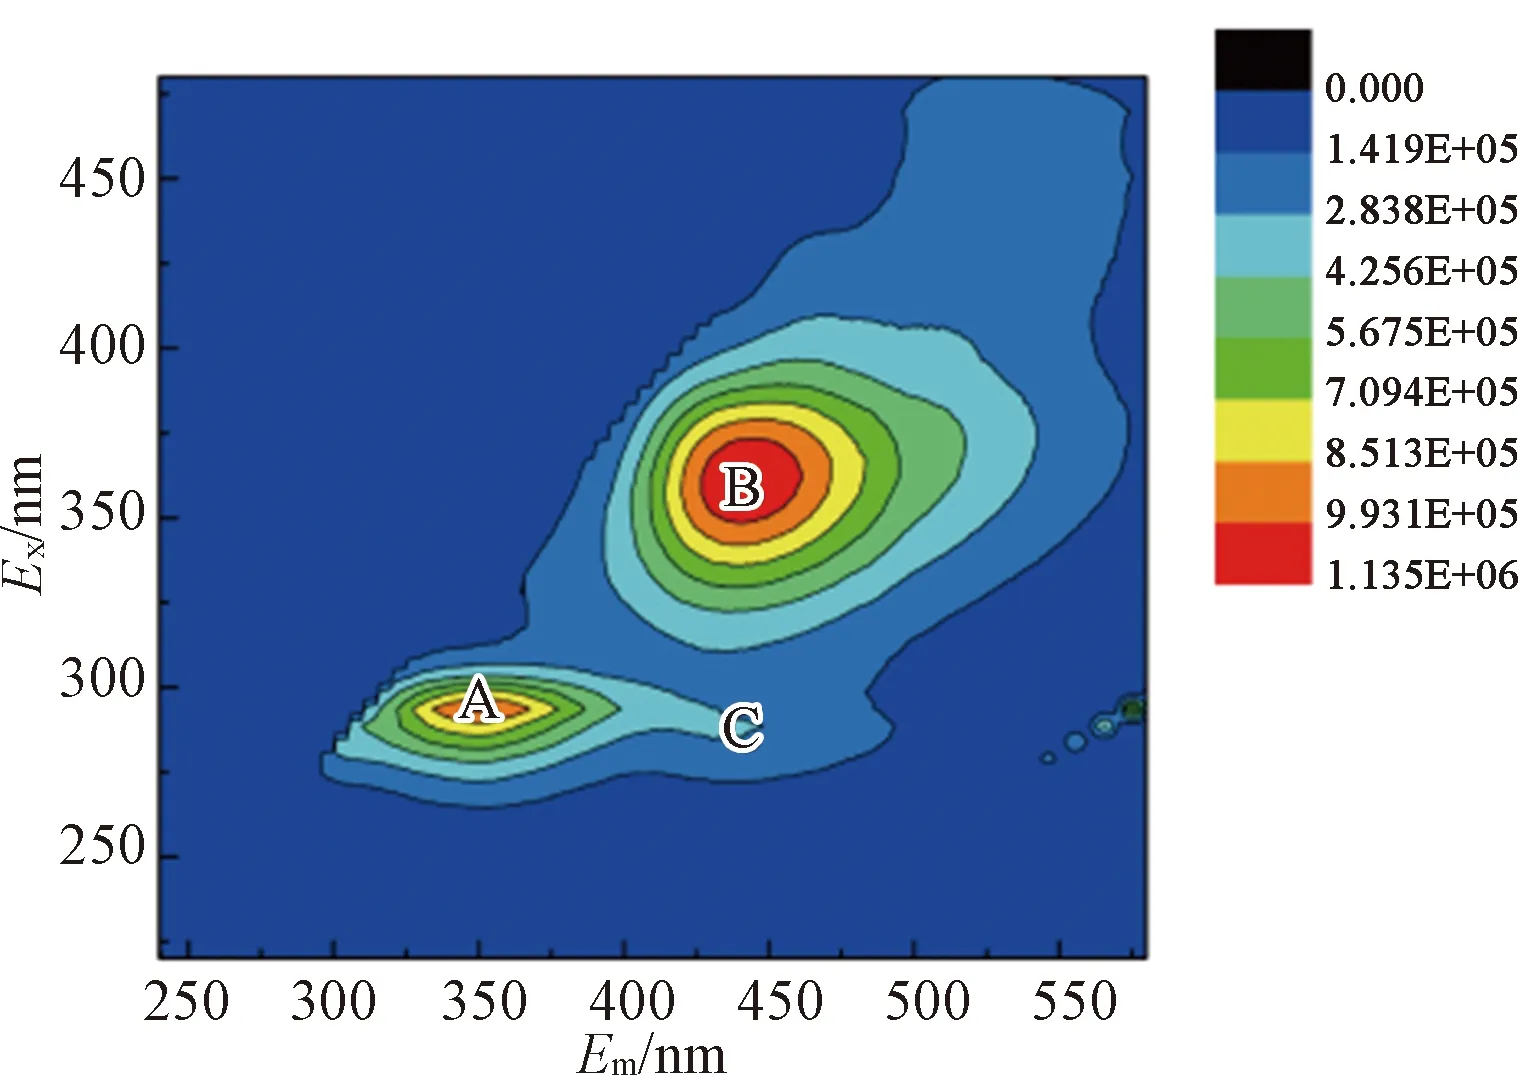
The 3D-EEM fluorescence spectra of different EPS fractions after enzymatic hydrolysis were shown in Fig. 10. Each 3D-EEM fluorescence spectra region illustrated special information about aromatic protein (Exranges from 220 to 230 and 280 to 290;Emranges from 358.5 to 364 and 360 to 368), humic acid-like (Exranges from 350 to 360 and 280 to 320;Emranges from 445.5 to 452.5 and 402 to 454) and fulvic acid-like (Exranges from 235 to 240;Emranges from 417.5 to 456) substances in the sludge EPS according to the method from Ref.[44].
Results showed that aromatic protein-like (regions A and C) andhumic acid (region B) substance were two major substances in different EPS fractions of raw sludge, except for LB-EPS [shown in Fig. 10(b)]. For the S-EPS and LB-EPS under the enzymatic hydrolysis, the fluorescence intensity of region A and region B was increased significantly [shown in Figs. 10 (d) and (e)]. Meanwhile, the fluorescence intensity of Region C showed a weak increasing trend. For TB-EPS from enzymatic hydrolysis sludge, the intensity of aromatic protein-like (regions A and C) and humic acid (region B) were essentially weakened [shown in Fig. 10(f)]. It was verified the release of the aromatic protein-like matters and humic acid into LB-EPS and S-EPS from the inner layer of sludge flocs. The result could also be inferred from the EPS fractions distribution of sludge (shown in Fig. 7). Additionally, the fluorescence Region B of TB-EPS displayed blue shifts compared to that in raw sludge, under the enzymatic hydrolysis. It was indicated that the functional groups of aromatic ring and conjugated bond in chain structure were removed, under the enzymatic hydrolysis[45]. To sum up, the immobilized enzymatic hydrolysis provided a new insight toward the enhanced dewaterability process of sludge.

(a)
(b)
(c)

(d)

(e)

(f)
Fig.10 EEM spectra of different EPS fractions: (a) S-EPS of raw sludge; (b) LB-EPS of raw sludge; (c) TB-EPS of raw sludge; (d) S-EPS after immobilized lysozyme hydrolysis; (e) LB-EPS after immobilized lysozyme hydrolysis; (f) TB-EPS after immobilized lysozyme hydrolysis
2.4 Reusability of immobilized lysozyme
The reusability of immobilized enzyme decided its application value. The reusability of immobilized lysozyme was investigated by analyzing its residual activity after each reusing cycle (shown in Fig. 11). The activity of recycled immobilized lysozyme decreased slowly compared to the initial enzyme activity in the first four cycles and the residual activity of immobilized lysozyme after four cycles was up to 75%. However, after six cycles, immobilized lysozyme kept (51.9±2.2)% of its initial activity, demonstrating the good reusability of lysozyme immobilized on magnetic cellulose microsphere.

Fig.11 Reusability of the immobilized lysozyme
3 Conclusions
This study showed that lysozyme was immobilized onto the cellulose coated magnetic nanoparticles by the covalent attachment method and formed a novel sludge hydrolysis system. Sludge dewaterability was enhanced by applying native lysozyme and immobilized lysozyme hydrolysis, with reduction in SRF by 62.8% and 53.6%, respectively. The enzymatic hydrolysis caused an increase S-EPS and LB-EPS in excess, meanwhile the TB-EPS concentration decreased after enzymatic reaction. Correlation analysis illustrated that the SRF correlated negatively with protein, polysaccharide from S-EPS and LB-EPS and correlated positively with protein, polysaccharide from TB-EPS. The SEM combined settlement ability analysis disclosed that the sludge floc structures were destroyed under native and immobilized lysozyme treatment and improved the settle ability of excess sludge. The residual activity of immobilized lysozyme after six cycles was still (51.9±2.2)%, indicating its high industrial application value. As a consequence, it is feasible to dispose the excess sludge by the immobilized enzyme hydrolysis technique.
 Journal of Donghua University(English Edition)2019年4期
- Journal of Donghua University(English Edition)的其它文章
- Parameter Estimation for Complex Ornstein-Uhlenbeck Processes
- Elastic Predictions of 3D Orthogonal Woven Composites Using Micro/meso-scale Repeated Unit Cell Models
- Sound Character Calculation and Analysis of Sound Barrier Based on Acoustoelectric Analogy
- Tool Health Condition Recognition Method for High Speed Milling of Titanium Alloy Based on Principal Component Analysis (PCA) and Long Short Term Memory (LSTM)
- Upper Bound Solution of Soil Slope Stability under Coupling Effect of Rainfall and Earthquake
- Mesoporous ZSM-5 Crystals Synthesized by a Novel Amphiphilic Organosilane Soft Template