
Inter-individual variation in trophic history of Dosidicus gigas, as indicated by stable isotopes in eye lenses
2019-12-05 01:49WeiXuXinjunChenBilinLiuYongChenMengyoHunLiuJingyunLin
Aquaculture and Fisheries 2019年6期
Wei Xu, Xinjun Chen,b,c,e, Bilin Liu,b,c,e,*, Yong Chen,d, Mengyo Hun, N Liu,Jingyun Lin
a College of Marine Sciences, Shanghai Ocean University, Shanghai, 201306, China
b National Engineering Research Center for Oceanic Fisheries, Shanghai, 201306, China
c The Key Laboratory of Sustainable Exploitation of Oceanic Fisheries Resources, Ministry of Education, Shanghai, 201306, China
d Key Laboratory of Oceanic Fisheries Exploration, Ministry of Agriculture, Shanghai, 201306, China
e Scientific Observing and Experimental Station of Oceanic Fishery Resources, Ministry of Agriculture, Shanghai, 201306, China
Keywords:Dosidicus gigas Stable isotope Eye lenses Trophic habitat
A B S T R A C T Isotopic signatures have been extensively used to reconstruct marine organism trophic habitat over their lifetime. In this study, sequential stable isotopic values of δ13C and δ15N in eye lenses were measured to investigate the trophic history of Dosidicus gigas during ontogeny. A total of 281 segments from 33 lenses were examined with δ13C ranging from -20.17‰ to -16.11‰ and δ15N ranging from 5.15‰ to 18.74‰. Sequential increasing but variable δ13C and δ15N values in eye lenses indicated that the prey used in the model had a wide range of values, it became able to consume prey from higher trophic levels, perhaps to maximize feeding success.High inter-individual differences in the range and considerable inter-individual variation in the trend of the isotopic values of the sequential segments from the nuclear to the periphery were considered to be the result of the effects of food and the best feeding strategy. These inter-individual isotopic differences in the life history of D. gigas confirmed the high degree of plasticity of feeding for this squid and its high potential to adapt to environmental change. Inter-individual differences of δ15N values in the growth of D. gigas were more likely to be caused by differences in the baseline values of isotopes. According to the population discrimination model of δ15N value changes during ontogeny, the D. gigas offPeru fit the model of “generalist population-generalist individuals”.
1. Introduction
The jumbo squidDosidicus gigasis the most abundant nerito-oceanic squid and inhabits the sea surface to depths of at least 1200 m(Nigmatullin, Nesis, & Arkhipkin, 2001). It is endemic in the Eastern Pacific Ocean, generally from 30°N to 40°S, with its western boundary extending as far west as 125° to 140°W (Jereb & Roper, 2010). Over the last two decades, the distribution ofD. gigashas dramatically expanded poleward (Field, Baltz, Phillips, & Walker, 2007; Zeidberg & Robison,2007), probably as a response to changing environmental variables and ecosystem interactions (Gilly et al., 2006; Rosa et al., 2013). The high concentration ofD. gigasin the north Humboldt Currents supports the most important local fishery in coastal waters and large-scale commercial fishery in the international waters of Peru (Argüelles,Rodhouse, Villegas, & Castillo, 2001; Liu et al., 2013).
D. gigasplays an important role in pelagic ecosystems, as they are not only preyed upon by many fish, marine mammals and birds(Nigmatullin et al.2001; Galván-Magãna et al., 2013), but also feed on mesopelagic fish, cephalopods and crustaceans (Alegre et al., 2014;Markaida, 2006; Markaida, Gilly, Salinas-Zavala, Rosas-Luis, & Booth,2008; Markaida & Sosa-Nishizaki, 2003; Nigmatullin et al., 2001;Rosas-Luis et al., 2011). These interactions with a large number of predators and prey, makesD. gigasa key species in the transfer of energy and biomass from the basic to higher trophic levels (Rosas-Luis,Salinas-Zavala, Koch, Del Monte Luna, & Morales-Zárate, 2008).Therefore, changes inD. gigasabundance would likely have a dramatic influence on the function of the ecosystem. In the Humboldt Current System of Peru, the distribution and movements of lightfish (Vinciguerria lucetia), an ecologically and economically important species, are closely related to the migratory pattern ofD. gigas(Rosas-Luis et al.,2011).
Stable isotopes (typically of δ13C and δ15N) have been widely used to investigate marine top predators, in terms of habitat (Dale,Wallsgrove, Popp, & Holland, 2011; Lorrain et al., 2015; Ruiz-Cooley,Ballance, & McCarthy, 2013), movement (Kurle & Worthy, 2002;Ménard, Lorrain, Potier, & Marsac, 2007; Ruiz-Cooley et al., 2013) and trophic ecology (Kurle & Worthy, 2002; Lee, Schell, McDonald, &Richardson, 2005; Ménard et al., 2007). Variations in δ13C and δ15N values in producers reflect the natural biogeochemical cycle processes and nutrient limitations in a particular water mass, and are strongly dependent on spatial and temporal differences in biological and physical fractionation events within a given ecosystem (McMahon,Hamady, & Thorrold, 2013; Pethybridge, Young, Kuhnert, & Farley,2015). δ13C measurements mainly serve as an indicator of the primary sources of organic carbon in the diets of predators (Cherel & Hobson,2007; Paterson & Whitfield, 1997) and the trophic enrichment of it between prey and predator is limited (Post, 2007). In contrast, δ15N is used to determine trophic position (Fry, 2007, p. 320; Hobson & Welch,1992) and trophic level increases much higher from prey to predator(Post, 2007).
The use of stable isotope analysis (SIA) has been increasingly improving our understanding of cephalopod life history. Muscles are the conventional tissues commonly used in isotope analysis of the cephalopod (Hunsicker, Essington, Aydin, & Ishida, 2010; Kurle, Sinclair,Edwards, & Gudmundson, 2011; Ruiz-Cooley, Gendron, Aguíñiga,Mesnick, & Carriquiry, 2004), reflecting recent diet information due to their fast cell metabolism and protein synthesis (Cherel, Fontaine,Jackson, Jackson, & Richard, 2009; Ruiz-Cooley et al., 2013; Stowasser,Pierce, Moffat, Collins, & Forsythe, 2006). Recently, hard structures including gladius (Lorrain et al., 2011), cuttlebone (Ohkouchi, Tsuda,Chikaraishi, & Tanabe, 2013) and eye lens (Hunsicker et al., 2010) as well as beaks (Fang, Thompson, Jin, Chen, & Chen, 2016) have emerged as useful tissues for SIA due to their inactive metabolism, allowing for the investigation of dietary data over the whole lifecycle of the cephalopod (Xavier et al., 2015).
The eye lens has been used in SIA as an archival tissue for cephalopods (Hunsicker et al., 2010; Meath, 2017; Onthank, 2013; Parry,2003) and fish (Curtis, 2016; Kurth, 2016; Quaeck-Davies, 2017;Wallace, Hollander, & Peebles, 2014). As a sequentially-formed, metabolically-inert organic tissue, the lens provides a chronological history of the biochemical, and isotopic composition of each layer, and varies with the trophic and spatial ecology of the individual at the time of tissue formation (Tzadik et al., 2017). In this study, we measured sequential δ13C and δ15N in the eye lenses of jumbo squid offPeru. Our aim was to investigate the variation in individual stable isotopes and consequently track the potential habitat and analyze the flexible foraging strategy of the squid. We hope the yield results will lead to an increase in our understanding of the life history of this squid in the study area.
2. Material and methods
2.1. Sample collection
A total of 33Dosidicus gigaswere sampled outside the exclusive economic zone waters of Peru during 2013 by Chinese jigging vessels(Fig. 1, Table 1). All samples were immediately frozen on the vessels and dissected in the laboratory after being defrosted. A total of 33 paired statoliths were extracted from the head and then preserved in 75% ethanol for further age analyses. A scalpel was used to create a flap in the cornea to allow the eye lens to be removed using forceps. Exterior tissue and vitreous material were manually removed by rinsing with deionized water, and were then preserved in 75% ethanol for the further analysis. Squid dorsal mantle length (ML) was measured to the nearest 1 mm, and body weight (BW) to 1 g. Sex was identified and maturity stages were assigned.
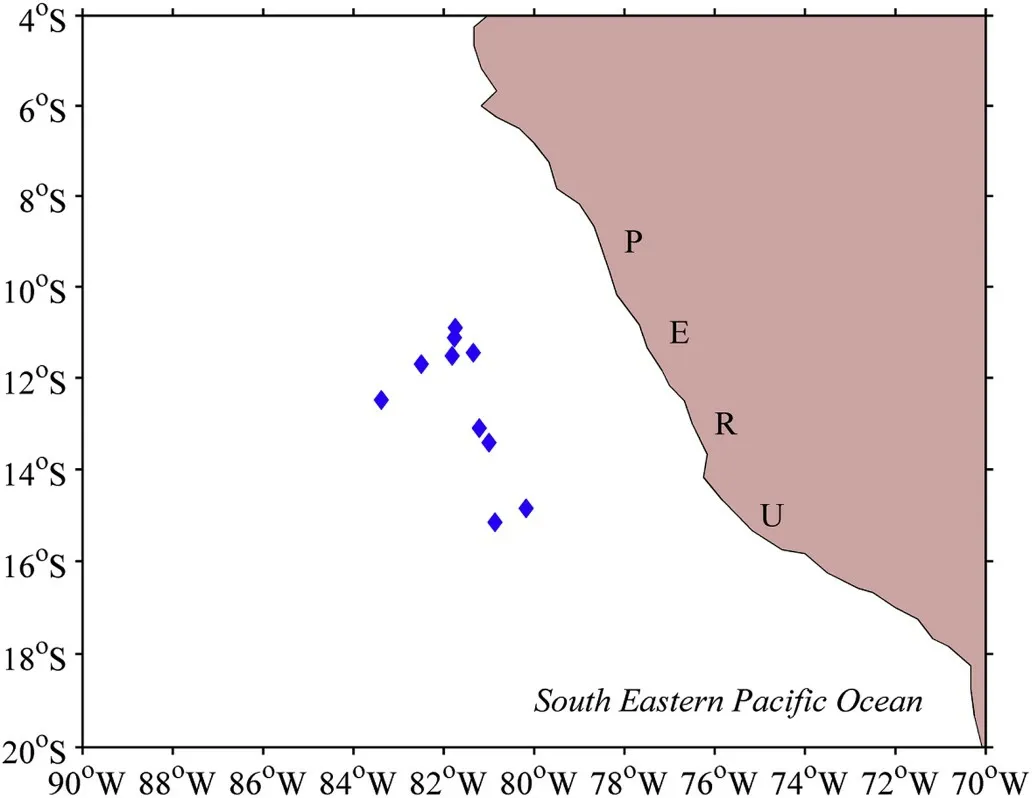
Fig. 1. Sampling locations of Dosidicus gigas from Peru oceanic waters.
2.2. Statolith processing and ageing
The standard processing and ageing methodology of statoliths was used in this study (Dawe & Natsukari, 1991). Two independent readings were done on each statolith, and the mean counts were accepted when a less than 10% variation was observed (Yatsu, Midorikawa, Shimada, &Uozumi, 1997). Based on the standard processing and aging method, 27 statoliths were successfully aged. The number of growth increments represent the age in years, assuming that growth increments are formed daily (Argüelles et al., 2001; Liu et al., 2013). Subsequently, the age of embryonic, paralarval, juvenile and adult squid was determined by counting the growth increments within the postnuclear and dark zone of the statolith, respectively (Liu, Chen, Chen, Lu, & Qian, 2011, 2016).The hatching date of each specimen was obtained by back-calculating from the capture date.
2.3. Lens delamination
Randomly selected eye lenses were cleaned with deionized water to remove any residual tissue. The distal lens was removed and discarded leaving the larger proximal lens, which diameter was measured using an ocular micrometer on a dissecting stereomicroscope. The proximal lens was then placed on a glass Petri dish where successive segments of tissue layer were peeled from the outermost edge of the lens using two fine-tipped forceps. Before each peeling, the diameter of the last peeling was re-measured. To ensure there was an enough tissue for isotope analyses, each segment was peeled to about 0.5 mm width. The number of segments extracted from an individual eye lens ranged from 6 to 11 due to the size difference of squid eyes. Excised segments were placed into a pointed centrifuge tube and labeled for further analysis.
2.4. Stable isotope analysis
Excised segments were first washed with MilliQ water at least three times to remove possible contaminants and subsequently dried in an oven at 60 °C for 48 h prior to analysis. After drying, they were homogenized to a fine powder with an agate mortar and pestle.Approximately 1-2 mg of samples were weighed into tin capsules and analyzed using an ISOPRIME 100 isotope ratio mass spectrometer(Isoprime Corporation, Cheadle, UK) and a vario ISOTOPE cube elemental analyzer (Elementar Analysensysteme GmbH, Hanau,Germany). Isotopic composition (δ) is most often presented as parts per thousand (‰) of an elemental sample compared to a standard presented as follows:
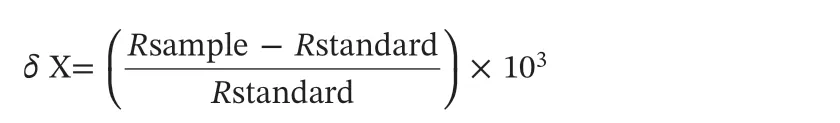
where X represents13C or15N, and R is the corresponding atomic ratio between the heavier and lighter isotope (i.e.13C/12Cor15N/14N) in the sample or standard. Positive δ values indicate that the sample has more heavy isotopes than the standard, while negative δ values indicate that the sample has less heavy isotopes than the standard (Peterson & Fry,1987). The standard for δ13C is Vienna Pee Dee Belemnite (V-PDB) and for δ15N is atmospheric nitrogen. The analytical precision is less than 0.1‰ for both carbon and nitrogen.
2.5. Data analysis
To back-calculate lens size of the individual at each ontogenetic stage, the relationship between age and lens diameter (LD) was tested.Linear regressions were used to model δ13C and δ15N on lens diameter.A Post Hoc test was included to show how the isotopes differ between stages. The corrected standard ellipse area (SEAc) was less sensitive to sample size and is proposed as a much more robust method to determine isotopic niche (Jackson, Inger, Parnell, & Bearhop, 2011). We used SEAc to estimate the isotopic niche width among individuals(Carlisle et al., 2015; Jackson et al., 2011). The SEAc was fitted using R 3.1.0 for windows (R Development Core Team 2014).
3. Results
3.1. The relationships between lens diameter and age
The relationship between lens diameter and age is linear forDosidicus gigas(Fig. 2). The corresponding growth models are represented as follows:
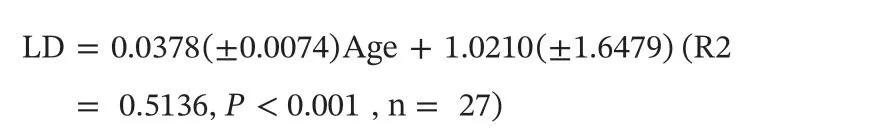
This equation was used to back-calculate the estimated lens diameter corresponding to each ontogenetic stage, based on the age determined from the statolith.
3.2. Age and lens diameter of the squid at each stage
A total of 27 out of 33 statoliths were successfully processed and read (Table 1). The age of each specimen analyzed was determined by counting the growth increments of the different growth zones on the statolith that corresponded to the four ontogenetic stages, with an age of 0 days for embryos, 23-38 days for paralarvae, 70-109 days for juveniles and 157-288 days for adults (Table 1). Lens diameters of each specimen at the embryonic, paralarval and juvenile stage were calculated based on the formula presented above (Table 1).
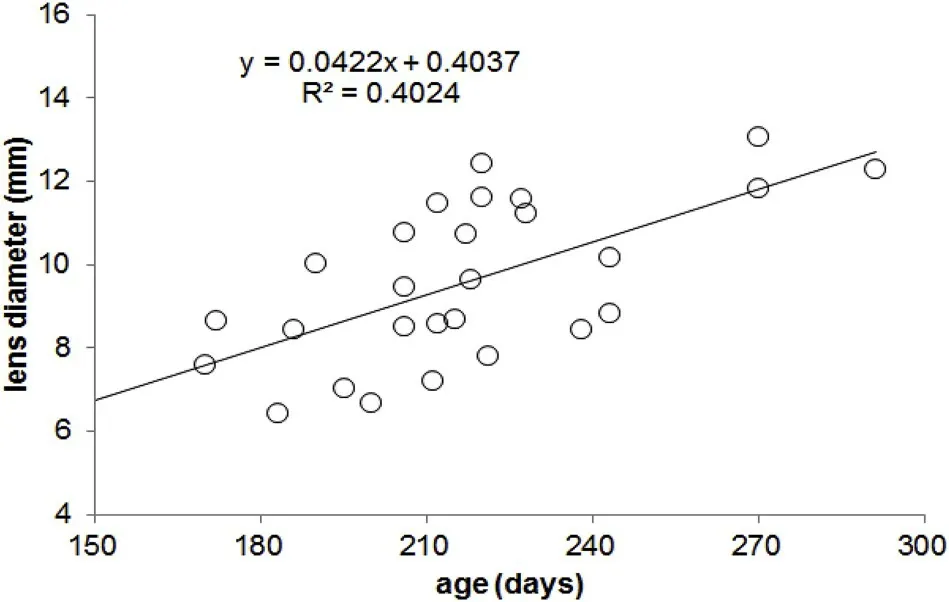
Fig. 2. The relationship between age and lens diamters for D. gigas.
3.3. Stable isotope values
The number of individual segments extracted per squid eye lens varied between 6 and 11 and the average width of these segments was 0.60 ± 0.24 mm. A total of 281 segments from 33 lenses were subsampled with δ13C ranging from -20.17‰ to -16.11‰ and δ15N ranging from 5.15‰ to 18.74‰. The δ13C in the lens segment formation at the embryonic, paralarval, juvenile and adult stage were-20.05‰~-16.62‰, -20.17‰~-17.10‰, -19.16‰~-17.36‰and -19.06‰~-16.78‰, respectively (Table 1). The δ15N in the lens segment formation at the embryonic, paralarval, juvenile and adult stage were 5.39‰-16.57‰, 5.15‰-16.71‰, 6.34‰-17.01‰ and 8.02‰-18.31‰, respectively (Table 1). A Post Hoc test showed δ13C in adult stage significant from the other three stages (Table 1, Tukey HSD:P<0.05) but no significant δ15N between stages (Table 1, Tukey HSD:P>0.05).
3.4. Inter-individual variation of isotope values
For each individual the ontogenetic variation of δ13C isotope was between 0.55‰ and 3.12‰ and for δ15N was between 0.75‰ and 9.75‰ (Table 2). Of the 33 specimens, 22 squids showed a significant increase in δ13C, while none showed a decrease in δ13C (Table 3, Sup.1). It was also found that 17 squids had a significant increase in δ15N,while only 2 squids had a significant decrease in δ15N (Table 3, Sup. 2).The isotopic values for eye lenses varied greatly among individuals over time (Fig. 3). The isotope niches of each individual varied considerably with SEAc ranging from 0.232‰ to 8.122‰ (Table 2, Fig. 4). A scatter plot showed that the δ13C and δ15N values varied greatly (3.83‰ for δ13C and 11.18‰ for δ15N in embryonic, 3.07‰ for δ13C and 11.56‰for δ15N in paralarval, 1.80‰ for δ13C and 10.67‰ for δ15N in juvenile,and 2.28‰ for δ13C and 10.29‰ for δ15N in adult stage) at each ontogenetic stage in the study area (Fig. 5).
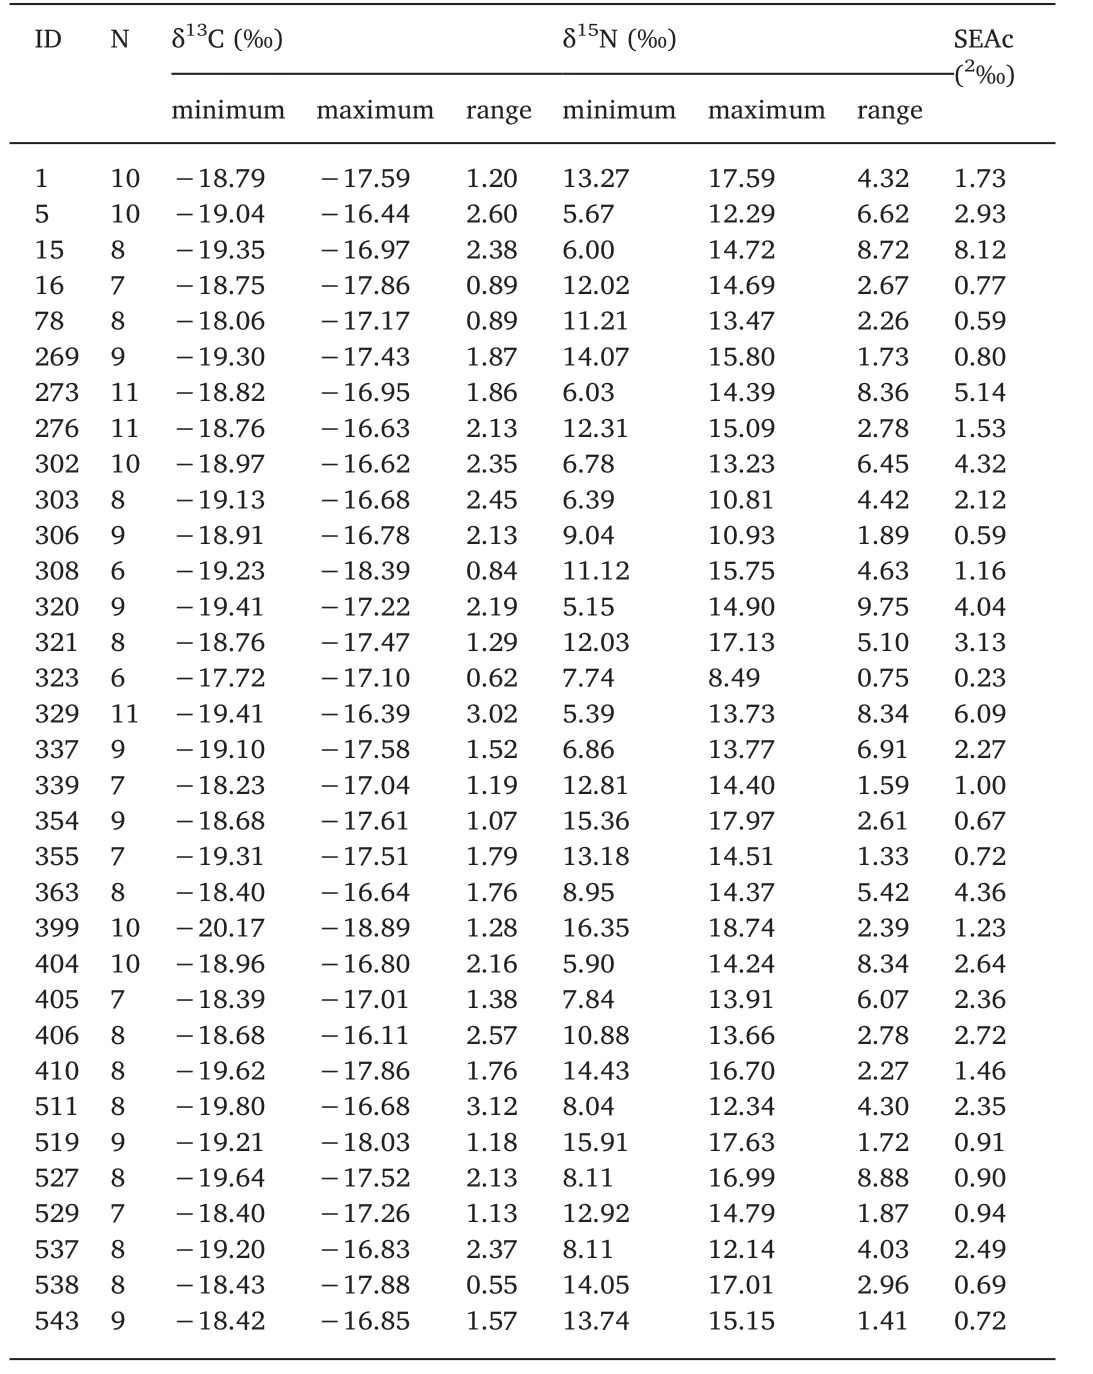
Table 2 The δ13C and δ15N values across eye lens and SEAc of each sample.
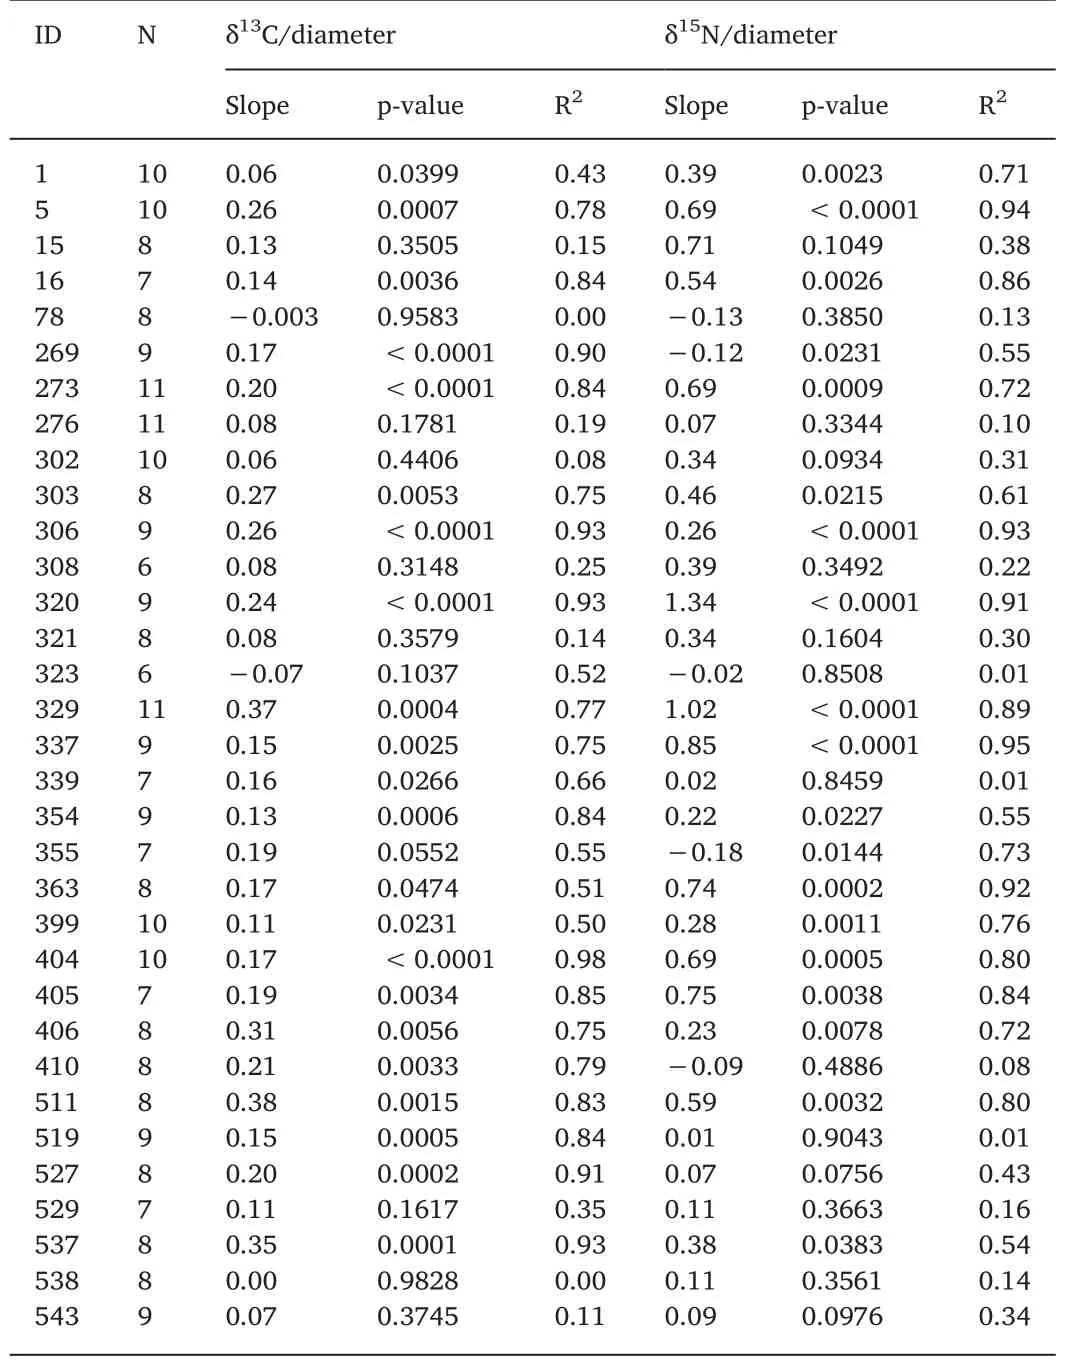
Table 3 Summary of Linear regressions of δ13C versus lens diameter, δ15N versus lens diameter and δ13C versus δ15N.
4. Discussion
In this study, the range of isotopes from eye lens nuclear to periphery varied greatly among individuals with13C from 0.55‰ to 3.12‰ and δ15N from 0.75‰ to 9.75‰. The range approximately corresponded to one to three trophic levels according to isotope enrichment between prey and consumer (Post, 2007). These high interindividual differences in ontogenetic variation of isotopes indicate thatD. gigasoffPeru has a characteristic of highly plastic feeding behavior over life, which were confirmed by Lorrain et al. (2011), Ruiz-Cooley et al. (2013) and Li, Gong, Zhang, and Chen (2017) who analyzed the sequential isotopic signature along the gladius of individuals offthe Gulf of California and Peru in the Eastern Pacific Ocean. High interindividual variation of isotopic values over time (Fig. 3) and a considerable difference trend in isotope variation with lens growth (Sup. 1,Sup 2), indicate that jumbo squid living in the same environment at a given sampling time can have different historical feeding backgrounds.This finding has been documented in similar research of eye lenses of the same species in other waters (Onthank, 2013) and other squid such asBerryteuthis magister(Hunsicker et al., 2010) as well asDoryteuthis pleai(Meath, 2017), and was also found in other squid by examining the chronological isotopic signature in archival tissues such as beaks(Cherel et al., 2009; Guerra et al., 2010) and gladius (Kato et al., 2016;Merten et al., 2017; Rosas-Luis, Navarro, Martínez-Baena, & Sánchez,2017).
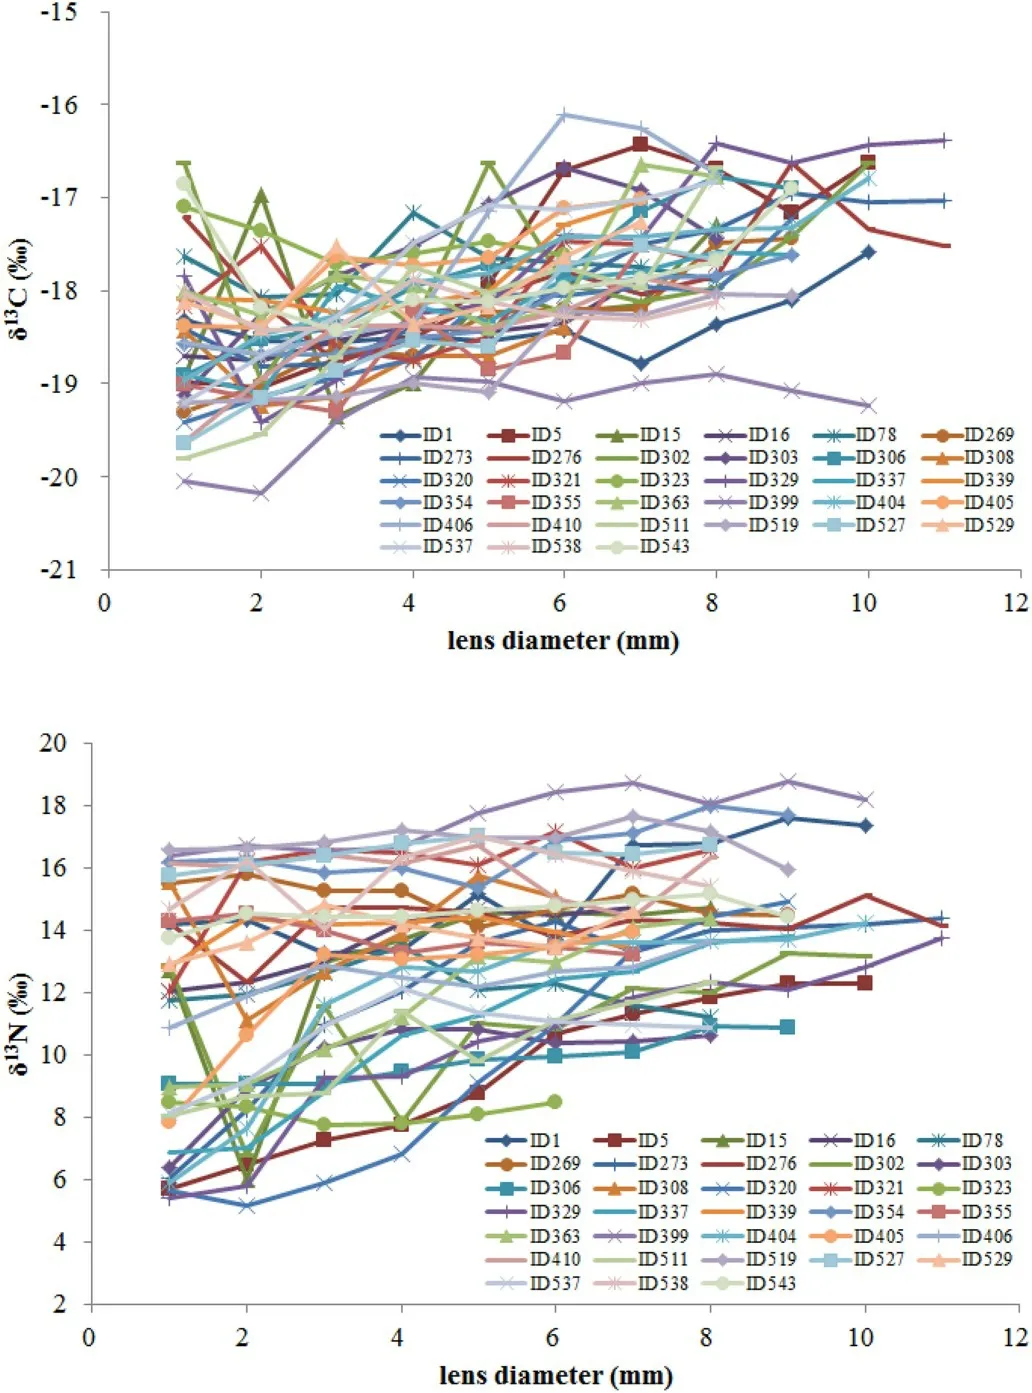
Fig. 3. The δ13C and δ15N values along eye lenses of D. gigas from Peru oceanic waters.
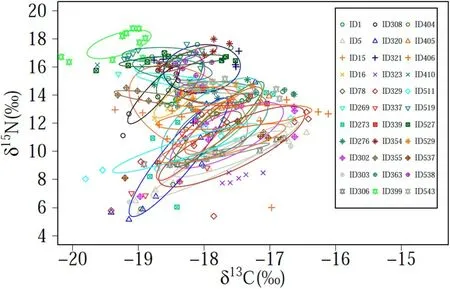
Fig. 4. Individual isotope niches of D. gigas from Peru oceanic waters.
There is growing evidence that within populations of various species, individuals vary considerably in habitat use, dietary preferences and foraging behaviors (Bearhop, Adams, Waldron, Fuller, & Macleod,2004; Bolnick et al., 2003), because they can potentially have wide dietary niches and have a large impact on the trophic dynamics within ecosystems (Kim, Tinker, Estes, & Koch, 2012; Lorrain et al., 2011).Individual differences within predator populations can be attributed to changes in prey preference and foraging location with ontogeny (Kim et al., 2012). In this study, those squid with similar isotopic values could be the result of consumption of the same prey in the same location, but could also be from fortuitous combinations of different prey types in different locations. On the contrary, those squid with different isotopes could have different prey types and/or foraging locations.Generally, squid may adapt their foraging strategies to prey availability that changes spatially and temporally. A large inter-individual difference in δ15N values across the eye lenses ofD. gigaswas found in this study, which was explained as an effect of prey availability and optimal foraging strategy in the same species in the Eastern North Pacific Ocean(Ruiz-Cooley, Villa, & Gould, 2010) and other squid such asBerryteuthis magister(Hunsicker et al., 2010) andSthenoteuthis pteropus(Merten et al., 2017).
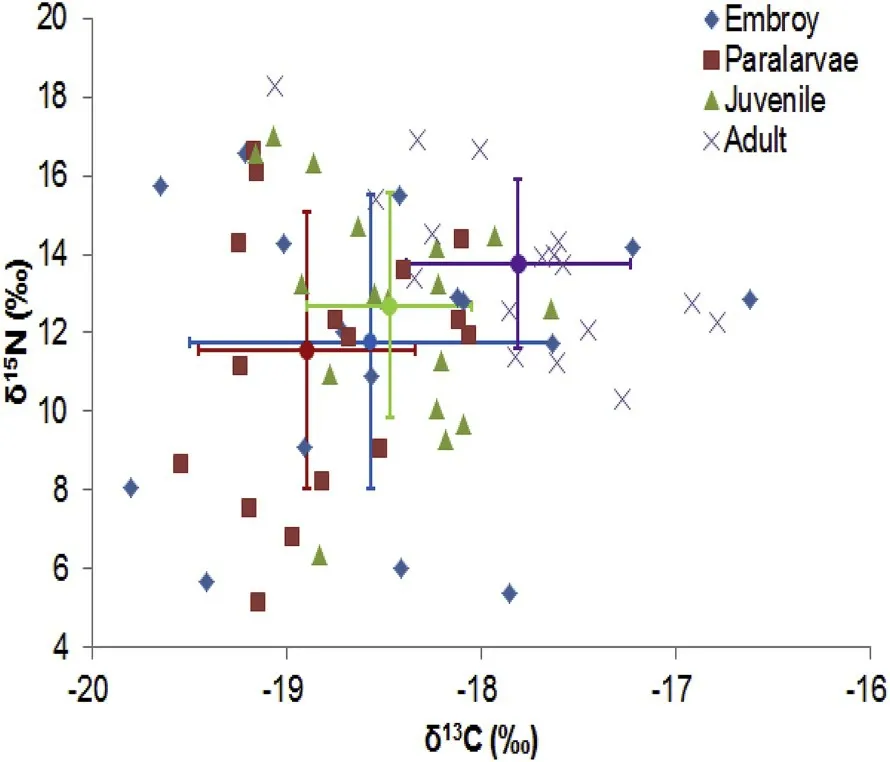
Fig. 5. Scatter plots of δ13C and δ15N values in eye lenses of D. gigas from Peru oceanic waters.
The δ15N values suggest a typical classification of the trophic position of squid generally with an ontogenetic strategy shift from low to higher trophic level. However, in our study area, several individuals showed an unexpected decrease or stable δ15N with squid growth (see slope in Table 2). As proposed above, a geographic variation of isotopic baseline generated by squid movement might be responsible for this.Based on individual δ15N value variations over a lifetime, Vander-Zanden, Bjorndal, Reich, and Bolten (2010) proposed three population patterns, being specialist population-specialist individuals, generalist population-specialist individuals, and generalist population-generalist individuals. Consequently,D. gigasin our study area have generalist feeding populations composed of generalist feeder individuals that use food in a wide range of isotopic signatures. This was also found in other squid such asOmmastrephes bartramii(Kato et al., 2016),D. gahi(Rosas-Luis et al., 2017),I. argentinus(Rosas-Luis et al., 2017) andSthenoteuthis pteropus(Merten et al., 2017) by isotopic analysis along the gladius.
Inter-individual variation of δ15N values of eye lenses were 11.18‰,11.56‰, 10.67‰ and 10.29‰ in embryonic, paralarval, juvenile and adult stage, respectively for our study samples. This large inter-individual difference could result from variations in squid trophic level or isotopic baseline, which is reflected in the isotope values of the squid. If shifts in the trophic levels were the mechanism producing this large inter-individual variation, then there would be variations of approximately three to four trophic levels for each ontogenetic stage. However,this case might be impossible especially at the paralarval and juvenile stage, even thoughD. gigasis a voracious predator that can occupy a trophic level from crustacean to fish (Nigmatullin et al., 2001). Indeed,stomach content studies suggest that paralarval and juvenileD. gigasmainly feed on low trophic level food such as pelagic crustacean and mesoplankton (Camarillo-Coop, Salinas-Zavala, Lavaniegos, &Markaida, 2013). Consequently, these inter-individual variations in the δ15N values ofD. gigasreflect differences in nutrient dynamics and subsequent δ15N values at the base of the marine food web.
In summary, SIA, using the eye lens as a life history recorder, has emerged as useful for reconstructing squid trophic habitat (Hunsicker et al., 2010; Meath, 2017; Onthank, 2013; Parry, 2003). In this study,we present the first results on the isotopic signatures inD. gigaseye lenses, coupled with age information obtained from the statolith. Our results show that eye lenses serve as a repository for chemical information relating to the whole life history of an individual, allowing for retrospective investigation of trophic history by SIA. However,previous isotopic studies forD. gigasmainly focused on muscle tissue,beaks and gladii. Further research that examines how isotopic signatures vary among beaks, gladii, eye lenses and muscle tissue is required to make better comparisons between isotope studies for this squid.
Acknowledgements
We thank Mrs. Chunxia Gao for the measurement of isotope values.We thank Mrs. Pauline H. Lovell for editing the English text of a draft of this manuscript. This work was sponsored by the Shanghai Pujiang Program (No. 18PJ1404100), the Program for Professor of Special Appointment (Eastern Scholar) at Shanghai Institutions of Higher Learning, China (No. 0810000243) and the National Natural Science Foundation of China (Nos. 41306127 and 41276156).
Appendix A. Supplementary data
Supplementary data to this article can be found online at https://doi.org/10.1016/j.aaf.2019.05.001.
 Aquaculture and Fisheries2019年6期
- Aquaculture and Fisheries的其它文章
- A corpus-based approach to understanding market access in fisheries and aquaculture international business research: A systematic literature review
- Genes for sexual body size dimorphism in hybrid tilapia (Oreochromis sp. x Oreochromis mossambicus)
- Somatostatin 4 regulates growth and modulates gametogenesis in zebrafish
- Transcriptome analysis of gill from Lateolabrax maculatus and aqp3 gene expression
- A trap with light-emitting diode (LED) lights: Evaluating the effect of location and orientation of lights on the catch rate of snow crab(Chionoecetes opilio)