
Transcriptome analysis of gill from Lateolabrax maculatus and aqp3 gene expression
2019-12-05 01:49YaweiShenYudongHeYanhuiBiJianpengChenZiweiZhaoJunLiXiaowuChen
Aquaculture and Fisheries 2019年6期
Yawei Shen, Yudong He, Yanhui Bi, Jianpeng Chen, Ziwei Zhao, Jun Li,Xiaowu Chen
a National Demonstration Center for Experimental Fisheries Science Education, Shanghai Ocean University, Shanghai, 201306, China
b Shanghai Engineering Research Center of Aquaculture, Shanghai, 201306, China
c Shanghai Collaborative Innovation for Aquatic Animal Genetics and Breeding, Shanghai, 201306, China
d CAS Key Laboratory of Experimental Marine Biology, Institute of Oceanology, Chinese Academy of Sciences, Qingdao, 26000, China
e Laboratory for Marine Biology and Biotechnology, Qingdao National Laboratory for Marine Science and Technology, Qingdao, 26000, China
Keywords:Lateolabrax maculatus Gill Transcriptome Aquaporin 3
A B S T R A C T The Lateolabrax maculatus is an important marine fish in China that can adapt to a wide range of water salinities.The gill is the main organ involved in fish osmoregulation and in this study, a cDNA library of the L. maculatus gill was constructed to understand gill function in Lateolabrax maculatus and it adaptation to salinity. A total raw data of 5.3G base pairs was obtained, followed removal of low-quality and linker DNA sequences and it yielded a total of 23,038,590 clean reads. After splicing and clustering, 31,976 unigenes were obtained. The average transcript length was 1327 bp and N50 was 2057 bp. In comparisons with other tissues analysis of the gill transcriptome revealed a high level of relative expression of apolipoprotein E, CD74, keratin, type I cytoskeleton 13,carbonic anhydrase, betaine-homocysteine S-methyltransferase, and aquaporin 3 (AQP3) genes. The L. maculatus aqp3 (Lm-aqp3) gene was specific for the gills Lm-aqp3 and this gene has a typical transmembrane structure of six alpha helices and a water channel domain. Phylogenetic analysis indicated that Lm-aqp3 clusters with the homologue genes from Labrus bergylta and Dicentrarchus labrax. Quantitative RT-PCR confirmed that Lm-aqp3 was highly abundant in the gills and low expressed in other tissues (stomach, liver, brain, spleen and testis).Analysis of Lm-aqp3 in freshwater aquaculture fish revealed that gene expression was significantly statistical higher than in seawater (20 ppt) fish, suggesting that Lm-aqp3 may play an important role in water metabolism and osmotic pressure regulation in L. maculatus.
1. Int roduction
The gill is an important respiratory, excretory and osmoregulatory organ that plays an important role in the regulation of osmotic pressure to environmental salinity changes of the fish (Marshall & Grosell,2006). In a hypotonic environment, the water molecules tend to diffuse passively into the cells. To maintain osmotic equilibrium, the excess of water is compensated by the outward flow. Aquaporin (AQP) is an hydrophobic transmembrane protein that is involved in the transport of water molecules through the cell phospholipid bilayer membrane(Madsen, Engelund, & Cutler, 2015). This protein was firstly isolated from human erythrocyte membranes (Denker, Smith, Kuhajda, & Agre,1988) and to date, 13 aquaporins have been discovered in mammals,namely, AQP0-AQP12, and they are collectively known as the aquaporin family. Based on sequence homology and functional characteristics the aquaporin family is divided into three categories: waterpermeable or aquaporin (AQP0, AQP1, AQP2, AQP4, AQP5, AQP6, and AQP8); aquaglyceroporin or permeable to water, glycerol, and urea(AQP3, AQP7, AQP9, and AQP10) (King, Kozono, & Agre, 2004) and;AQP11 and AQP12 that are intracellular molecules that share low amino acid sequence homology with other aquaporins, and their biological functions are elusive (Calvanese, Pellegrini-Calace, & Oliva,2013). Homologues of the mammalian AQPs have been also described in teleosts and they exhibit some differences in function and expression pattern (Madsen et al., 2015) and in teleosts it is dependent of the species, tissues, and environments (Cutler, Martinez, & Cramb, 2007).For example, fishaqp3was reported to be expressed in chloride cells of the gill, and to play an important role in osmoregulation (Cutler et al.,2007; Madsen et al., 2015).
The Asian sea bass (Lateolabrax maculatus) is mainly distributed in the coastal areas of East Asia and in estuary. This teleost fish can be cultured in both seawater and fresh water and is an important economic aquaculture fish species in China and modifications of water salinity exert a remarkable influence on the species fertilization, reproduction and growth abilities (Du et al., 2013). Nonetheless studies on theL.maculatusgills are rare. In this study, a high-throughput sequencing ofL. maculatusgills was carried out and theL. maculatus aqp3gene that is highly abundant in the gills was cloned and expression characterized in freshwater and marine fish. Our results provide basic molecular information for studying the mechanisms of fish adaptation to environmental salinity.
2. Materials and methods
2.1. Animals and RNA extraction
TheL. maculatusused in the study were catch from the Yangtze River estuary. Some animals were gradually adapted to freshwater during 7 days and others maintained in seawater (20‰ salinity). After 3 months, five freshwater (FW) and sea water (SW) animals (approximate weight 200 g) were collected and 30 mg of the stomach, liver,brain, spleen, and testis were dissected and stored in liquid nitrogen.Total RNA (tRNA) was extracted using Trizol reagents (Ambion) according to the manufactures instructions and the quality was checked on agarose gel electrophoresis. The concentration of tRNA extracted was measured using a Nanodrop 2000 micro-ultraviolet spectrophotometer and integrity checked on Agilent 2000. The tRNA OD260/OD280 ratio was between 1.8 and 2.0, and RIN≥7.0 (RNA integrity test). The gill samples were used for library construction and equal amounts of tRNA total RNA from five individuals were pooled for RNASeq library. The remaining tRNA was reserved for reverse transcription real-time quantitative PCR (qPCR) analysis.
2.2. Transcriptome and sequencing
TheL. maculatusgill cDNA library was constructed according to the Illumina Gene Expression Sample Prep Kit instructions, and doubleended sequencing was conducted using the Illunina HiSeq 2000 instrument with a read length of 150 bp. Raw reads were filtered using the SolexQA software followed by adapter removal (unknown base N >10%, and low quality bases (Q ≤10 bases account for more than 50% of the entire reads) (Cox, Peterson, & Biggs, 2010).
De novo assemblies were obtained using Trinity software (Haas et al., 2013) and sequences were aligned with a known protein library database using BLASTX (ftp://ftp.ncbi.nih.gov/blast/db/FASTA/nr.gz).GO annotations was performed used Blast2GO (http://www.blast2go.com/)(Conesa et al., 2005). Signaling pathway analysis was conducted with KEGG database (http://www.genome.jp/kegg/) (Kanehisa, Goto,Kawashima, Okuno, & Hattori, 2004), and functional annotation with eggnog (http://eggnog.embl.de/) (Powell et al., 2012). To calculate relative gene expression, the number of reads was counted and normalized into reads per kb per million reads (RPKM).
2.3. cDNA synthesis and Lm-aqp3 cloning
cDNA was synthesized from 500 ng of gill tRNA according to the Prime Script™RT reagent kit with gDNA eraser. The Lm-aqp3 cDNA containing the complete open reading frame was obtained from the transcriptome and specific primers for cDNA amplification were designed to obtain the complete coding region (Table 1).
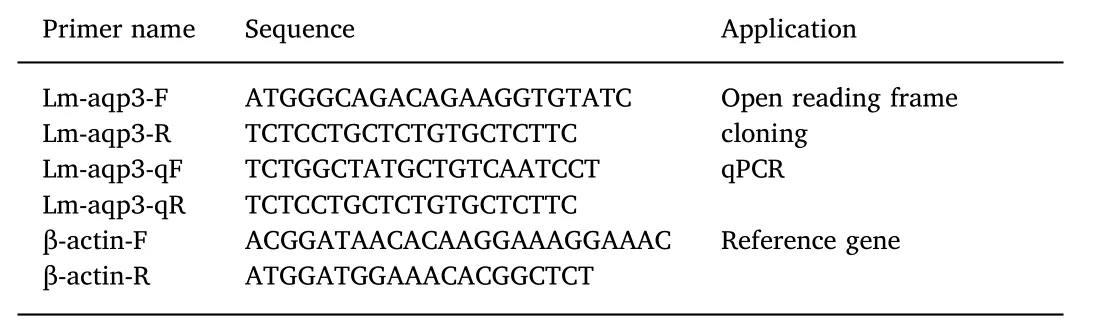
Table 1 Primers used for Lm-aqp3 cDNA cloning and RT-qPCR.
2.4. Gene expression
Reverse transcription (RT)- qPCR was carried out according to the TAKARA SYBR ExScript RT-PCR kit for a final PCR reaction volume of 20 μL qPCR reactions were performed on a Bio-Rad CFX96 real-time PCR machine. A standard curve was performed by 10-fold gradient dilution of the cDNA to measure the amplification efficiency of Lmaqp3 andβ-actin primers. qPCR was performed to verify the difference in gene expression between the two groups. The cDNA was synthesized from 100 ng of mRNA by PrimerScript RTase (Takara). A quantitative reaction was performed on LightCycler 480 release 1.2.0.0625 (Roches)using the SYBR Premix Ex TaqTM II (Takara). Then, qPCR was conducted at 50 °C for 2 min, 95 °C for 5 min, and 40 cycles of 95 °C for 15 s and 60 °C for 1 min. The specificity of the reaction was verified through melt curve analysis. All reactions in the qPCR system were normalized using Ct values corresponding to theβ-actin levels. The primers used in this study are shown in Table 1. The relative gene expression levels were calculated using the 2-ΔΔCtmethod, and all of the qPCR experiments were repeated in eight crab individuals with three technical replications. Three tubes contained all PCR reagents, except the template that was also used as a negative control. Statistical analyses were performed using Student'st-test. Statistical significance atP<0.05 was considered significantly different as indicated in the figures.
2.5. Sequence analysis and phylogeny
Transmembrane regions were predicted using the online tool TMHMM server 2.0 (http://www.cbs.dtu.dk/services/TMHMM). The signal peptide was predicted using the SignalP 4.1 server (http://www.cbs.dtu.dk/services/SignalP), and the relative molecular mass and isoelectric point were calculated with ExPASy Compute pI/Mw tool(http://web.expasy.org/compute_pi). NetPhos 2.0 server (http://www.cbs.dtu.dk/Services/NetPhos) predicted Ser, Thr, and Tyr phosphorylation sites. NetNGlyc1.0 server (http://www.cbs.dtu.dk/services/NetNGlyc) predicted the localization of the N-terminal glycosylation sites. TheL. maculatusLm-aqp3 protein structure was predicted using the SWISS-MDL server, and the 3D-structure was visually edited and mapped in the PyMOL software.
All protein homologues of Aqp3 were retrived form the GenBak database. Multiple alignments were performed with the ClustalX program 1.83. The phylogenetic tree was constructed by the neighborjoining method with MEGA 6.0 for 100 replicates.
3. Results
3.1. Transcriptome analysis
The raw data of the gill transcriptome was 5.3G and the GC content was 53.38%. After removing low-quality and linker sequences 23,038,590 clean reads (out of 26,097,004 raw reads) were obtained andde novoassembly revealed 178,249 contigs. All contigs were assembled into 105,635 transcripts that were clustered in 31,976 unigenes (Table 2). The raw data was submitted to the NCBI database under the SRA accession number SRP066455.

Table 2 Summary of Illumina sequencing and assembly results.
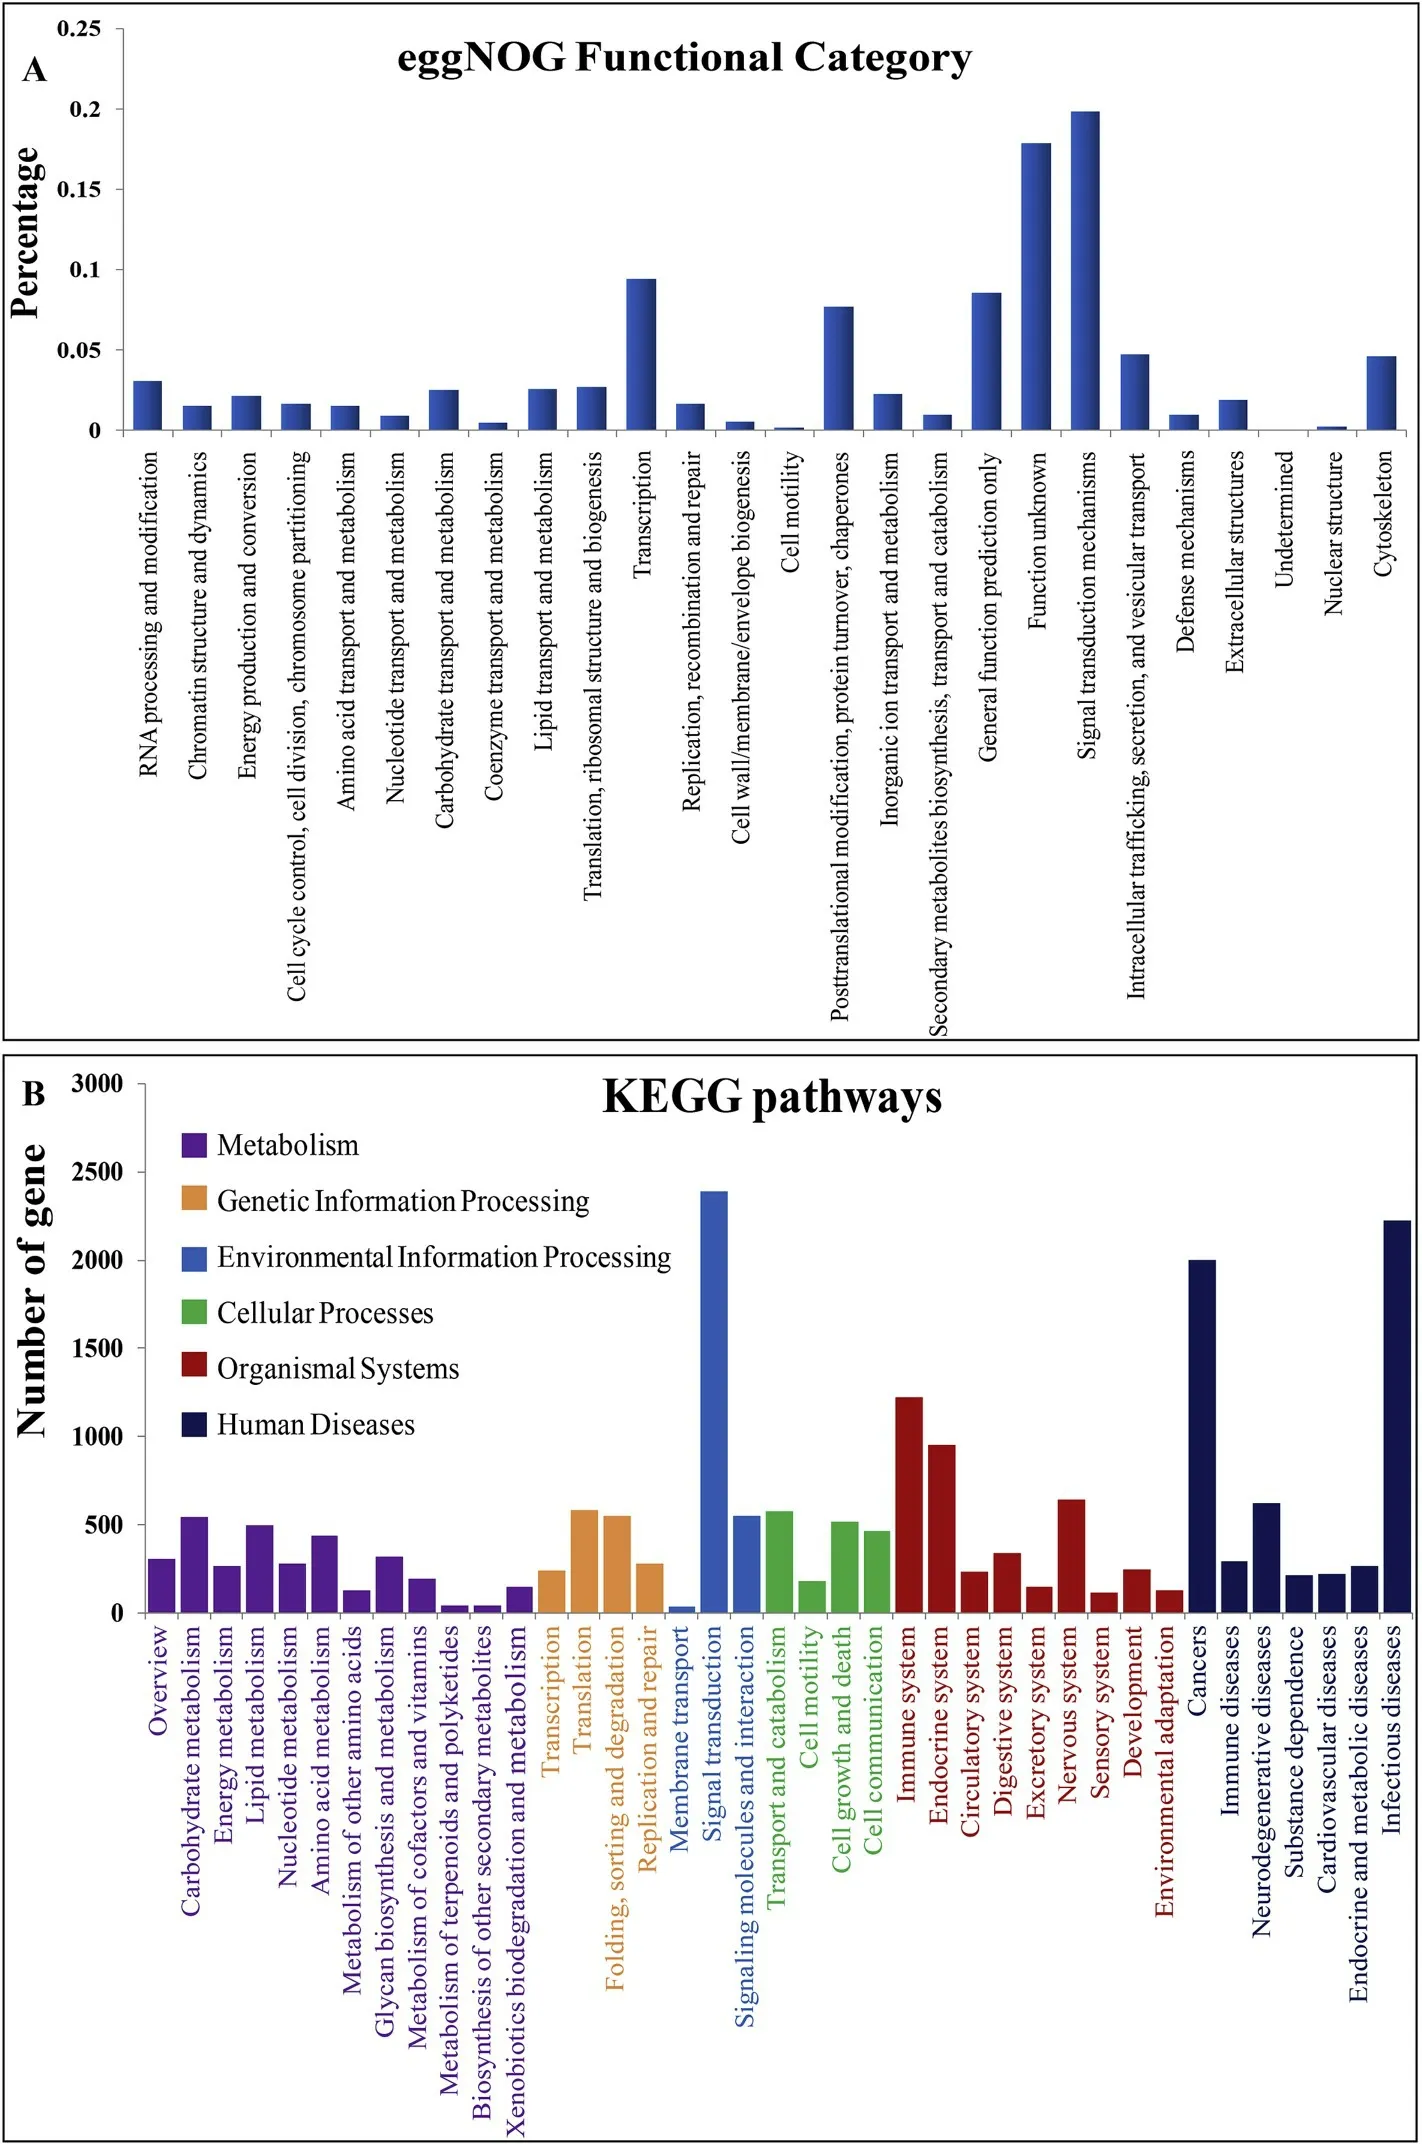
Fig. 1. Classification of the L. maculatus gill assembled unigenes according to EggNOG (A) and KEGG (B).
3.2. Sequence annotation and analysis
All 31,976 unigenes were annotated according to the eggNOG, GO,or KEGG databases and the number of genes annotated was 28,430,21,924, and 9,662, respectively. Among the 26 eggNOG categories, the signal transduction mechanism was the most abundant category, with 6037 (19.81%) unigenes, followed by transcription (2857 unigenes;9.37%), general function prediction and post-translational modification(2606 unigenes; 8.55%), and protein conversion and molecular chaperone (2336 unigenes; 7.66%; Fig. 1A). The obtained KO numberswere annotated in 42 secondary pathways (Fig. 1B).
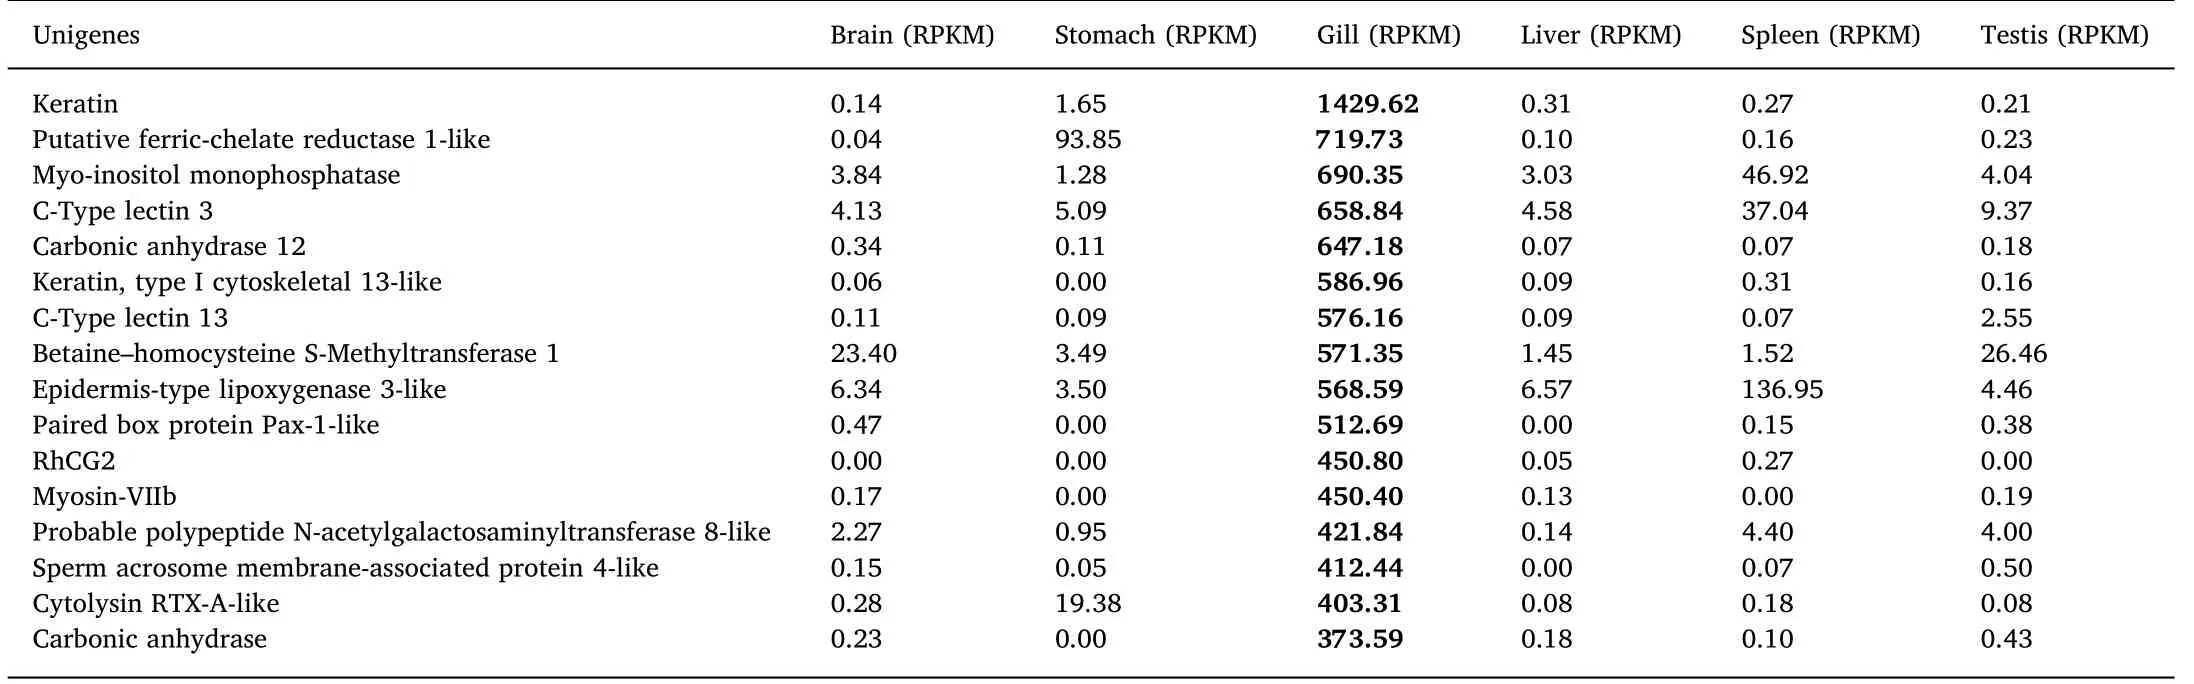
Table 3 Relative expression (RPKM) of the 15 most abundant genes in the gills and five other tissues of L. maculatus.
TheL. maculatusgill transcriptome was compared with transcriptome data of the brain, stomach, liver, spleen, and testis (TSA accession number: GBZV00000000.1) and the 16 most abundant genes in the gill were keratin, carbonic anhydrase (CA), C-type lectin (CLEC),ferric-chelate reductase, and betaine-homocysteine S-methyltransferase (BHMT) (Table 3).
Nineaqpfamily genes, namely,aqp1,aqp3,aqp4,aqp7,aqp8,aqp9,aqp10,aqp11, andaqp12, were obtained from the gills and based on their relative abundance (RPKM value)aqp4was found to be most abundant in the stomach, brain, testis, and spleen;aqp11in the liver;andaqp3was mostly abundant in the gills (Fig. 2A). RT-PCR on different tissues confirms thatLm-aqp3was specifically expressed in the gill (Fig. 2B).
3.3. Gene sequence analysis of Lm-aqp3
High-throughput sequencing and RT-PCR demonstrated that the full-length cDNA ofLm-aqp3was 2071 bp, including the complete open reading frame of 909 bp encoding for 302 amino acids (Fig. 3A). The gene structure ofLm-aqp3was analyzed by comparison with the genome sequencing ofL. maculatus(SRA: SRR3529497) (Fig. 3B) and it revealed that it is composed by six exons and five introns and this structure is conserved across other species and the size of the third exon(138 bp) was conserved across all the species (Fig. 3C). TheLm-aqp3sequence of was submitted to GenBank with the accession number MK163620.
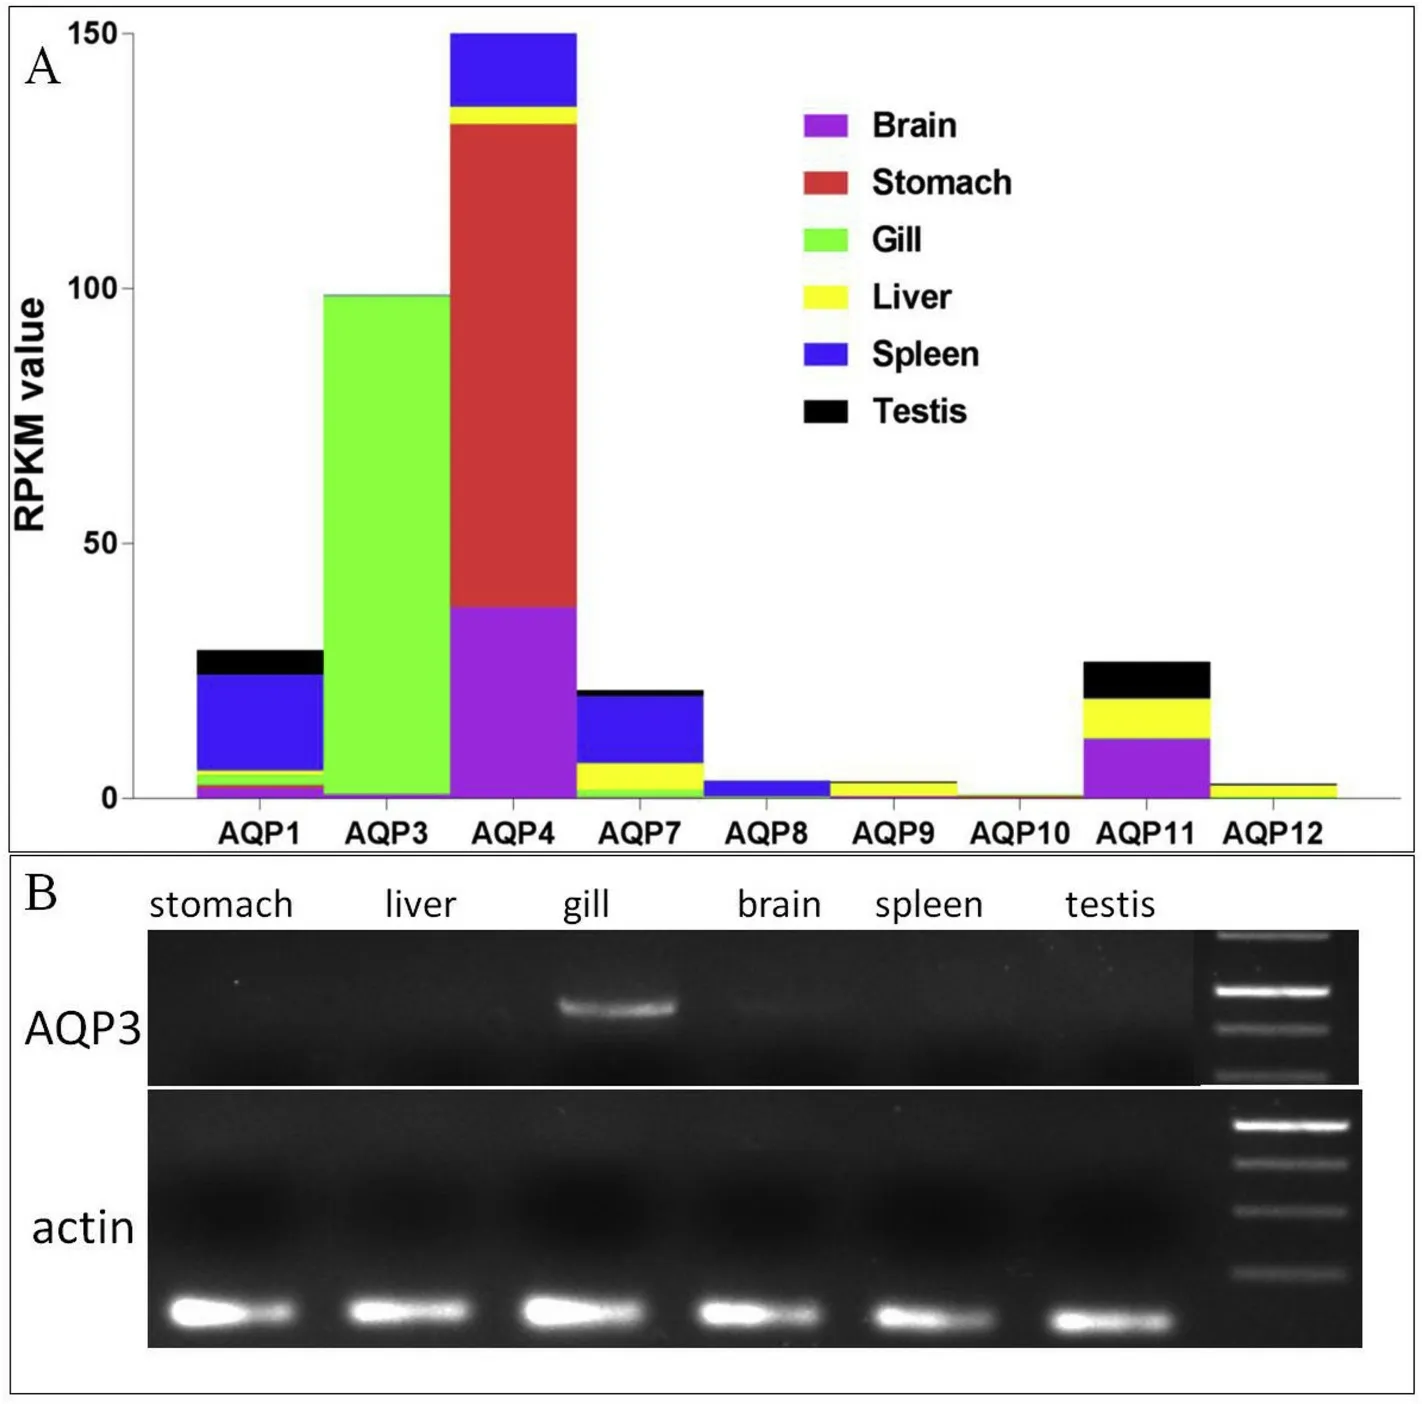
Fig. 2. Gene expression of Lm-aqp gene family members in L. maculatus. A: Transcriptome profile of Lm-aqp genes; B: Agarose gel electrophorese of the RT-PCR gene product for Lm-aqp3 in different tissues. Purple: brain; Red: stomach; Green: gill;Yellow: liver; Blue: spleen; Black: testis. (For interpretation of the references to colour in this figure legend, the reader is referred to the Web version of this article.)
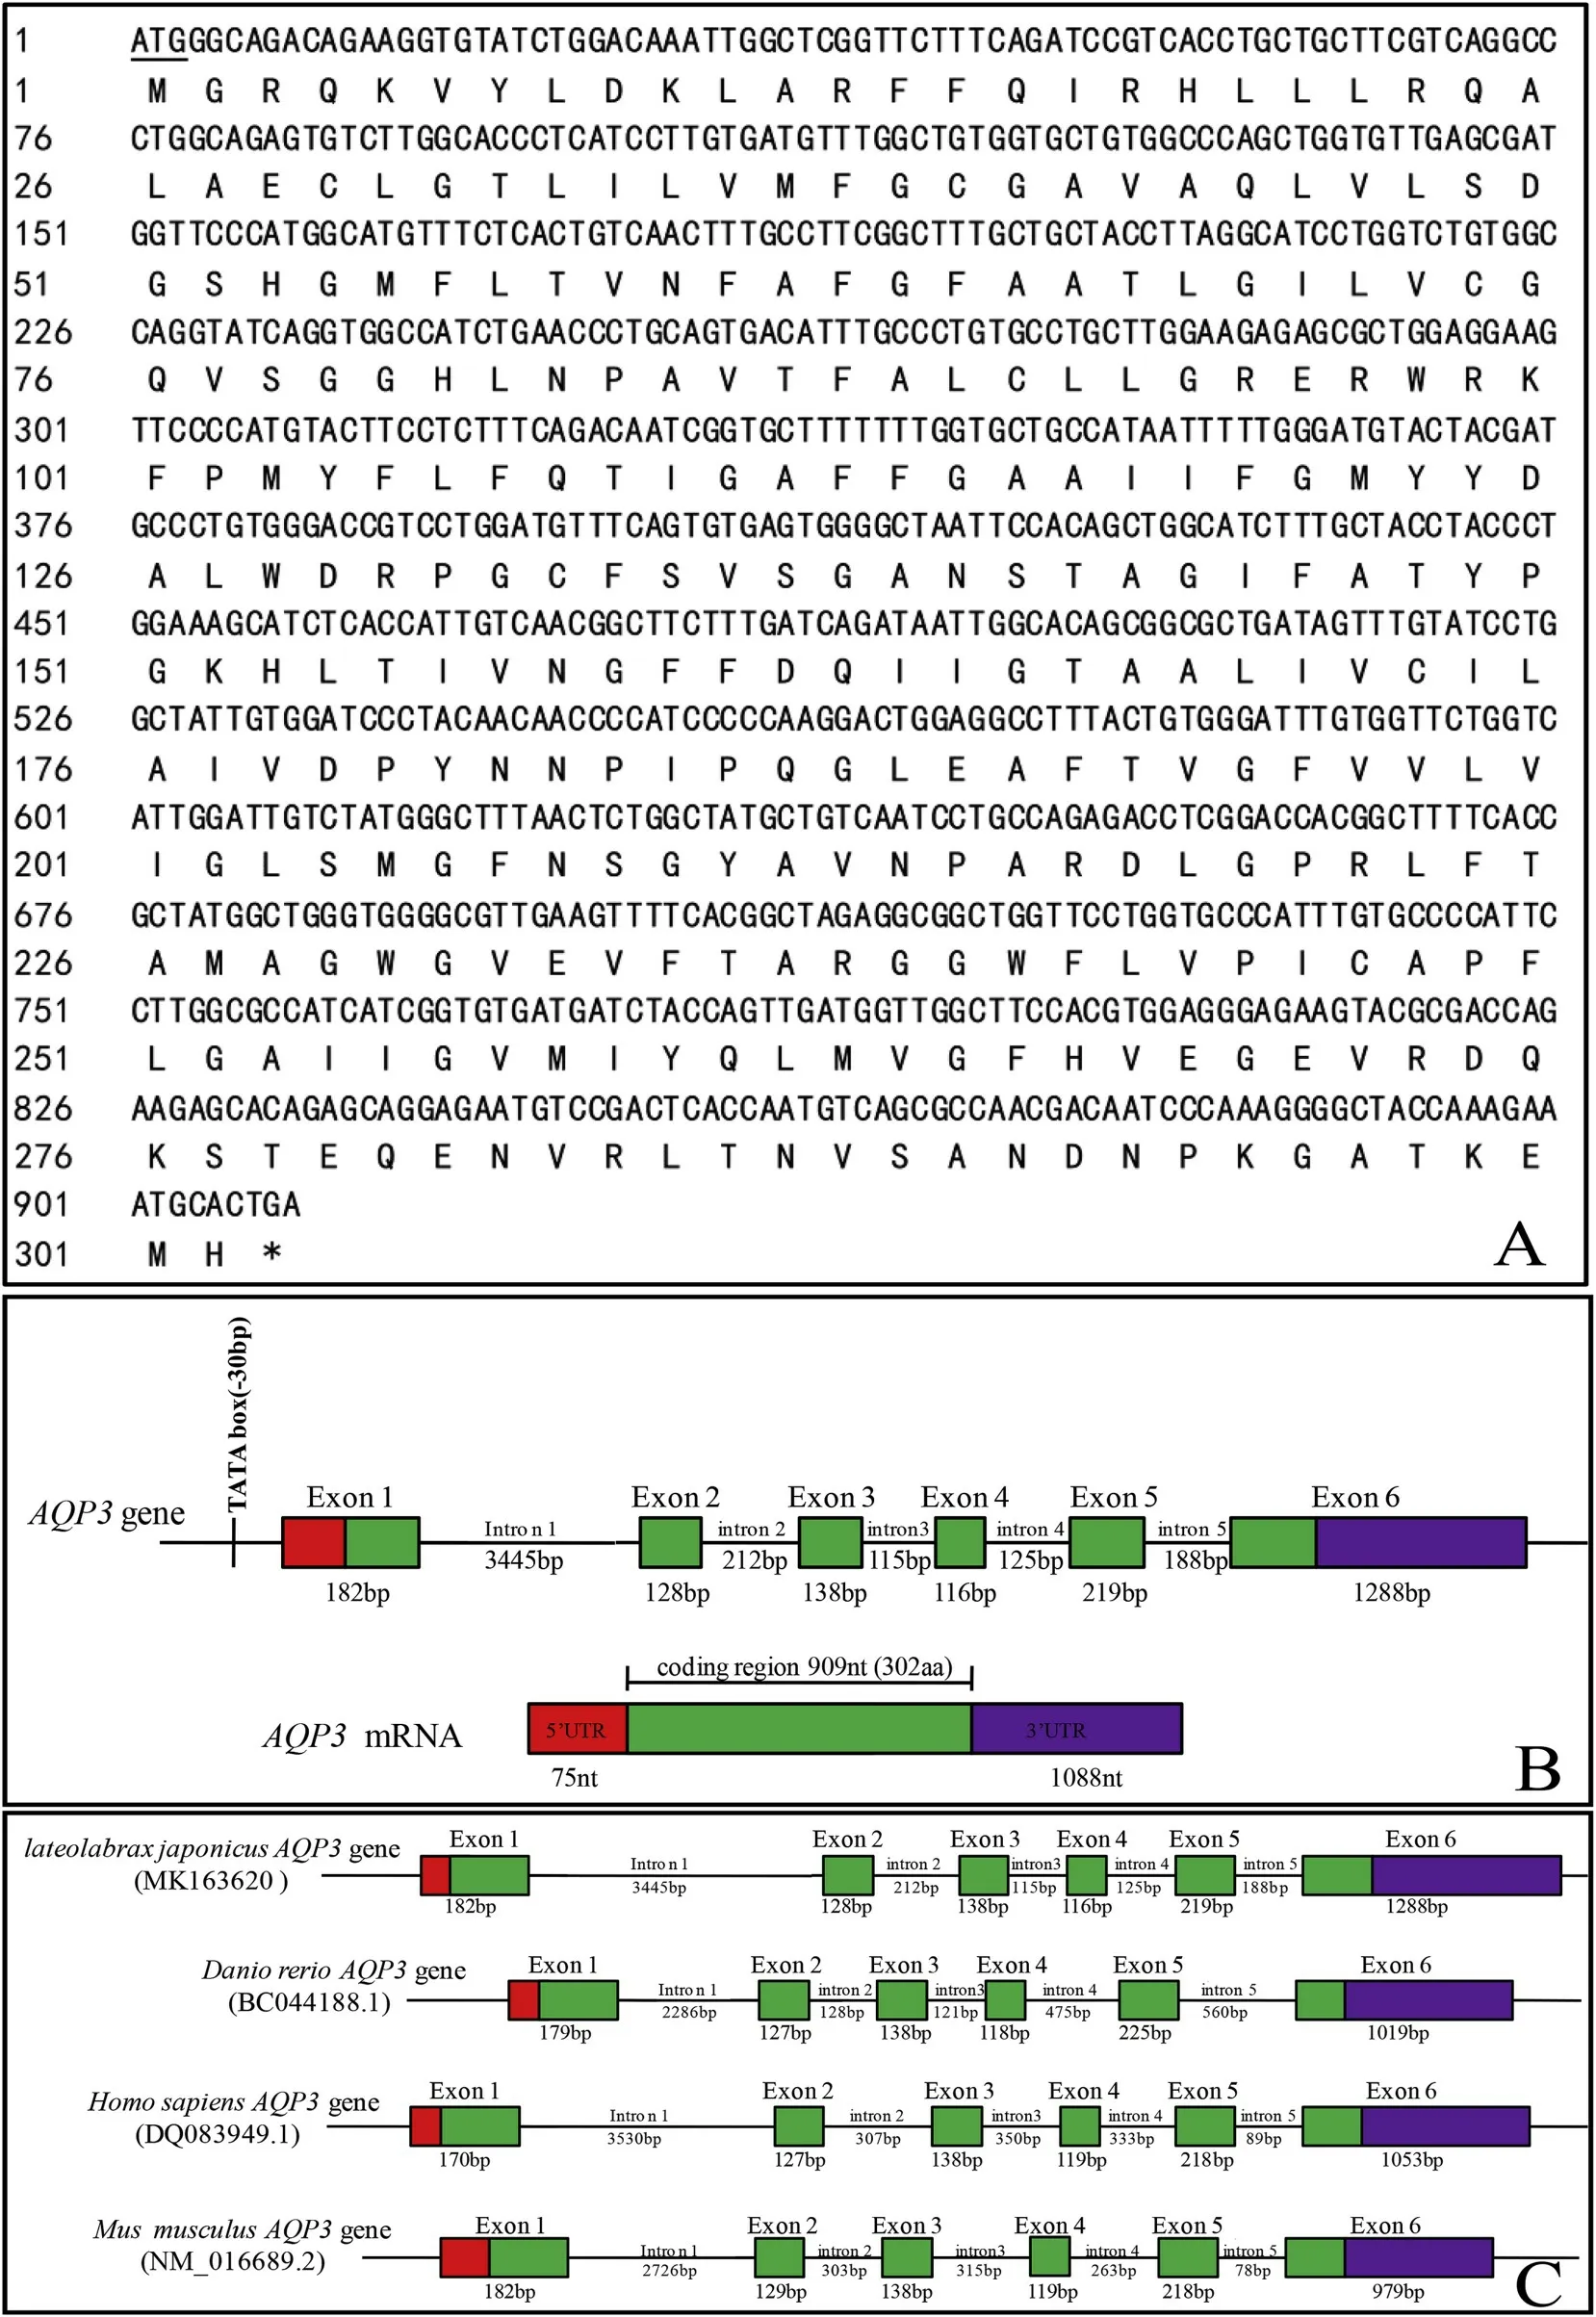
Fig. 3. Characterization of the L. maculatus aqp3. A. cDNA and deduced protein, B. Gene structure and C. Comparison of vertebrate aqp3 gene structure. The start codon ATG is underlined; the stop codon is indicated by an asterisk. Squares represent exons; line styles represent introns. The red square represents the 5-terminal non-coding region (5′UTR), green square represents the coding region (CDS), and purple square represents the 3-terminal non-coding region (3′UTR). (For interpretation of the references to colour in this figure legend, the reader is referred to the Web version of this article.)
3.4. Molecular evolutionary analysis of Lm-aqp3
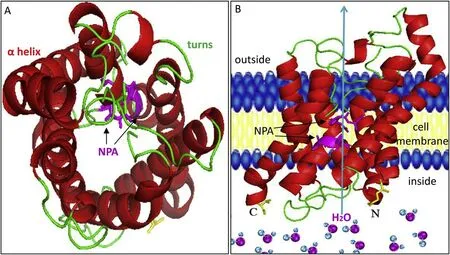
Fig. 4. Multiple sequence alignment of AQP3 proteins from vertebrates. Motif of NPA is indicated by a red square. The identical amino acids are indicated in black.Green, blue, and yellow indicate that the similarity is bigger than 75%, 50%, and 33%, respectively. . (For interpretation of the references to colour in this figure legend, the reader is referred to the Web version of this article.)
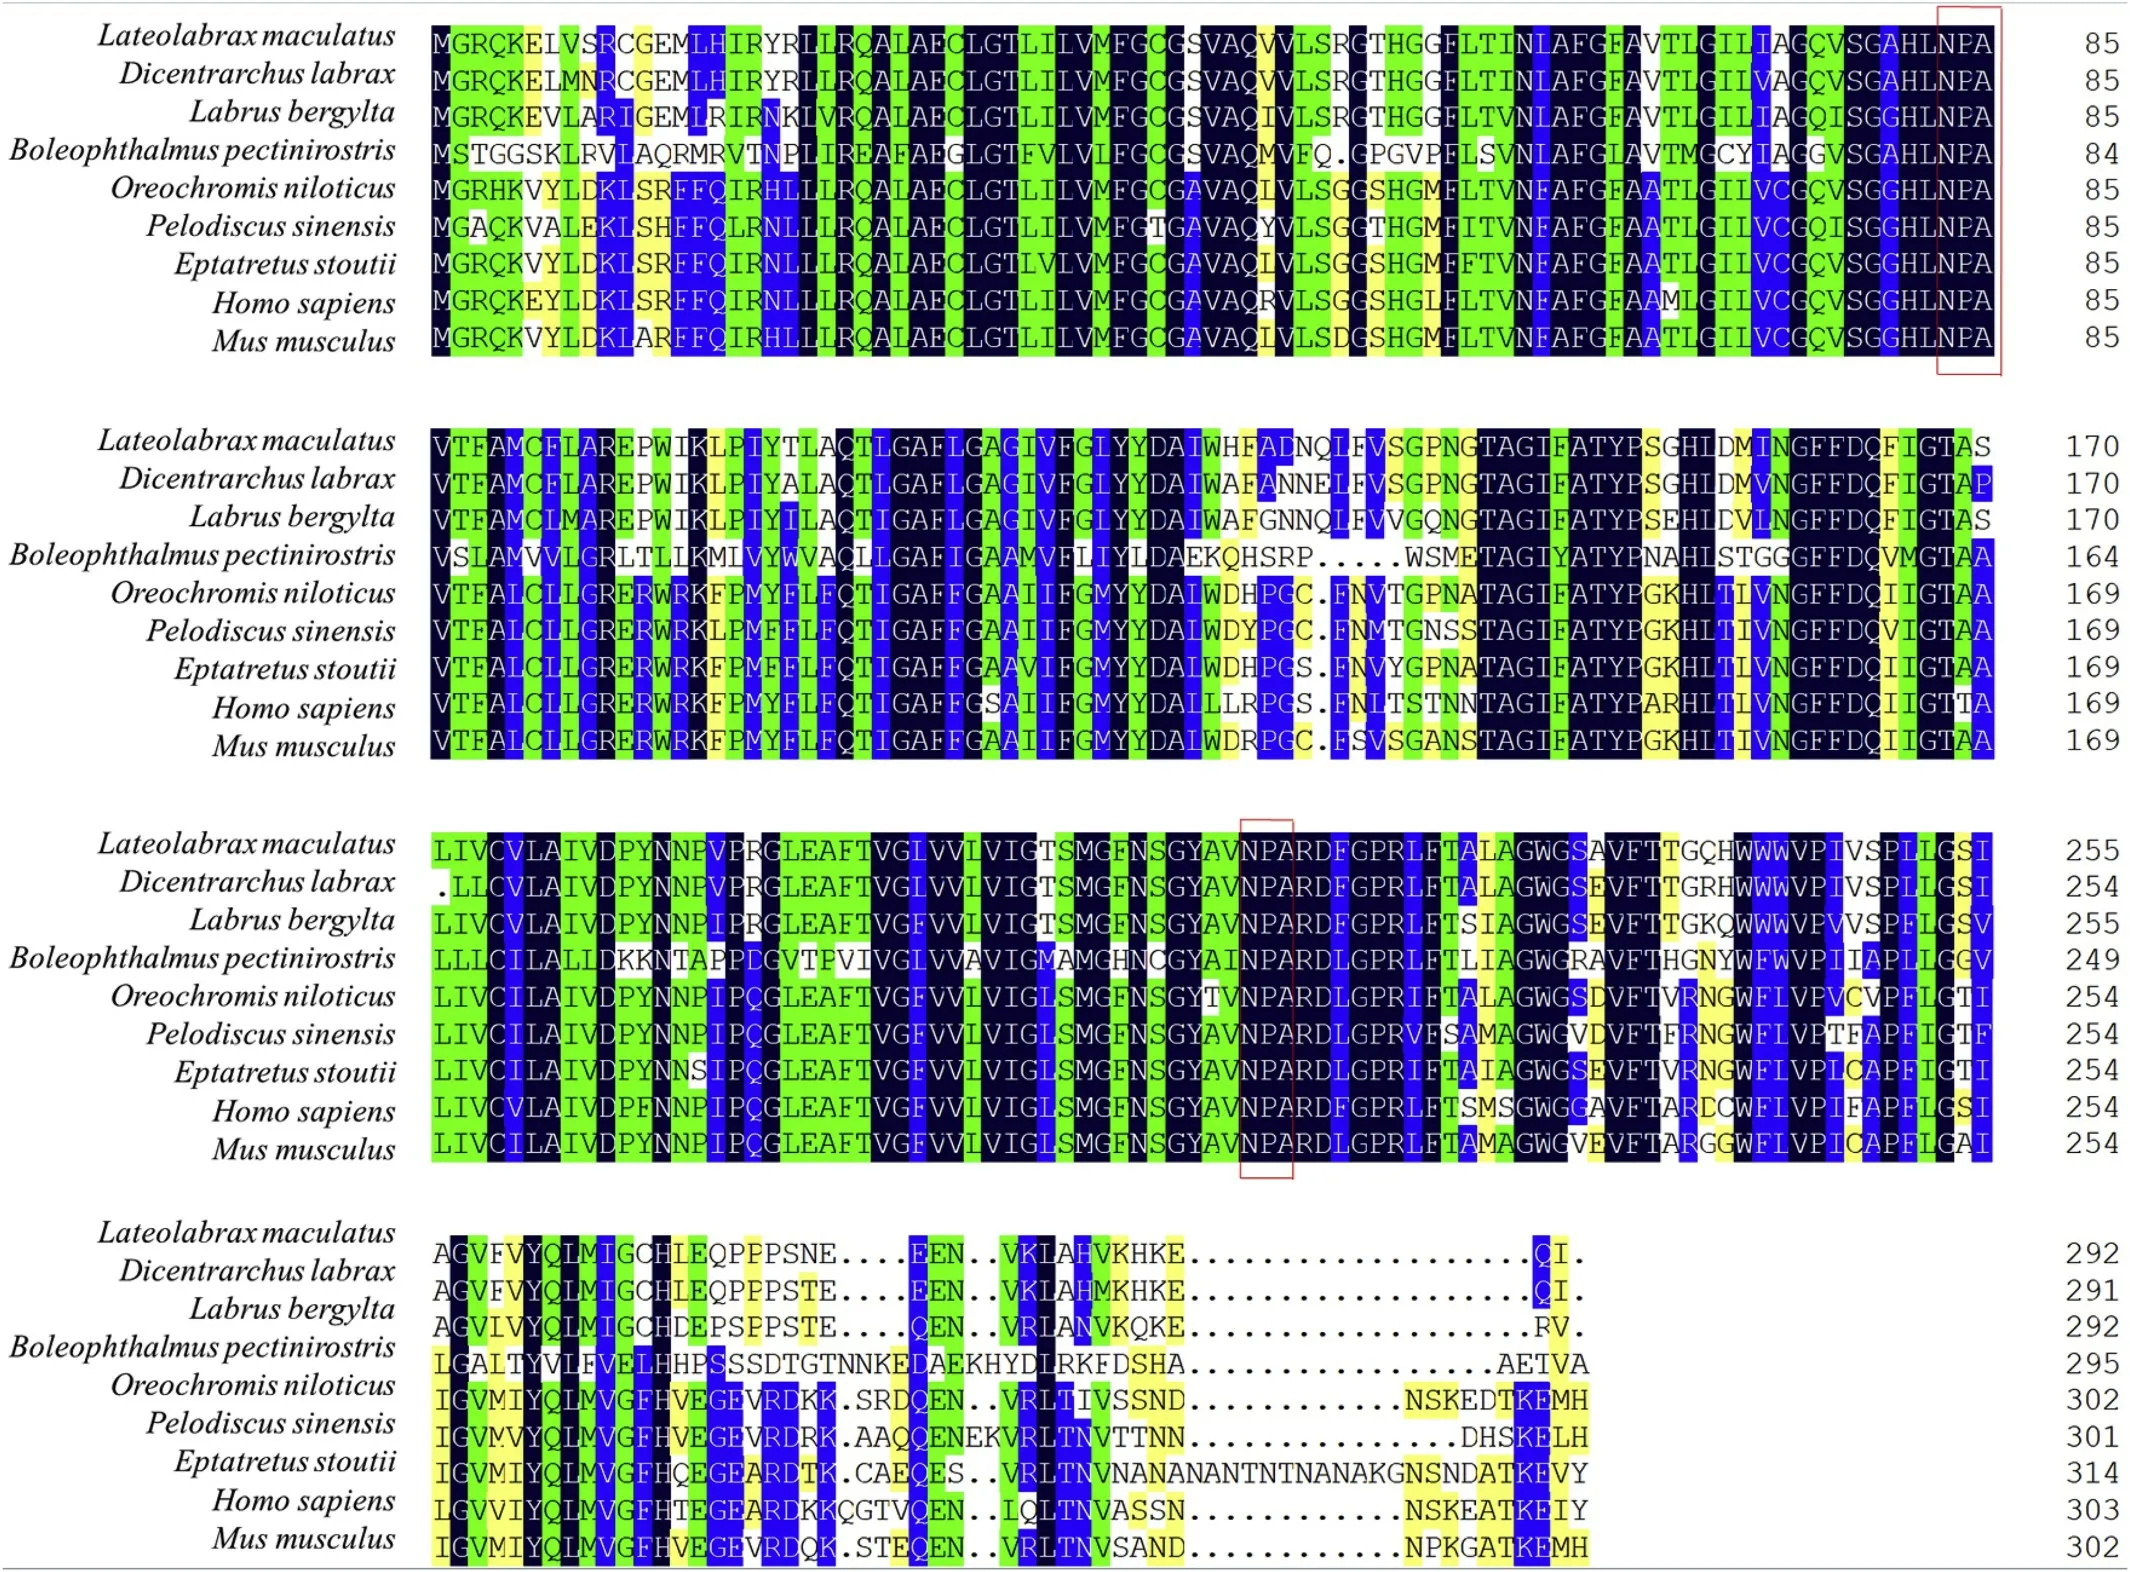
Fig. 5. Multiple sequence alignment of AQP3 proteins from vertebrates. The NPA motif is indicated by a red square. The totally identical amino acids are shaded in black and in green, blue, and yellow represent 75%, 50%, and 33% similarity, respectively. . (For interpretation of the references to colour in this figure legend, the reader is referred to the Web version of this article.)
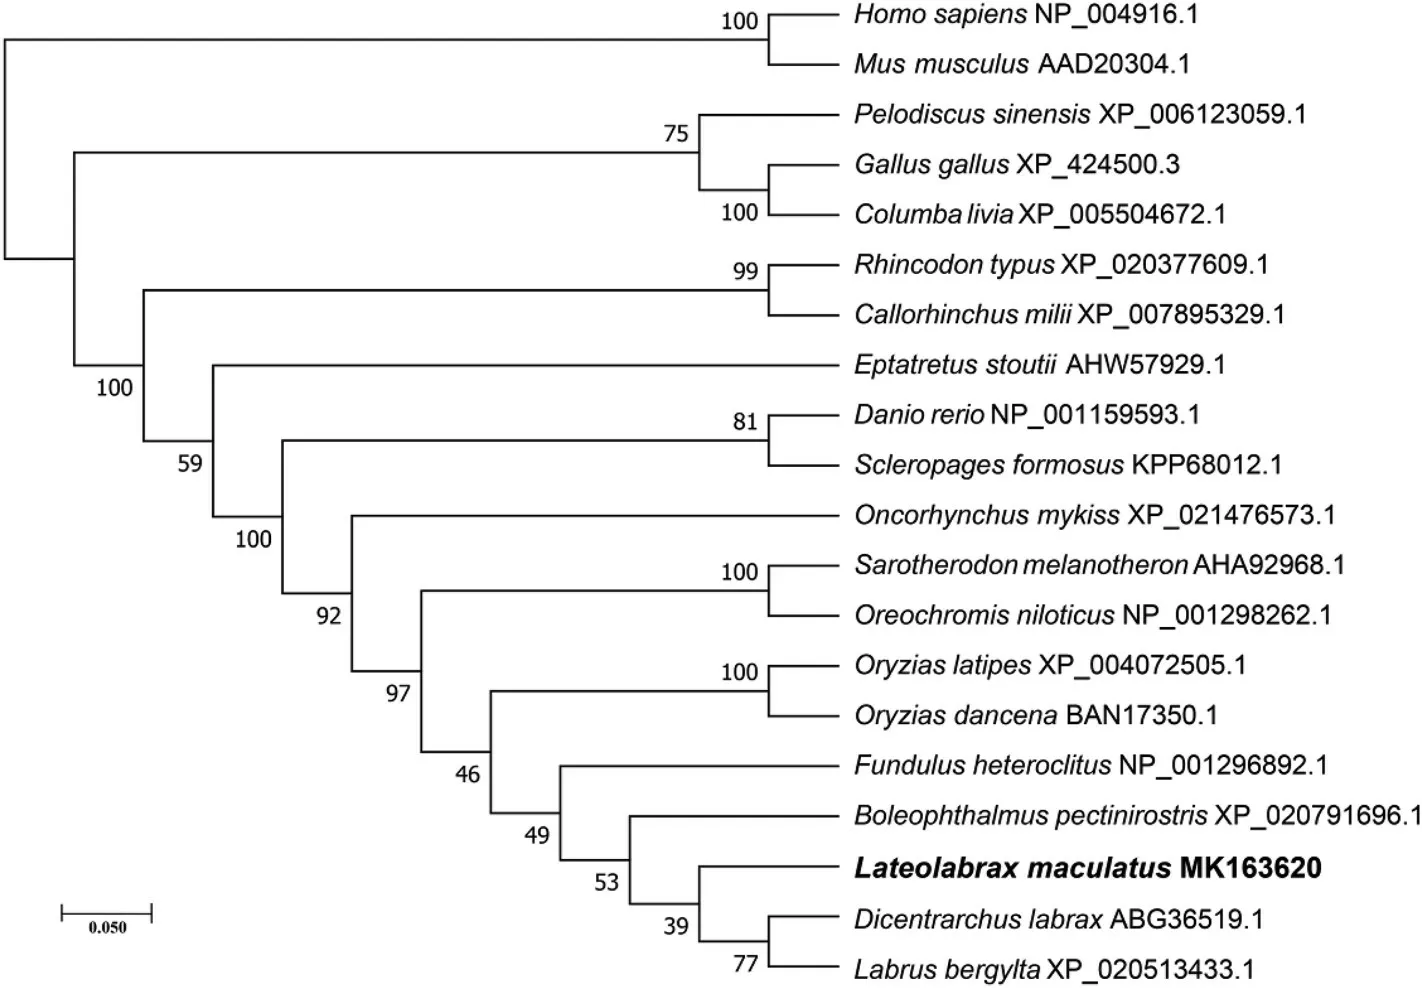
Fig. 6. Phylogenetic tree of AQP3 constructed with the neighbor-joining method in MEGA 7.0. Node values represent percent bootstrap confidence derived from 100 replicates. The L. maculatus is highlighted in bold.
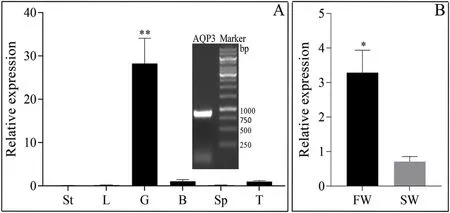
Fig. 7. Relative expression profile of Lm-aqp3 in (A) different tissues and (B) in the gills of different salinity cultured fish. The (A) upper right panel represents the amplified Lm-aqp3 product; St: stomach; L: liver; G: gill; B: brain; Sp:spleen; T: testis; FW: fresh water; SW: sea water * and ** indicate statistical significant differences between groups. *P <0.05, **P <0.01.
Bioinformatics analysis showed that the relative molecular mass ofLm-aqp3was 32,743.36 KD, and the theoretical isoelectric point was 8.16. Transmembrane region prediction showed six transmembrane regions, and the transmembrane sites were localized within 26-48 aa,58-80 aa, 101-123 aa, 156-178 aa, 191-213 aa, and 241-263 aa. TheLm-aqp3protein exhibited nine Ser phosphorylation sites, 15 Thr phosphorylation sites, and eight Tyr phosphorylation sites. TheLmaqp3was speculated to contain two N-terminal glycosylation sites of140NSTA and287NVSA. 3D structural analysis showed thatLm-aqp3is structurally similar to that of higher vertebrates and comprised six αhelices and several irregular corners, forming a hollow barrel structure.The α-Helices were located within the six predicted transmembrane regions and the amino and carboxy terminus are predicted to face the cytoplasm, and the two NPA motifs are within the cell membrane(Fig. 4).
Multiple sequence alignment of theLm-AQP3 amino acid sequence with the homologue proteins from other teleosts (Dicentrarchus labrax,Boleophthalmus pectinirostris,Labrus bergylta,Oreochromis niloticus), the cyclostome (Eptatretus stoutii) the reptile (Pelodiscus sinensis) and two mammals (Mus musculusandHomo sapiens) showed that they are highly similar (137 amino acids were identical and 111 amino acids were highly similar) and that two highly conserved NPA motifs are preserved(Fig. 5).
Phylogenetic analysis showed that Lm-Aqp3 clustered in close proximity with the Apq3 ofD. labraxandL. bergyltawithin the bony fish branch and the sequences radiate according to the species taxonomic relationships (Fig. 6).
3.5. Gene expression of Lm-aqp3
The qPCR results show that theLm-aqp3gene was highly expressed(p <0.01) in the gills but was poorly abundant/not amplified in the stomach, liver, brain, spleen, and testis (Fig. 7A). The Lm-aqp3 expression level in the gills of freshwater cultured fish was much higher(p <0.05) when compared with the sea water cultured fish (Fig. 7B).
4. Discussion
The gills of teleost fish are divided in three parts: the gill rakers, the gill arches, and the gill filaments. The gill filaments contains a capillary network responsible for oxygen and carbon dioxide exchange (Hoar,Randall, & Donaldson, 1983) and its surface is covered by cuboidal and squamous epithelial cells, mucous cells, and chloride cells. The chloride cells are the most numerous and play a key role in ionic transport(Kaneko, Watanabe, & Lee, 2008). The gills also exert immune functions through mucosal lymphoid tissue (Lumsden, Ostland, MacPhee, &Ferguson, 1995). High-throughput sequencing of theLateolabrax maculatusgills generated a total of 31,976 unigenes and identified a series of genes that are highly expressed in this tissue such as hepcidin, TLR9,and some pro-inflammatory cytokines or anti-inflammatory cytokines when compared to other tissues. These results were similar to those in previously described in the grass carp (Yang, Su, Peng, & Dong, 2011)and goldfish (Lu, Ling, Ji, Kang, & Wang, 2013). TheApolipoproteinandCD74(Invariant chain;Ii) are also highly expressed in the gills and an increasing number of studies indicated thatapolipoproteinis involved in many immune processes, including the inhibition of T cell proliferation,regulation of macrophage function, promoting lipid antigen presentation to natural killer T cells, and regulating inflammation and oxidation(van den Elzen et al., 2005; H. L.; Zhang, Wu, & Zhu, 2010). CD74 is a type II integral membrane protein that acts as a molecular chaperone for the expression of major histocompatibility complex (MHC) class II proteins. This gene mediates the assembly and trafficking of MHC class II complexes, is critical for antigen presentation, and is upregulated in certain cancers (Schroder, 2016). Keratin belongs to the intermediate filament family, and it constitutes cytoskeleton and plays an important role in maintaining the integrity and continuity of epithelial tissues(Zimek & Weber, 2005). Previous reports have shown that high keratin expression is detected in the external gills during the development ofXenopus laevisembryo, whereas the expression of keratin is drastically reduced during metamorphosis (Suzuki et al., 2010). This study indicates that keratin is the most expressed gene in the gill ofL. maculatuswhen compared to other tissues. Keratin can be used as a molecular marker for the gill. Keratin also plays a crucial role in the formation of the gill, maintenance of structure, and participation in the regulation of epithelial osmotic pressure. Betaine-homocysteine S-methyltransferase 1 is a Zn2+-dependent thiol methyltransferase, which plays an important role in the regulation of the osmotic pressure ofL. maculatusand during the adaption to changes in water salinity (Qian & Song,2011). CA enzymes catalyze the interconversion between carbon dioxide and water and the dissociated ions of carbonic acid. The most important function of this enzyme in fish is to maintain the acid-base balance in blood and other tissues and help transport carbon dioxide out of tissues (Ceyhun, Şentürk, Erdoğan, & Küfrevioğlu, 2010).
L. maculatuscan grow in both seawater and fresh water, but studies on the osmotic pressure regulation mechanism are lacking. Aquaporin is a protein that specifically transports small molecules such as water and significantly increase the permeability of the cell membrane and participate in the regulation of osmotic pressure (Agre et al., 2001). To date several genes of the aquaporin family (aqp0,aqp1,aqp3,aqp4,aqp7,aqp8,aqp9,aqp10,aqp11,aqp12, and some paralogous) have been successfully cloned in teleost fish (Y. K. Kim, Lee, Kim, Kim, &Nam, 2014; Yi Kyung Kim, Watanabe, Kaneko, Do Huh, & Park, 2010;MacIver et al., 2009; Y. Zhang et al., 2018). In this study, we identified nineaqpgenes inL. maculatus(aqp1,aqp3,aqp4,aqp7,aqp8,aqp9,aqp10,aqp11, andaqp12) and Lm-aqp3 was found to be specifically expressed in the gills but genes expression varies among different teleost species. In European eel,aqp3is distributed in the gills, intestine,esophagus, and eyes (Cutler & Cramb, 2002). InOreochromis mossambicus aqp3is detected in the gills, brain, kidney, spleen, skin, and intestines (Watanabe, Kaneko, & Aida, 2005) and inTribolodon hakonensisNorthern blot analysis detected the mRNA in the gill but was not found in the brain, kidney, and intestine (Hirata et al., 2003).Aqp3gene expression is modified by water salinity and inL. maculatusit was most expressed in the gills of freshwater when compared with seawater fish and this refelects what has been also described inO. niloticus,O. mossambicus,D. labrax, andOryzias dancena, indicating thataqp3participates in osmotic regulation (Giffard-Mena et al., 2007; Y. K.; Kim et al.,2014; Watanabe et al., 2005). In summary, the study ofaqp3onL.maculatusand other fish showed that the protein function in salinity adaptation is conserved. The evolutionary and functional differences of theaqpgene family requires further investigations.
Acknowledgments
This research was supported by China Agriculture Research System(CARS-47) and Open Fund of Key Laboratory of Experimental Marine Biology, Chinese Academy of Sciences (KF2017NO2).
 Aquaculture and Fisheries2019年6期
- Aquaculture and Fisheries的其它文章
- A corpus-based approach to understanding market access in fisheries and aquaculture international business research: A systematic literature review
- Genes for sexual body size dimorphism in hybrid tilapia (Oreochromis sp. x Oreochromis mossambicus)
- Somatostatin 4 regulates growth and modulates gametogenesis in zebrafish
- A trap with light-emitting diode (LED) lights: Evaluating the effect of location and orientation of lights on the catch rate of snow crab(Chionoecetes opilio)
- Inter-individual variation in trophic history of Dosidicus gigas, as indicated by stable isotopes in eye lenses