
Somatostatin 4 regulates growth and modulates gametogenesis in zebrafish
2019-12-05 01:49ChenchaoSuiJieChenJingMaWentingZhaoAelinoCanrioRuteMartins
Aquaculture and Fisheries 2019年6期
Chenchao Sui, Jie Chen, Jing Ma, Wenting Zhao, Aelino V.M. Canário,,*,Rute S.T. Martins
a International Research Center for Marine Biosciences, Ministry of Science and Technology, Shanghai Ocean University, Shanghai, 201306, China
b Key Laboratory of Exploration and Utilization of Aquatic Genetic Resources, Ministry of Education, Shanghai Ocean University, Shanghai, 201306, China
c National Demonstration Center for Experimental Fisheries Science Education, Shanghai Ocean University, Shanghai, 201306, China
d CCMAR/CIMAR Centre of Marine Sciences, University of the Algarve, Gambelas Campus, 8005-139, Faro, Portugal
Keywords:Somatostatin 4 Gametogenesis Zebrafish Gonadotrophin Puberty
A B S T R A C T Somatostatin (SST) plays important roles in growth and development. In teleost fishes six SST encoding genes(sst1 to sst6) have been identified although few studies have addressed their function. Here we aim to determine the function of the teleost specific sst4 in the zebrafish. A CRISPR/Cas9 sst4 zebrafish mutant with loss of function (sst4-/-) was produced which grew significantly faster and was heavier at the onset of gonadal maturation than the wild type (WT). Consistent with their faster growth, liver igf1, igf2a and igf2b expression was significantly upregulated in the sst4-/- fish compared to the WT. Histological examination of the ovaries and testis indicated that sst4-/- fish had slightly delayed testicular gametogenesis compared to the WT. Significantly lower expression of igf3, amh, insl3, hsd17b3, hsd11b2, hsd20b, cyp11b and cyp17 was consistently observed in the sst4-/- testis. In contrast, the ovaries had lower expression of igf1, igf2a and cyp19a1a but increased expression of igf2b and hsd20b. The gonadotrophin beta subunits (fshb and lhb) in the brain were downregulated indicating the brain-pituitary-gonadal axis was downregulated in the sst4-/- fish and suggesting that the steroid production is compromised in the maturing gonads. In addition, analysis of sst1 and sst3 mRNA levels in sst4-/- fish suggests a dosage compensation effect of sst1 in the brain and liver. Altogether, the results from the zebrafish sst4-/- line support the idea that sst4 is involved in the regulation of igf signalling, somatic growth and reproduction since steroidogenesis and gametogenesis at pubertal onset were compromised.
1. Introduction
Somatostatin (SST) is a tetradecapeptide that was originally isolated from sheep hypothalamus and characterized as a physiological inhibitor of pituitary growth hormone (GH) secretion (Brazeau et al., 1973). In mammals, two biologically active SST peptides have been characterized, SST-14 and its NH2-terminal extension of 14 amino acids, SST-28,which arise from post-translational processing of a common precursor peptide (preprosomatostatin or PSST) (Patel, 1999). SST peptides are produced in several tissues and play important roles in coordinating growth, development and metabolism in mammals (Adriaensen, Van Nassauw, & Timmermans, 2009; Møller, Stidsen, Hartmann, & Holst,2003; Tostivint, Lihrmann, & Vaudry, 2008).
SST signalling involves several hormone variants that exert their actions through binding to seven transmembrane domain G-protein coupled somatostatin receptors (SSTRs), and trigger several intracellular signalling pathways that ultimately evoke specific biological responses (Barnett, 2003; Møller et al., 2003; Nelson & Sheridan, 2006;Patel, 1999). In mammals, the SST family is composed of a single SST encoding gene and a SST-like gene (cortistatin or CST) that mediate their action when they bind with high affinity to the four SSTRs(SSTR1-3 and 5) (Klein & Sheridan, 2008; Volkoffet al., 2005).
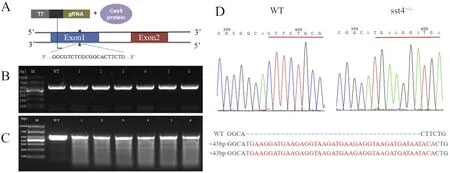
Fig. 1. CRISPR/Cas9 sst4 target and generation of F0 founders. A) structure of sst4 gene with the target sequence indicated. B, PCR verification of sst4-/- mutant DNA with specific primers. C) T7E1 enzyme verification of sst4-/- mutant PCR products. D) DNA sequences of the wild type (WT) and sst4-/- mutants; the sequences in red represent the inserted mutation. (For interpretation of the references to colour in this figure legend, the reader is referred to the Web version of this article.)
Although the biological function of SST is well documented in mammals, in teleost fish the system and its biological functions is less well established. This is complicated by the fact that the teleosts possess six SST encoding genes in their genomes (sst1, sst2, sst3, sst4, sst5, sst6)that are transcribed and have a differential tissue expression pattern(Kittilson, Moore, & Sheridan, 1999; Liu et al., 2010; Tostivint, Gaillard,Mazan, & Pezeron, 2019).
Most fish studies of SST function have focused on its conserved role in regulating growth. However, although SST is a potent inhibitor of GH secretion (synthesis and release) in the mammalian pituitary, it appears that the negative effect on growth in fish is closely linked to its negative regulation of GH post-translational processing rather than its direct effect on pituitary GH production (Canosa, Chang, & Peter, 2007).Moreover, SST also negatively impacts the GH positive effect on energy metabolism in fish, i.e. during food-deprivation SST plasma levels increase concomitant with a reduction in hepatic GH binding (Gabillard,Kamangar, & Montserrat, 2006; Gray, Young, & Bern, 1990; Norbeck,Kittilson, & Sheridan, 2007), plasma GH and insulin-like growth factor 1 (IGF1) (Cao et al., 2009; Duan, 1998), indicating energy metabolism shifts from an anabolic to a catabolic state. Likewise, administration of SST-14 reduces growth rate, food intake and plasma GH in several different species of fish (Peterson et al., 2003; Very, Knutson, Kittilson,& Sheridan, 2001; Very & Sheridan, 2002).
The latter observations suggest that SST may be a key metabolic switch and we hypothesize that it may control the diversion of energy resources from somatic growth to gonadal processes. Indeed, in some fish species, GH levels increase at the onset of sexual maturity as a result of direct stimulation of gonadotrophin-releasing hormone(GnRH) (Marchant & Peter, 1989; Melamed et al., 1995), which results in a stimulatory effect on ovarian maturation and 17β-estradiol (E2)production (Holloway & Leatherland, 1997). Conversely, E2administration enhances GH secretion (Holloway & Leatherland, 1997). Interestingly, the stimulatory effect of E2on GH levels also results in decreased SST plasma levels and blocks the SST-inhibition of GH secretion in different species (Canosa et al., 2007; Holloway et al., 2000;Holloway, Sheridan, & Leatherland, 1997). This suggests that E2increases GH levels through inhibition of SST feedback. The inverse correlation between GH and SST-14 levels in plasma is also detected during gonadal recrudescence in rainbow trout (Oncorhynchus mykiss),although there was no correlation with either E2or testosterone levels(in females and males, respectively) (Holloway et al., 2000). In summary, until now the evidence points at an indirect effect of SST-14 on reproduction.
The present study was designed to test the hypothesis that sst4 is involved in zebrafish puberty onset. The zebrafish sst4 gene encodes preprosomatostatin 2 (PSST2) and not preprosomatostatin 1 (PSST1)that yields the SST-14 peptide (Goodman et al., 1980; Hobart,Crawford, Shen, Pictet, & Rutter, 1980; Moore, Kittilson, Ehrman, &Sheridan, 1999; Plisetskaya et al., 1986) important in the differentiation of the endocrine pancreas and specification of δ-cell lineage(Biemar et al., 2001; Devos et al., 2002; Li, Korzh, & Gong, 2009).Taking into consideration the potential role of pancreatic sst4 in the regulation of glucose and energy metabolism, and the studies hinting at a role in reproduction we questioned if it might regulate partitioning of energy between somatic growth and reproduction and influence pubertal onset in the zebrafish. We tested this by developing a sst4 mutant using the CRISPR/Cas9 system and analysed the effect of loss of function on zebrafish growth and gonadal development.
2. Materials and methods
2.1. Animals
The zebrafish (Danio rerio) AB strain was used in all experimental procedures, which were in accordance with the Shanghai Ocean University Animal Ethics Regulations (IACUC20171009). The fish were maintained under 14:10 light:dark cycles, in recirculating freshwater aquaria at 26-28 °C. Fish were fed twice daily with newly hatched brine shrimp (Brine Shrimp Direct).
2.2. CRISPR/Cas9 sst4 mutant
The target site selected to induce CRISPR/Cas9 mutations (GGCGT CTCGCGGCACTTCTG) to generate the sst4 mutant line was located in exon 1 of sst4 (Fig. 1A) and was designed using the ZiFiT Targeter software (Sander et al., 2010; Sander, Zaback, Joung, Voytas, & Dobbs,2007). A set of specific primers (SST4 targetF and SST4 targetR,Table 1) was used to amplify the genomic region (GRCz11, chr2:5728668-5728843) containing the selected target site (Fig. 1A and B).The resulting 427 bp genomic fragment was inserted into a pUC19 plasmid and gRNA was produced by polymerase chain reaction (PCR)amplification of the pUC19-sst4 template (Fig. 1A) using T7-target-s Fw and T7-tracr Rev primers (Table 1) and the 2×EasyTaq PCR superMix(+dye) according to the manufacturer's instructions (Ambion). The resulting 474 bp target amplicon was purified, denatured, re-annealed and treated with T7E1 enzyme for 80 min at 37 °C, followed by a15 min incubation at 37 °C with Turbo DNase. The target amplicon was analysed by agarose gel electrophoresis (Fig. 1B) and purified using a LiCl purification step. To create CRISPR/Cas9 mutants, 100 pg gRNA and 400 pg Cas9RNA were co-injected into zebrafish eggs at the one cell stage; wild type (WT) control eggs received no injection. The embryos were incubated at 28 °C until hatching. Founder fish carrying the sst4 mutation were identified using PCR screening and sequencing of genomic DNA isolated from the tail fin of microinjected fish (Fig. 1C)and mutants were backcrossed with the WT. The F1 offspring carrying a 43 bp DNA insertion were selected to generate the F2 generation of fish(Fig. 1D). Subsequently, male and female fish that had the same frame shift mutations were crossed to produce WT, sst4+/-and sst4-/-F2 individuals, which were raised together to avoid tank effects. Three days before sampling to determine morphometry or to collect tissues fish were genotyped and separated into groups according to genotype.Fish were anesthetized with MS222 solution (150 mg/l) before sampling.
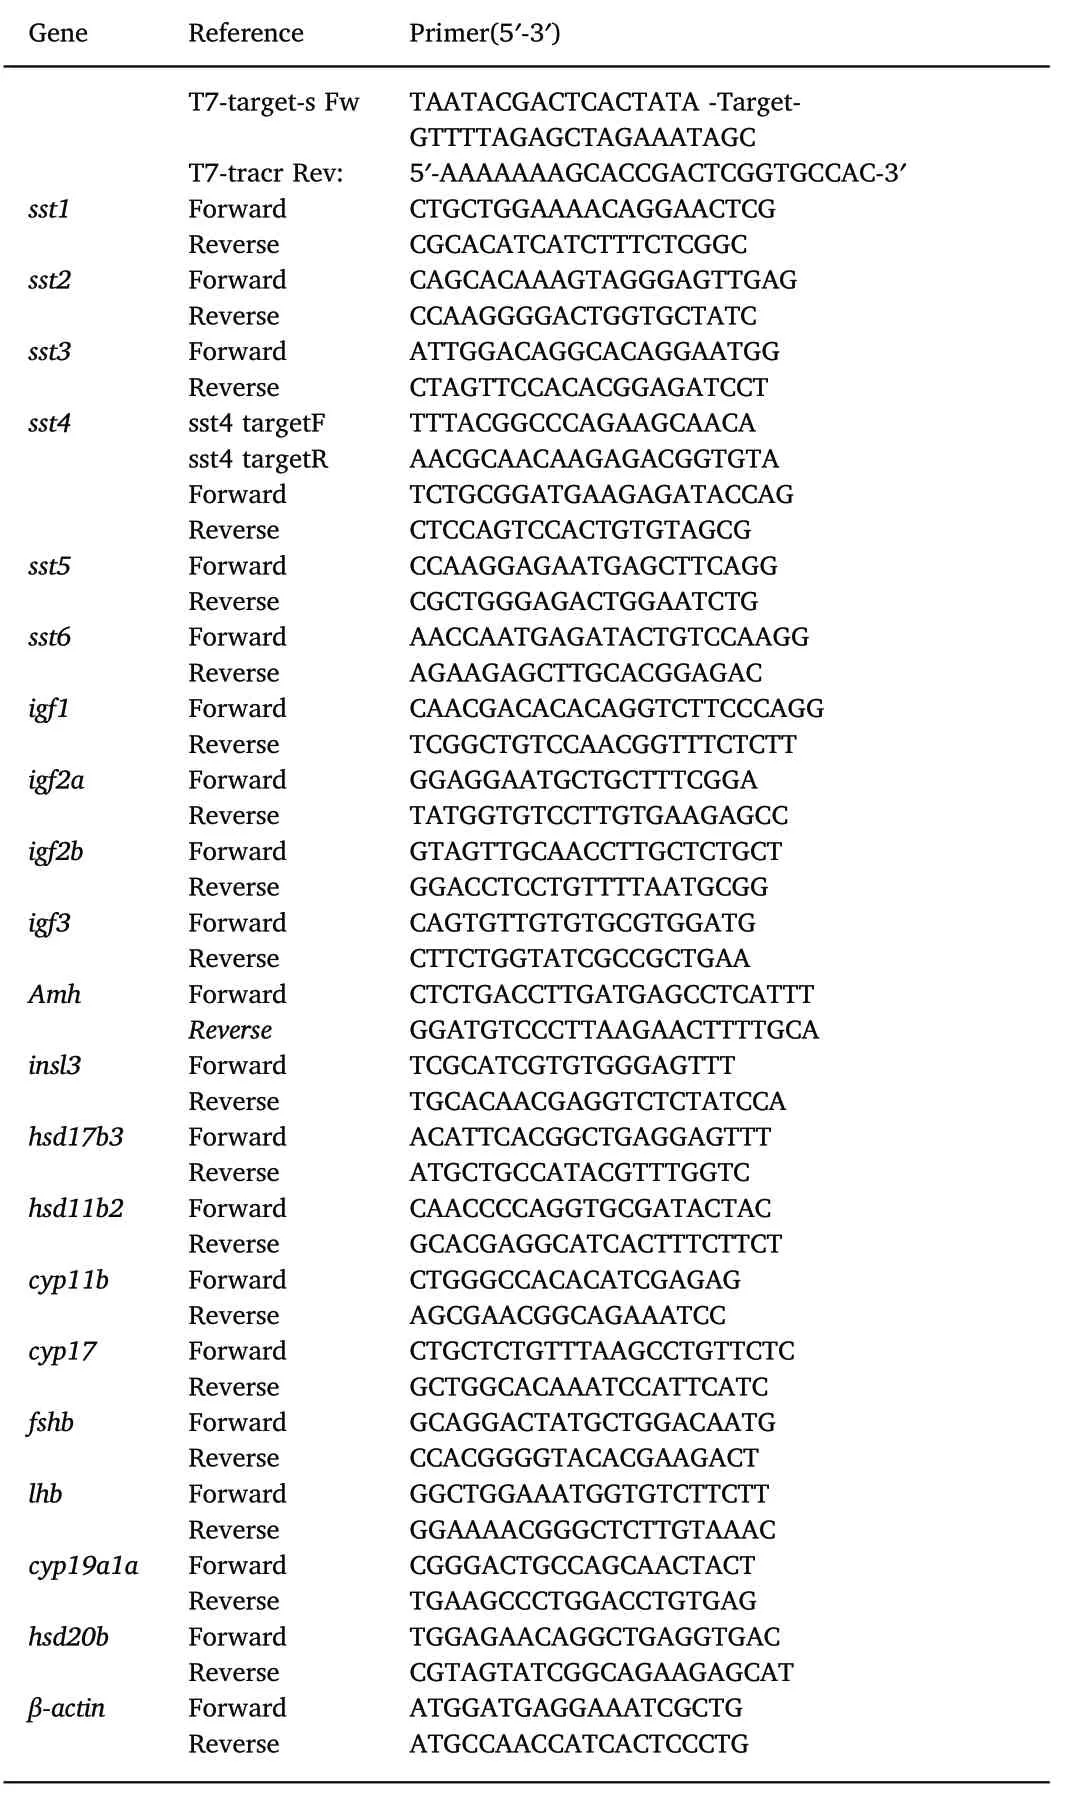
Table 1 Primers used in this study.
2.3. Nucleic acid extraction and quantification
Tail fins were used to isolate genomic DNA for genotyping. The tail fins were lysed in 50 μl of 50 mM NaOH at 95 °C for 20 min. After cooling to room temperature, 5 μl of 1M Tris (pH8.0) was added and the solution was centrifuged for 5 min. The supernatant was stored at-70 °C until used for PCR and sequencing.
Total RNA was isolated from whole fish (25-60 dpf) or from isolated tissue, brain, eye, gill, liver, heart, intestine, testis, ovary, kidney, skin,and muscle (90 dpf), in each case 3 pools of 3 individuals each, each pool from different sibling offspring, using TRIzol reagent according to the manufacturer's instructions (Ambion). The quantity and purity of the RNA was determined using a NanoDrop 2000C Spectrophotometer(Thermofisher). cDNA (20 μl) was produced from 1 μg RNA using a PrimeScript™RT reagent Kit with gDNA Eraser. Amplification of target genes (for primer sequences see Table 1) was carried out by reverse transcription quantitative PCR (RT-qPCR) on a Thermal Cycler 9600(PerkinElmer). The RT-qPCR was carried out with triplicate reactions of each sample (50 ng cDNA) and the gene specific primers using SYBR I chemistry and following the manufacturer's instructions (Life technologies). The thermocycle utilised was: an initial denaturing step at 95 °C for 3 min, followed by 40 cycles of 95 °C for 10s and 60 °C for 60 s. The primer pairs were tested for efficiency and all were ≥98% and had single peak amplification signals. Serially diluted standards containing the target gene were included in each plate as well as negative controls(i.e. RT-qPCR reaction with no cDNA and a cDNA reaction with no reverse transcriptase) to confirm samples did not contain genomic contamination and no PCR contamination occurred. β-Actin was used as the reference gene (Table 1). Quantification of relative gene expression was done using the double delta CT method (Livak & Schmittgen,2001).
2.4. Histology
Dissected gonads from the WT and sst4-/-groups (n = 5) at 45 and 55 dpf were fixed in Bouin's solution overnight and were then dehydrated by passing them through an increasing gradient of ethanol(75-100%), xylene (100%) before embedding in low melting point paraffin wax (58 °C). Serial paraffin sections (5 μm) of the wax embedded gonads were mounted on glass slides. For staining, paraffin wax was removed from the gonad sections by immersion in xylene (100%)and the sections were then rehydrated by passing them through a decreasing ethanol series (70%-0%) before washing them with deionized water. The sections were stained with haematoxylin and eosin (H&E),mounted in glycerine gelatine an covered with a glass coverslip and observed with an OLYMPUS BX53 microscope.
2.5. Statistics
Data is expressed as mean ± standard error of the mean (SEM).One-way ANOVA was used to test differences between WT and sst4-/-fish. The level of significance was 5%.
3. Results
3.1. Tissue and developmental expression of sst1, sst3 and sst4 tr anscripts
The transcript abundance of sst1, sst3 and sst4 were analysed in the eye, gill, brain, heart, liver, intestine, testis, ovary, kidney, skin and muscle of adult WT zebrafish (Fig. 2A-C). sst1 and sst3 had a similar expression pattern and gene transcripts were mainly expressed in the brain and liver. Transcripts of sst4 were mainly identified in the liver(which contains the pancreatic cells or Brockman bodies) and was not expressed in the brain (Fig. 2C).
The transcript abundance of sst1, sst3 and sst4 were analysed in whole zebrafish from 25 dpf to 60 dpf to examine their pattern of regulation around the period of pubertal onset (45 dpf). The transcript abundance of the three genes was very low at 25 dpf but at 50 dpf there was a significant up-regulation (P <0.05) in the relative abundance of all genes (Fig. 2D-F) with sst4 showing the most pronounced increase in expression (Fig. 2F).
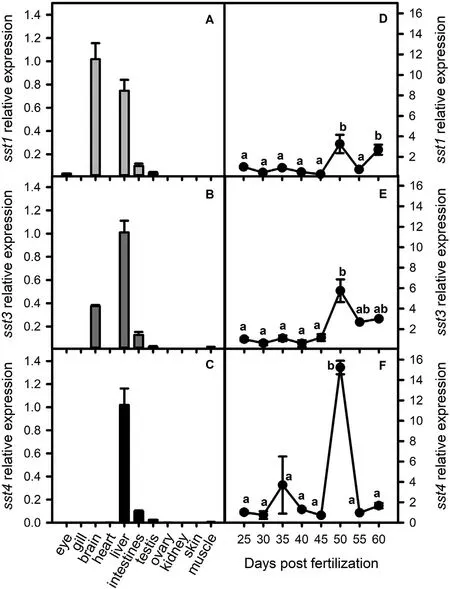
Fig. 2. Expression of somatostatin genes in adult zebrafish tissues and in whole fish during development up to puberty (25-60 dpf) analysed by RT-qPCR. βactin was used as the reference gene. The transcript levels (mean ± SEM) of sst1 (A, D), sst3 (B, E) and sst4 (C, F) are expressed in fold change relative to the highest tissue expression (A-C) or to day 25 (D-F). Each tissue or time point represents 3 pools of 3 fish each. Different letters denote significant statistical difference (P <0.05).
3.2. Analysis of sst4-/- mutant phenotypes
During the period of puberty onset, between 45 and 55 dpf, sst4-/-mutants grew 25% larger and heavier (Fig. 3) than their WT counterparts.
Liver igf1, igf2a and igf2b mRNA levels of 50 dpf sst4-/-mutants were at least 10-fold higher than the WT zebrafish (Fig. 4). To determine whether there was compensatory expression by other sst genes in the sst4-/-mutants, the levels of sst1 and sst3 mRNA were analysed in brain, liver, ovary and testis (Fig. 5a-b). Dosage compensation in sst4-/-fish appeared to occur via sst1 in the brain where it was strongly upregulated and to a lesser extent in the liver and testis(Fig. 5). In the sst4-/-mutants the sst1 in the ovary was significantly downregulated. Interestingly, sst3 mRNA levels in brain, liver, ovary and testis were significantly downregulated (P <0.05) in sst4-/-mutants (Fig. 5).
Histological examination of the ovaries of WT and sst4-/-mutant fish did not reveal any evident differences in morphology. At 50 dpf, the ovaries contained many primary growth stage follicles and a few oocytes at the cortical alveoli stage (Fig. 6A). At 55 dpf, ovaries of both WT and sst4-/-fish already contained many yolk stage oocytes(Fig. 6B). However, at 55 dpf the ovaries of sst4-/-fish expressed significantly higher (p <0.05) igf2b and hsd20b mRNA levels while the WT zebrafish expressed significantly higher (P <0.05) igf1, igf2a and cyp19a1a mRNA levels (Fig. 6C). No differences in ifg3 mRNA levels were detected between the ovaries the WT and sst4-/-fish.
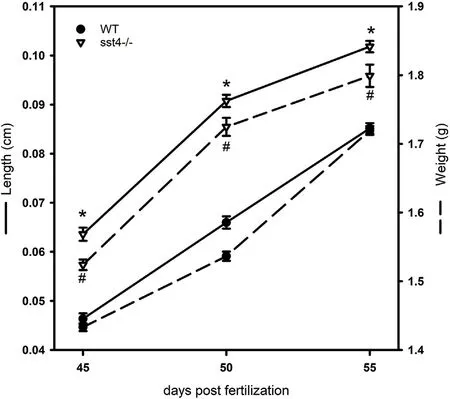
Fig. 3. Length and weight of wild type (WT) and sst4-/- zebrafish near the time of puberty. WT and sst4-/- fish were grown together as mixed groups from 3 independent crossings. Each point represents 20 fish per group.Significant statistical difference (pP <0.05) between WT and sst4-/- at each time point are indicated by * (length) and # (weight).
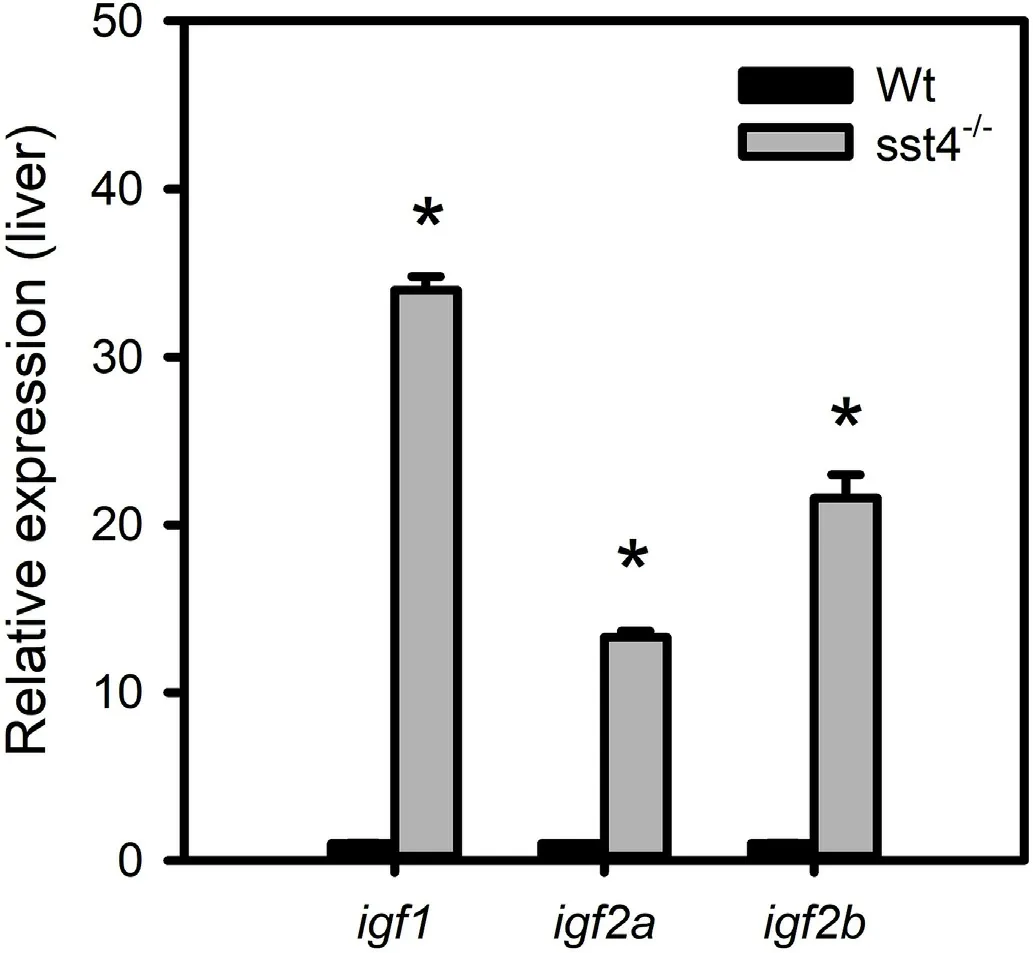
Fig. 4. Effect of sst4 loss of function on the expression of igf genes analysed by RT-qPCR at 55 dpf. β-actin was used as reference gene. The transcript levels(mean ± SEM) of igf1, igf2a, igf2b in the liver are expressed in fold change relative to the wild type (WT). Each tissue or time point represents 3 pools of 3 fish each. Significant statistical difference (P <0.05) between sst4-/- and WT are indicated by *.
Histological examination of testis at 50 dpf revealed that spermatogonia and spermatocyte were more abundant at this stage in both the WT and sst4-/-zebrafish, and only a few clusters of spermatids were evident (Fig. 7A). At 55 dpf, spermatozoa were present in the testis of WT and sst4-/-fish, but from visual inspection they seemed to be more abundant in WT zebrafish (Fig. 7B). No differences in expression of testicular igf1 or ifg2b were found between WT and sst4-/-fish(Fig. 7C). However, sst4-/-had a significantly reduced (P <0.05)expression of igf3, amh, insl3, hsd17b3, hsd11b2, cyp11b and cyp17 and a significantly increased (P <0.05) expression of ifg2b compared to the WT zebrafish (Fig. 7C).
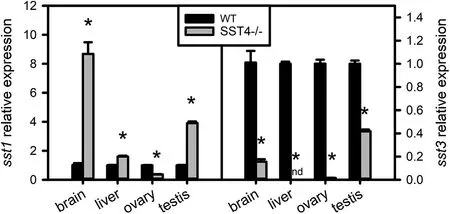
Fig. 5. Effect of sst4 loss of function on the expression of sst1 and sst3 analysed by RT-qPCR at 55 dpf. β-actin was used as the reference gene. The transcript levels (mean ± SEM) of sst1 and sst3 analysed in the brain, liver, ovary and testis are expressed in fold change relative to the wild type (WT). Each bar represents 3 pools of 3 fish each. Significant statistical difference (P <0.05) between sst4-/- and WT are indicated by *. nd indicates not detected.
To investigate a possible link between the changes in the gonad morphology and gonadotrophins, fshb and lhb gene expression was analysed in brain samples. Both genes were significantly downregulated(P <0.05) in sst4-/-fish suggesting gonadotrophin insufficiency(Fig. 8).
4. Discussion
This study shows that loss of sst4 stimulates growth and delays reproductive function, particularly in males. Growth stimulation in sst4-/-zebrafish appears to be the result of the overexpression of igf genes in the liver and their paracrine growth promoting effect (Duan, Ren, &Gao, 2010). At the onset of puberty, gametogenesis proceeds in males and females, albeit at an apparently slower pace in sst4-/-zebrafish,particularly in males, possibly because the pattern of gene expression suggests that steroid production in the gonads appears to be compromised due to the downregulation of gonadotrophins and steroid enzymes genes.
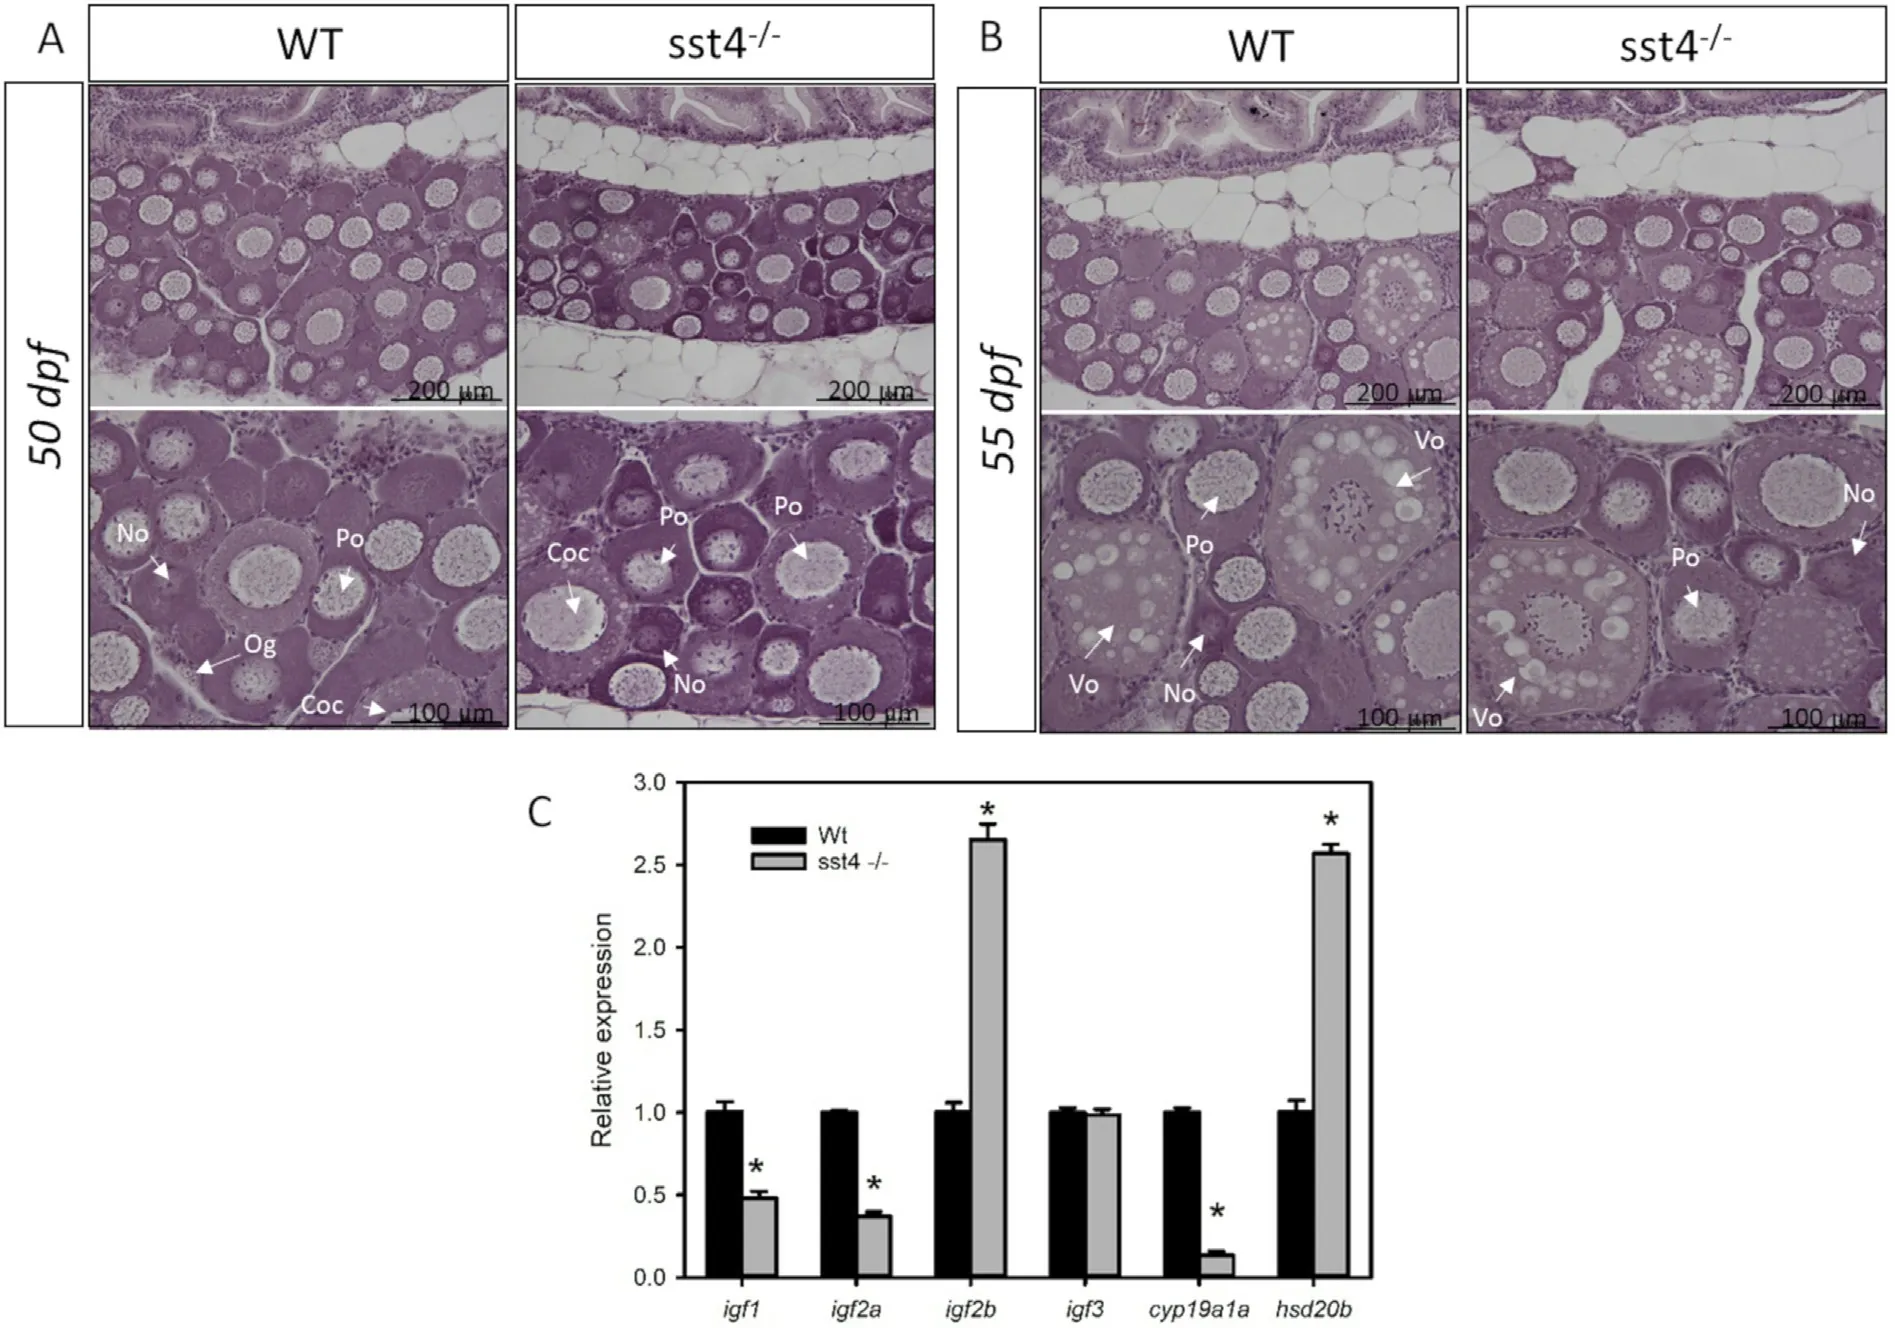
Fig. 6. Effect of sst4 loss of function on the ovaries of zebrafish. Ovary histology of wild type (WT) and sst4-/- mutant ovaries at 50 dpf (A) and 55 dpf (B).Magnification is indicated by the scale bars and the lower panel contains amplified sections of the upper panel. Og - oogonia, No - newly formed oocytes, Po - primary oocytes, Coc - cortical alveolus stage, Vo - vitelogenic stage. C) The transcript levels (mean ± SEM) of igf1, igf2a, igf2b, igf3, cyp19a1a and hsd20b are expressed in fold change relative to WT as determined by RT-qPCR at 55 dpf. β-actin was used as the reference gene. Each bar represents 3 pools of 3 fish each. Significant statistical difference (P <0.05) between sst4-/- and WT are indicated by*.
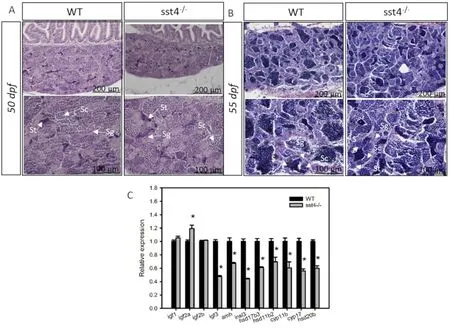
Fig. 7. Effect of sst4 loss of function in the testis of zebrafish. Testis histology of wild type (WT) and sst4-/- mutant testis at 50 dpf (A) and 55 dpf (B). Magnification is indicated by the scale bars and the lower panel contains amplified sections of the upper panel. Sg - spermatogonia, Sc - spermatocytes, St - spermatids, Sz -spermatozoa. C) The transcript levels (mean ± SEM) of igf1, igf2a, igf2b, igf3, amh, insl3, hsd17b3, hsd11b2, cyp11b and cyp17 are expressed in fold change relative to the WT as determined by RT-qPCR at 55 dpf. β-actin was used as the reference gene. Each bar represents 3 pools of 3 fish each. Significant statistical difference(P <0.05) between sst4-/- and WT are indicated by*.
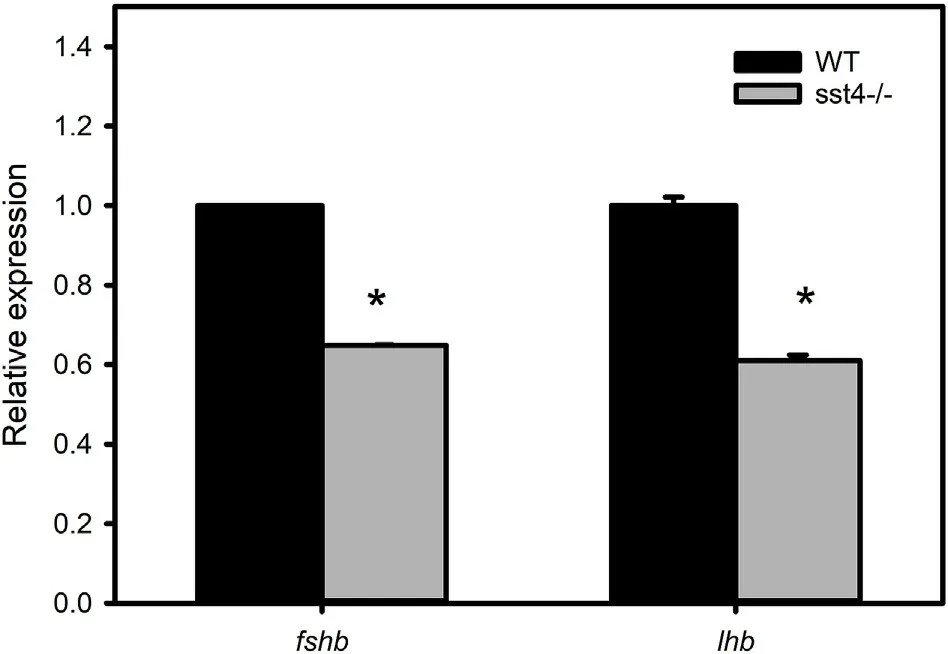
Fig. 8. Effect of sst4 loss of function on gonadotrophin gene expression analysed by RT-qPCR at 55 dpf. β-actin was used as the reference gene. The transcript levels (mean ± SEM) of fshb and lhb are expressed in fold change relative to the wild type (WT). Each bar represents 3 pools of 3 fish each. Significant statistical difference (P <0.05) between sst4-/- and WT are indicated by *.
The zebrafish sst4 gene was initially characterized as a marker of the endocrine pancreatic cells during embryonic development (Biemar et al., 2001; Devos et al., 2002). More recently, 3D live imaging of zebrafish models using fluorescent labelling of sst4 and of other pancreatic markers, revealed it was exclusively expressed in the δ-cell lineage (Li et al., 2009). Nonetheless, the regulatory role of sst4 in the zebrafish glucose and energy metabolism does not appear to be restricted to its function in pancreatic cells as high levels of this gene are also found in the liver and in the intestine of adult fish (present study and Liu et al., 2010).
Somatic growth is mainly regulated by the concerted actions of GH and liver IGFs (Reinecke et al., 2005). SST inhibition of growth is through direct inhibition of pituitary GH release and growth hormone receptor (GHR) synthesis (reviewed in Sheridan & Hagemeister, 2010)but also through inhibition of GH-stimulated igf1 transcription and secretion from the liver (Klein & Sheridan, 2008). Nonetheless, the effect of SST on liver IGF production appears to be GH-dependent as in hypophysectomised rats administration of the SST analog octreotide cannot block the body weight gain of IGF1 stimulated rats (Zapf,Gosteli-Peter, Weckbecker, Hunziker, & Reinecke, 2002). In agreement with these observations, we show that loss of sst4 function does not compromise the expression of liver igf1, igf2a and igf2b, which is significantly increased in the sst4-/-fish. Interestingly, sst4-/-fish also have significantly higher levels of sst1 in the brain. These results are consistent with observations in hypophysectomised rats (Zapf et al.,2002) that with low GH (and high SST) levels, somatic growth was not impaired if IGF levels were high. This is further corroborated by the SST-deficient mouse model in which growth rate or IGF levels were not affected by sst loss of function despite the high GH levels (Low et al.,2001). Altogether, our results seem to indicate that sst4 is a regulator of liver function and may be directly or indirectly involved in the regulation of IGF levels.
In zebrafish, there is a marked relationship between body growth/weight and pubertal development, so that pubertal development only proceeds when a critical length and weight (1.8 cm and 100 mg, respectively) is attained (Chen & Ge, 2013). Thus, zebrafish juveniles display rapid somatic growth up to 45 dpf and then slow significantly(Chen & Ge, 2013; Gomez-Requeni, Conceicao, Olderbakk Jordal, &Ronnestad, 2010), concomitant with the activation of the hypothalamopituitary-gonadal (HPG) axis (45-55 dpf, pubertal onset) and throughout gonadal maturation (up to 90 dpf) (Chen & Ge, 2013). We found that sst1, sst3 and sst4 were expressed at very low levels throughout zebrafish larval development but displayed significant upregulation around 50 dpf, consistent with the activation of the HPG axis. Considering that the fold induction of sst4 at this stage was far greater than that of other sst members and taking into consideration its involvement in regulating glucose and energy metabolism a role in pubertal onset is hypothesized.
Histological analysis of sst4-/-fish testis showed that loss of sst4 function did not prevent gametogenesis and it progressed in a similar way to the WT zebrafish. Nonetheless, the sst4-/-male fish appeared to have slightly delayed gametogenesis compared to the WT fish.Interestingly, the phenotype, although milder, resembles the gh1 CRISPR/Cas9 zebrafish mutants, which also had delayed spermatogenesis (Hu, Ai, Chen, Wong, & Ge, 2019). Thus, the mild delay in spermatogenesis in the sst4-/-mutants may be linked to downregulation of gh1 (due to the observed upregulation of sst1). Unfortunately, it was not possible to confirm downregulation of gh1, as a technical issue meant some samples were below the detection limit of the qPCR. In zebrafish, spermatogenesis progression is triggered by follicle stimulating hormone (FSHb) through stimulation of insulin growth factor 3 (igf3) in the testis (Nóbrega et al., 2015; Safian, van der Kant, Crespo, Bogerd, & Schulz, 2017) and inhibition of anti-mullërian hormone (amh), an anti-proliferative signal (Skaar et al., 2011). In concert with igf3, insl3 reinforces the FSHb stimulatory actions on the gonad to promote spermatogonial differentiation (Assis et al., 2016).The sst4-/-fish expressed significantly less fshb and lhb mRNA levels in the brain and igf3 and insl3 mRNA levels are significantly decreased.Interestingly, igf1 and igf2b were not affected and indeed, igf2a levels were significantly increased in sst4-/-. These results suggest that in the absence of FSHb-induced igf3 levels, other igf members may partially compensate and stimulate germ cell progression and differentiation in the testis. This is consistent with the results obtained with zebrafish heterozygous and homozygous mutant lines of the gonadotrophin genes fshb-/-and fshb-/-/lhb-/-(Chu, Li, Liu, & Cheng, 2015; Zhang, Zhu,& Ge, 2015) or gonadotrophin receptor genes, fshb-/-/fshr-/-, fshb-/-/lhr-/-, lhb-/-/lhr-/-, lhb-/-/fshr-/-(Xie et al., 2017), all of which had delayed spermatogenesis.
Concomitant with its stimulatory actions on germ cell progression,FSHb also stimulates steroid production in the immature gonad to promote cell proliferation and progression and further provide androgen levels to sustain the later differentiation stages of spermatogenesis (Nóbrega et al., 2015; Zapater et al., 2012). In sst4-/-zebrafish, the decrease in fsh and lhb gene transcription was accompanied by decreased expression of several steroid producing enzymes (hsd17b3,cyp17, hsd11b2, hsd20b and cyp11b1), which suggests that the delayed spermatogenesis observed in sst4-/-fish may be in part due to decreased production of androgen. Interestingly, zebrafish fsh-/-/fshr-/-have decreased androgen levels and reduced testicular transcription of steroid producing enzyme (Xie et al., 2017). Future work will be directed at characterising in more detail this trait.
From the histological analysis, the effect of loss of sst4 function in female zebrafish reproduction was not as evident as in males. This is unlike the gh1 mutant in which folliculogenesis was arrested at the primary growth stage (Hu et al., 2019). In contrast to what was found in the testis, sst4 mutation did not affect igf3 levels but significantly downregulated igf1 and igf2a and increased igf2b. The role of igfs in zebrafish folliculogenesis is well characterized: igf1 transiently increases at the primary growth stage, igf2b increases at the previtellogenic stage and is maintained throughout the development process, igf2a peaks from the early vitellogenic stage and igf3 is expressed in fully grown but immature oocytes (Li, Chu, Sun, Liu, & Cheng, 2015).The ovaries of 50-55 dpf WT and sst4-/-zebrafish contained follicles mostly at the early stage of primary growth (50 dpf) and pre-vitellogenesis (55 dpf), when igf1, igf2a and igf2b are more important for oogenesis, which could explain why igf3 levels were unaffected in the mutant. In addition, the significant increase in igf2b mRNA levels in sst4-/-zebrafish may partially compensate the decreased igf1 and igf2a levels in the gonad, as IGF2 can trigger oocyte maturation in vitro and in vivo (Li et al., 2015).
We also detected significant differences in cyp19a1a and hsd20b mRNA levels in ovaries. cyp19a1a encodes aromatase and is highly stimulated during the vitellogenic stages (Bai et al., 2016). In sst4-/-zebrafish cyp19a1a was significantly decreased suggesting vitellogenesis may be compromised at later stages. hsd20b encodes the enzyme responsible for the production of 17α,20β-dihydroxypregn-4-en-3-one and is essential for oocyte maturation and ovulation (Lessman, 2009),as well as for germ cell progression at the early stages of oocyte differentiation, and is elevated in oogonia and in primary growth follicles in different teleost species (Miura, Higashino, & Miura, 2007). The high level of hsd20b expression in sst4-/-fish may indicate a high germ cell proliferative activity (Zapater et al., 2012), possibly through activation of TGFβ (Lankford & Weber, 2008) but this was not addressed in the present study.
In summary, the present study demonstrates that sst4 is involved in the regulation of somatic growth and liver igf production. Loss of function of this growth regulator appears to be partially compensated by brain sst1. However, this does not stop the overexpression of igf genes and this may explain the larger size of sst4-/-mutants.Furthermore, loss of sst4 function slightly delayed puberty particularly in male zebrafish.
Acknowledgements
This research was supported by institutional funds from Shanghai Ocean University and Portuguese national funds from FCT - Foundation for Science and Technology through project UID/Multi/04326/2019.
 Aquaculture and Fisheries2019年6期
- Aquaculture and Fisheries的其它文章
- A corpus-based approach to understanding market access in fisheries and aquaculture international business research: A systematic literature review
- Genes for sexual body size dimorphism in hybrid tilapia (Oreochromis sp. x Oreochromis mossambicus)
- Transcriptome analysis of gill from Lateolabrax maculatus and aqp3 gene expression
- A trap with light-emitting diode (LED) lights: Evaluating the effect of location and orientation of lights on the catch rate of snow crab(Chionoecetes opilio)
- Inter-individual variation in trophic history of Dosidicus gigas, as indicated by stable isotopes in eye lenses