基于SOM和NDVI的黑土区精准管理分区对比
刘焕军,鲍依临,徐梦园,张新乐※,孟祥添,潘 越,杨昊轩,谢雅慧
基于SOM和NDVI的黑土区精准管理分区对比
刘焕军1,2,鲍依临1,徐梦园1,张新乐1※,孟祥添1,潘 越1,杨昊轩1,谢雅慧1
(1. 东北农业大学公共管理与法学院,哈尔滨 150030:2. 中国科学院东北地理与农业生态研究所,长春 130012)
根据土壤养分的空间异质性对耕地进行分区是实施变量施肥管理的关键环节,施肥的变量管理将减轻黑土区农业面源污染和土壤退化问题。该文以典型黑土区黑龙江省海伦市某合作社地块为研究对象,利用SPOT-6遥感影像提取归一化植被指数(normalized differential vegetation index, NDVI)、插值计算土壤有机质(soil organic matter,SOM),结合数字高程模型(digital elevation model,DEM),应用面向对象的分割方法,对研究地块进行分区,并应用莫兰(Morans)指数对分区结果进行评价,以期对比研究基于SOM空间插值与遥感信息的分区精度。结果表明:结合4期NDVI空间信息分区的精度最高;结合SOM、DEM、NDVI空间信息进行分区的精度次之;结合地形与SOM空间信息分区精度较低;仅根据SOM空间插值进行分区的精度最低。研究结果可为黑土区农田精准管理分区输入量的选择与多尺度分区提供思路,为实施田间精准追肥提供科学依据。
遥感;评价;空间插值;多源空间数据;精准管理分区;面向对象
0 引 言
精准管理分区是根据不同田块的空间变异性和实际需求,把一个田块分割成若干个不同均质性的子田块来调整土壤和作物的管理措施[1],分区的结果可以为精准农业的发展提供管理决策,以期最大限度地提升耕地资源潜力[2]。
目前在精准管理分区输入量主要以土壤养分为主。陈彦等利用土壤有机质(soil organic matter,SOM)、碱解氮、速效磷等数据为变量,应用空间插值法对新疆棉田进行土壤养分精确管理分区研究[3]。Davatgar等通过主成分分析(principal component analysis,PCA)提取总氮、有效磷、速效钾等土壤养分数据,插值后基于K模糊聚类法对水稻栽培区特定的管理区进行了划分[4]。以上研究,多采用实地采样方式测定数据,这种作业方法耗时耗力、成本高、时效性差;且基于单一数据源的空间划分存在精度低、应用范围受限等局限性[5]。随着遥感技术的发展,分区指标的选取也逐渐从基于土壤养分数据的空间插值过渡到利用多光谱影像进行空间信息的提取[6-7]。SOM含量在一定程度上反映了土壤肥力,是影响土壤质量的关键因素,所以土壤养分SOM的空间分布对精准分区管理具有重要的意义[8]。Schillaci等通过模拟西西里岛表层SOM含量,发现土壤中有机质含量随土地利用、降雨、侵蚀等多方面因素发生变化[9],SOM在小尺度范围内存在空间异质性与空间关联性[10]。黄魏等的分析验证了加入地形因素,进行SOM的空间插值,会使全局预测精度2提升到0.75[11]。添加地形因素提升空间信息的精度,有利于更加精准地对研究区域进行划分。此外,利用NDVI等植被信息,可以提高研究区的土壤类型的识别精度,以便于更好地归类与分析[12-14]。Burry等通过对比NDVI与增强型植被指数(enhanced vegetation index,EVI ),验证了无论是对植被敏感性分析,或是树木多样性的指标分析,NDVI都具有更强的识别能力[15]。Meera等根据NDVI的特性,明晰了NDVI在区域检测中所起到的重大意义[16],为基于NDVI进行精准管理分区提供了有力支持。但基于单期NDVI空间数据所反映的信息有限[17],考虑的影响因素不够全面,在精准分区的精度上会有所降低。通过对比试验发现,综合2期影像信息的分区结果明显优于单期的分区[18]。
以上分区研究,多基于影像数据或土壤养分,数据源单一。为了更大限度融合多源数据,提高分区的精度,本研究尝试将与分区密切相关的SOM空间数据、地形数据和遥感影像植被指数等空间数据相结合,对典型黑土区田块进行分区,并对分区结果评价,比较空间插值与遥感影像数据分区差异,以期为黑土区精准管理分区数据类型的选取提供借鉴,提高分区精度,为田间变量管理处方图与智慧农业发展提供支持。
1 材料与方法
1.1 研究区概况
研究区位于黑龙江省中部海伦市东兴农机合作社,地处松嫩平原东北端,小兴安岭西麓,平均海拔239 m,地块中心经纬度为126°55′E、47°25′N,面积约为37.6 hm2,属寒温带大陆性气候。地势从东北到西南依次呈梯形逐渐降低,地貌是由小兴安岭山地向松嫩平原的过渡地带。研究区位于典型黑土区,漫川漫岗地带,田块地形起伏较大,土壤养分和内部作物长势空间差异性显著,因而作为本次研究的对象。研究区位置及样点布置如图1,2016年以种植大豆供试。
1.2 数据源
1.2.1 遥感与地形数据的获取和预处理
订购大豆生长期2016-06-09、2016-07-19、2016-08-08、2016-09-03 4期SPOT-6遥感数据(多光谱波段的空间分辨率为6 m)。在ENVI5.1中对SPOT-6数据进行大气校正、几何校正。以上数据在Arcgis10.2中按照研究区范围进行裁剪,并提取SPOT-6 4个时期NDVI。
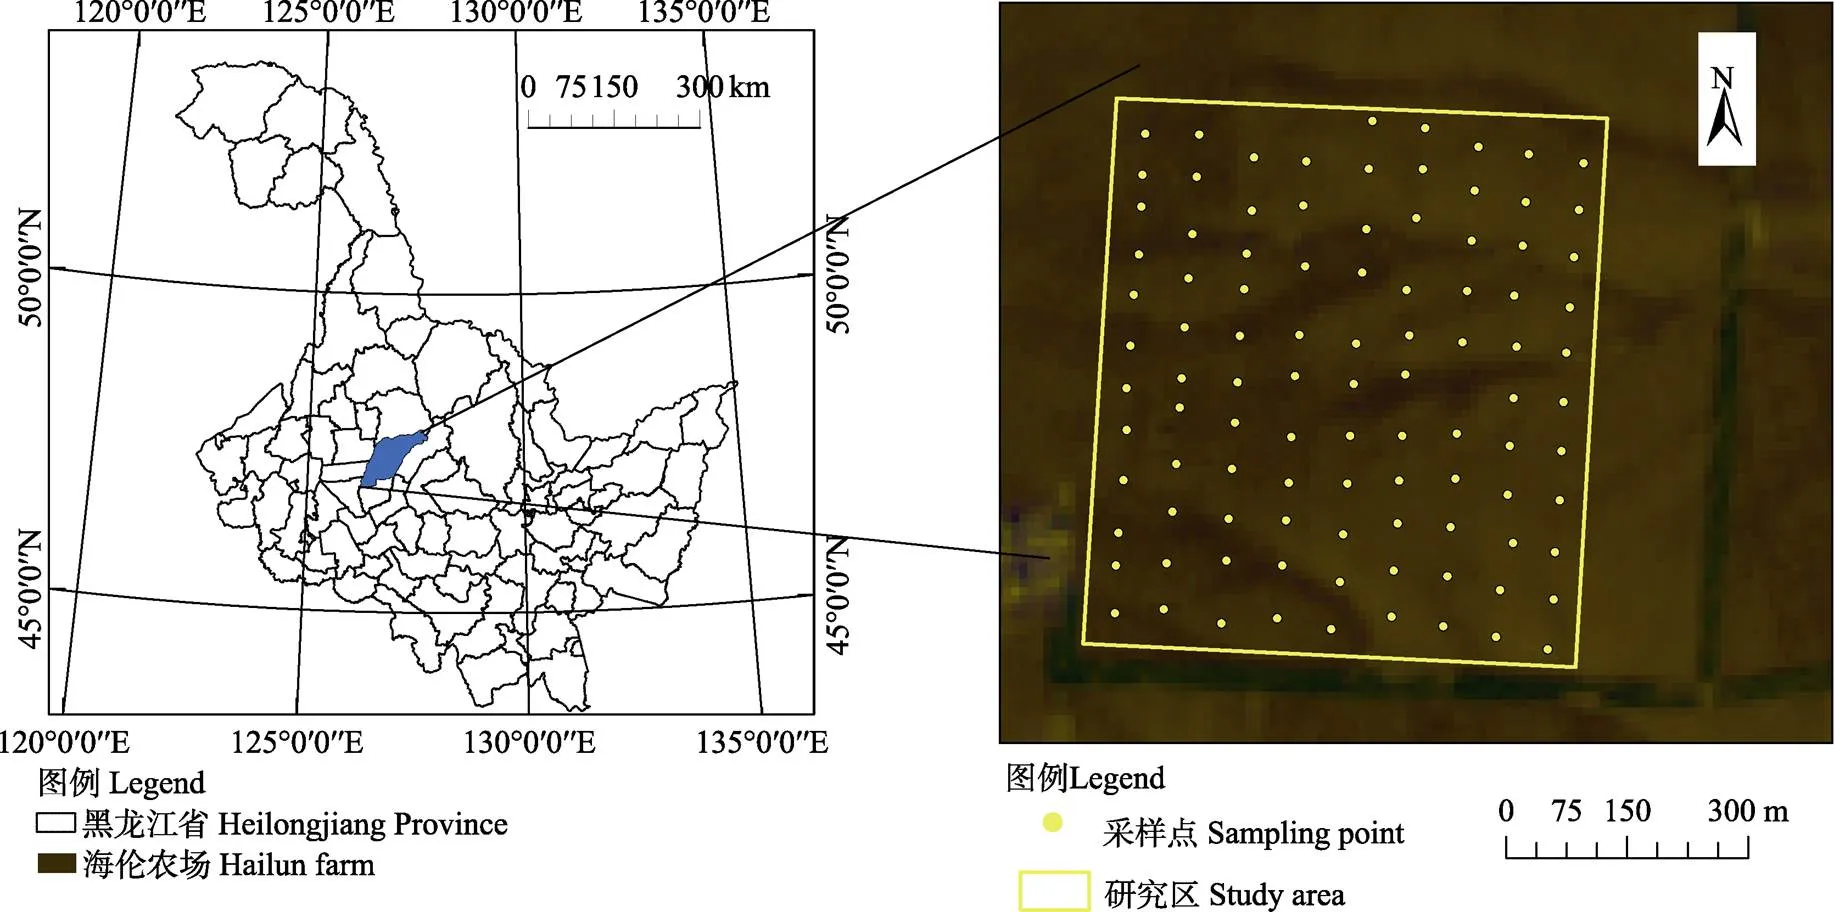
图1 研究区位置及样点布置
Fig 1 Location of study fields and sampling point distribution map
2016年5月27日,使用定位精度厘米级的海星达iRTK2对研究区地块进行实地测量,得到780个精确的坐标和高程点,利用Arcgis10.2将高程数据生成TIN图层,将TIN图层转成空间分辨率为4 m的高精度DEM栅格数据。
1.2.2 土壤养分数据的获取
2016年4月21日,运用GPS定位,依据研究区地形变化特征,平均每隔60 m预设一个采样点,共确定98个采样点,记录采样点的空间坐标,并记录各点编号。用布袋将土样带回实验室,称量样本质量后进行研磨、风干、过2 mm筛,用重铬酸钾容量法[19]测得SOM含量(表1)。

表1 土壤有机质描述统计量
1.2.3 土壤养分空间变异性分析与SOM空间土壤属性映射
根据块金值与基台值之比反映空间变异性,块金值表示随机部分的空间变异性,基台值表示整体的变异程度[20]。将通过采样获取研究区范围内98个采样点数据在地学统计软件GS+中对空间变异性进行分析,结果如表2所示。

表2 土壤有机质空间变异性分析
采用地统计学中最优内插法对空间内其他未知区域的相同属性进行计算,表达SOM含量空间分布,在Arcgis10.2中进行Kriging插值生成SOM含量的空间分布图。
1.2.4 不同空间数据标准化
由于输入量并不能用可比单位进行度量,为了将研究对象的多指标信息进行综合,需要将研究区SOM、DEM、NDVI等空间数据进行标准化处理,将变量控制在0~1之间。NDVI与生物量、叶面积指数、产量的关系密切,作为长势评价的指标经常被用于解释作物的营养情况,且在NDVI处于最大时,与产量关系最为明显[21-22],为了更好将作物信息与土壤养分信息耦合,选择大豆结荚鼓粒期NDVI(8月)空间信息进行标准化处理,并加入了地形因素以提高分区的精准度[23]。通过坐标转换构建研究的具体模型。将转换后的模型进行空间重采样,将输入数据均采样为6 m×6 m的像元大小,进行空间数据的信息综合。
1.2.5 基于像元值标准差与莫兰(Morans)指数的分区评价
NDVI在一定程度上可反映作物的产量与长势等信息。根据大豆的生长规律以及东北地区的物候特征,在7月下旬至8月初,大豆处于生长最茂盛时期,提取SPOT-6影像8月8日的NDVI去验证基于4种空间信息下的分区结果。Morans指数通常用于计算空间相关性,其值越大,空间相关性越明显[24]。
2 分割方法
2.1 最优分割尺度
基于高分辨影像探究地理对象的详细变化,建立空间对应关系,细化对比度和紧致度,可以取得更好的分割效果[25]。为比较不同分割尺度的优劣程度,定义分割对象的集合为(scale,shape,compactness),存在平均分割评价指数ASEI(average segmentation evaluation index)的最大值:

在一定尺度内平均分割评价指数达到最大时,对应的分割尺度即最优分割尺度,所对应集合(scale,shape,compactness)为最优分割尺度集合。
2.2 基于面向对象的多尺度分割


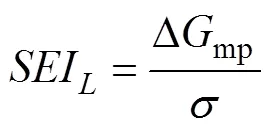
式中为某区域内像元的个数,G为第个区域的验证指标的均值,G表示区域内的验证指标均值。为该区域附近相邻区域的个数,G为第个相邻区域的验证指标均值,G表示该区域的指标均值。为当前区域边界的长度,L为当前区域与第个相邻区域公共边的长度。
定义平均分割评价指数ASEI,对研究区域内所有区块的SEI取平均值。

式中表示区域的总面积,A表示第个区域的面积,表示被划分区域的总数量,SEI表示第个区域的分割评价指数。
2.3 精准分区的评价方法
2.3.1 分区内部的同质性
依据分区内部像元值的标准差,综合考虑面积大小赋予相应的权重,判断分区内部的同质性,公式如下
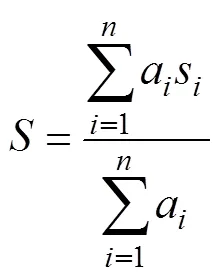
式中s是分区范围内像元值的标准差,a是分区的面积。为研究区域内分割后的分区总个数。越小,代表分区内部的空间异质性越低,即分区内部具有良好的同质性。
2.3.2 分区之间的异质性
采用Morans指数判断空间相关性,根据相关性的大小来判断分区间的异质性高低,公式如下


3 结果与分析
3.1 基于SOM空间插值的精准管理分区
通过土壤养分空间变异性分析(表2)可知,块金值与基台值的比值为0.048,说明SOM具有较强的空间自相关性,受随机因素影响小[27];SOM变程为114 m,本研究采样点间隔60 m,说明采样点间土壤养分不具有明显的空间异质性,基于该试验数据进行空间插值具有进行精准理分区的意义。
3.2 基于遥感影像的精准管理分区
如图2所示:相同或近似颜色代表一定区域内的土壤属性相同,而面向对象分割方法的分割依据则是按照样区的色彩差异进行分割[28-29],将以上不同分区结果进行分区计算,依据平均分割评价指数的大小确定最优分区尺度,对4种不同输入量的区域进行精准划分。将该尺度代入面向对象分割中得到相应分区的个数、均值、标准差,并依据上述公式计算得到平均分割评价指数。
3.3 不同输入量分区对比
从图2可以看到4种不同数据信息下的分区情况,由于输入量的差异,分区的结果在表现形式上明显不同。通过将分区结果进行对比,发现基于相同土壤养分,加入地形因素的分区结果更为规整,较未考虑地形因素的分区更易于管理与划分。基于4种空间信息的分区个数依次为55、55、48、47(见表3),从耕作单元角度出发,分区的结果符合当代耕作单元的发展进程,利于实施耕作[30]。

图2 最优尺度下的分区情况
Fig 2 Zoning at optimal scale
通过表3可知,结合地形信息的SOM空间信息的分区尺度与分区个数同基于SOM空间信息的分区一致,且个数都多于基于其他空间信息下的分区,评价分割指数是用来计算同一输入量下的最优分割结果,因此,表中数据仅用于反映某一输入量下的分割结果,并不能用于不同输入量的对比。结合分区效果来看,基于空间插值信息的分区形状更多的是与SOM空间分布有关,个数多,不规整,耕作上存在局限性。
3.4 不同输入量下分区评价
对分区结果本着各区域内部空间同质性高,分区之间异质性高为原则进行评价,即分区内像元值标准差越低、分区间Morans指数数值越低,代表分区效果越好。分区评价结果(表4)显示:基于4期NDVI空间信息的分区精度最高,无论是对分区内部或者分区间差异的评价,均具有最优的效果;基于SOM、DEM、NDVI空间信息的分区精度略低于4期NDVI的分区,但分区的结果更易实施,分区更为工整,便于操作与管理。将地形因子融入SOM空间信息后的分区精度显著提升,无论是在区域间的差异性,还是区域内部的均一性,效果均好于基于SOM空间插值分布图的分区。
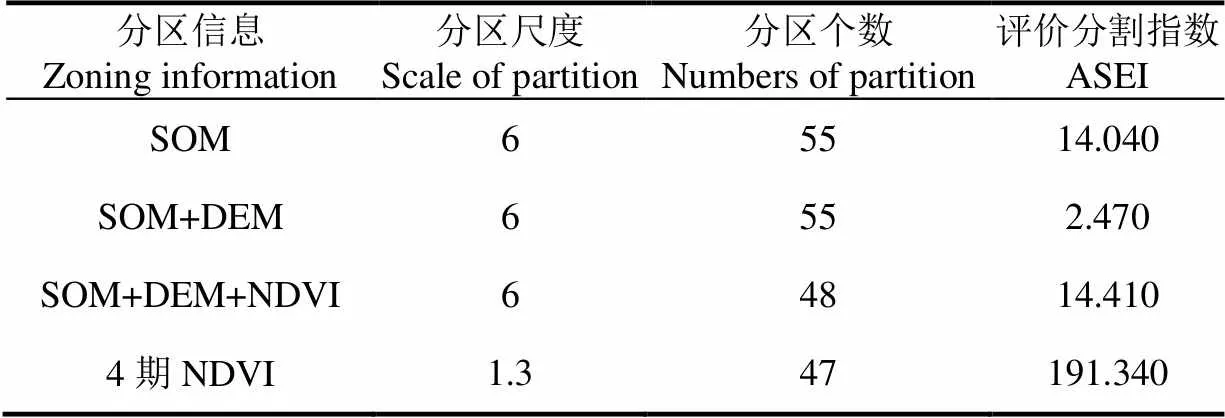
表3 4种空间数据输入量最优分割尺度、分区数、平均分割评价指数
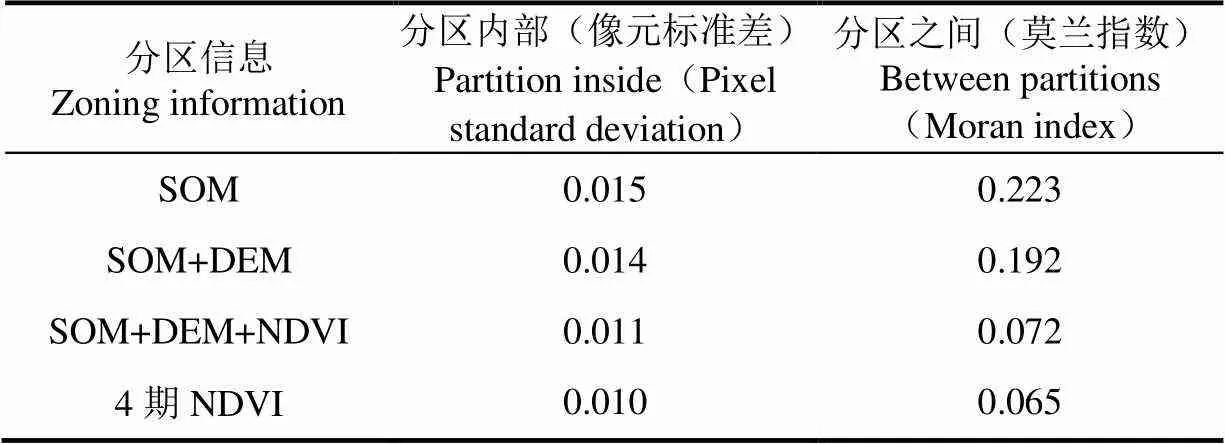
表4 基于不同分区信息的分区评价
4 讨 论
东北黑土区是中国重要的商品粮基地,由于过量施肥造成的土壤退化与耕地质量下降,对该区的精准管理分区与减肥减药的研究意义重大。研究选取了典型黑土区海伦合作社为试验地,土壤中黏粒含量丰富,保水保肥能力强;SOM较其他土壤养分而言更具有稳定性,受随机因素的影响小,由此进行的分区更具有研究意义。本文订购了4期空间分辨率为6 m的研究区SPOT影像以提取高精度的NDVI,在输入量的选取方面,分别选择了4种指标要素进行划分:SOM空间插值图,综合考虑地形因素的SOM空间分布图,综合SOM、DEM、8月NDVI信息图,4期NDVI空间分布图;从数据处理的角度而言,综合考虑多时期的NDVI信息与多源空间数据的叠加分析是本研究的特殊之处,这比基于单一数据源的划分更为精准,在本质上更具有说服力[19];同时相比于格网采样法更加省时高效[31]。在研究方法上,本文通过计算确定了最优分区尺度,消除了人为划分的纰漏给试验结果带来的影响,选择面向对象的分割手法对多种输入量进行划分,最后,运用内部标准差评价方法与Morans指数法分别对分区后子区域内部与各子区域之间的结果进行评价。经对比,综合考虑4期NDVI的空间信息进行精准管理分区精度更高。通过对比发现基于SOM、DEM、NDVI(8月)空间信息的分区较结合了地形因素的SOM空间信息更为精准,在追肥时期考虑大豆结荚期的空间信息可使分区精度有着较大提升,基于该输入量的分区操作性更强,更易于实现田块上的管理与规划;仅通过空间插值获取的SOM空间分布分区精度最低,评价结果证实了加入地形因素可提升分区精度。与以往对黑土区的研究不同[12],本研究将地形因素融入到空间信息,并结合多源空间数据进行划分。在数据的选取上,对比了基于土壤养分分区与遥感影像分区的精度,证实了遥感影像的像元大小比土壤采样间距而言具有显著优势。由于本文仅考虑了高程因素的影响,未评价其他地形因子对研究区的作用权重,因此,接下来的研究中,将综合考虑多种地形因素的作用;同时,在作物生长期的不同环节考虑更多的影响因子,如水分、温度、生物量等,从而提升分区精度仍然是研究的重点;其次,综合分析不同地区地形要素及土壤空间差异,寻求一个更具有普适性、高精度的分区方式。
5 结 论
本文以海伦市为研究区,利用6 m空间分辨率的时间序列SPOT-6影像提取归一化植被指数(NDVI),空间插值土壤有机质(SOM)空间分布特征,结合高精度数字高程模型(DEM),叠加不同空间数据进行精准管理分区,利用8月NDVI进行评价。研究结果表明:1)经对比发现,相对于传统基于空间插值的精准管理分区,基于遥感影像的划分无论是在数据获取上,还是精度上都更具有优势;2)加入了地形因素的多源空间数据分区精度较基于SOM空间插值结果进行分区精度高;3)基于多源空间数据的优势在于可以综合考虑多种因素,比单一数据的划分精准。该方法进行分区比传统格网采样分区省时省力,更加高效。通过对分区结果评价,证明了综合4期NDVI空间信息的分区精度最高;其次是基于SOM、DEM、NDVI(8月)空间信息的分区。该研究可为今后精准管理分区的数据选取提供思路,分区结果有望在黑土区田块尺度分区和管理得到推广。
[1] Aasen H, Bolten A. Multi-temporal high-resolution imaging spectroscopy with hyperspectral 2D imagers: From theory to application[J]. Remote Sensing of Environment, 2018, 205: 374-389.
[2] 满卫东,王宗明,刘明月,等. 1990-2013年东北地区耕地时空变化遥感分析[J]. 农业工程学报, 2016,32(7):1-10. Man Weidong, Wang Zongming, Liu Mingyue, et al. Spatio-temporal dynamics analysis of cropland in Northeast China during 1990-2013 based on remote sensing[J]. Transactions of the Chinese Society of Agricultural Engineering (Transactions of the CSAE), 2016, 32(7): 1-10. (in Chinese with English Abstract)
[3] 陈彦,吕新. 基于FCM的绿洲农田养分管理分区研究[J]. 中国农业科学,2008,41(7):2016-2024. Chen Yan, Lü Xin. Definition of management zones of soil nutrients based on FCM algorithm in oasis field[J].Scientia Agricultura Sinica,2008, 41(7): 2016-2024. (in Chinese with English Abstract)
[4] Davatgar N, Neishabouri M R, Sepaskhah A R. Delineation of site specific nutrient management zones for a paddy cultivated area based on soil fertility using fuzzy clustering[J]. Geoderma, 2012, 173-174(2): 111-118.
[5] Tripathi R, Nayak A K, Shahid M, et al. Delineation of soil management zones for a rice cultivated area in eastern India using fuzzy clustering[J]. Catena, 2015, 133: 128-136.
[6] Kratzer S, Therese Harvey E, Philipson P. The use of ocean color remote sensing in integrated coastal zone management: A case study from Himmerfjärden, Sweden[J]. Marine Policy, 2014, 43: 29-39.
[7] Guo Y, Wan Z, Liu D. Dynamics of dissolved organic carbon in the mires in the Sanjiang Plain, Northeast China [J]. Journal of Environmental Sciences, 2010, 22(1): 84-90.
[8] Powlson D S, Brookes P C, Whitmore A P, et al. Soil carbon sequestration to mitigate climate change: A critical re-examination to identify the true and the false[J]. European Journal of Soil Science, 2011, 62(1): 1-4.
[9] Schillaci C, Acutis M, Lombardo L, et al. Spatiotemporal topsoil organic carbon mapping of a semiarid Mediterranean region: The role of land use, soil texture, topographic indices and the influence of remote sensing data to modelling[J]. Science of the Total Environment, 2017, 601-602: 821-832.
[10] Mirzaee S, Ghorbani-Dashtaki S, Mohammadi J, et al. Spatial variability of soil organic matter using remote sensing data[J]. Catena, 2016, 145: 118-127.
[11] 黄魏,韩宗伟,罗云,等. 基于地形单元的土壤有机质空间变异研究[J]. 农业机械学报,2015,46(4):161-167. Huang Wei, Han Zongwei, Luo Yun, et al.Spatial Distribution of soil organic matter based on topographic unit[J]. Transactions of the Chinese Society for Agricultural Machinery, 2015, 46(4): 161-167. (in Chinese with English Abstract)
[12] Pang G, Wang X, Yang M. Using the NDVI to identify variations in, and responses of, vegetation to climate change on the Tibetan Plateau from 1982 to 2012[J]. Quaternary International, 2016, 444: 87-96.
[13] Tong X, Brandt M, Hiernaux P, et al. Revisiting the coupling between NDVI trends and cropland changes in the Sahel drylands: A case study in western Niger[J]. Remote Sensing of Environment, 2017, 191: 286-296.
[14] 吴才武,张月丛,夏建新. 基于地统计与遥感反演相结合的有机质预测制图研究[J]. 土壤学报,2016,53(6):1568-1575. Wu Caiwu, Zhang Yuecong, Xia Jianxin. Prediction and mapping of soil organic matter based on geostatistics and remote sensing inversion[J]. Acta Pedologica Sinica, 2016, 53(6): 1568-1575. (in Chinese with English Abstract)
[15] Burry L S, Palacio P I, Somoza M, et al. Dynamics of fire, precipitation, vegetation and NDVI in dry forest environments in NW Argentina. Contributions to environmental archaeology[J]. Journal of Archaeological Science: Reports, 2017, 18: 747-757.
[16] Gandhi G M, Parthiban S, Thummalu N, et al. NDVI: Vegetation change detection using remote sensing and gis: A case study of Vellore District[J]. Elsevier Proceedia, International Conference on Recent Trends in Computing, 2015, 57: 1199-1210.
[17] 李敏,赵庚星,蔡明庆,等. 县域棉花信息遥感提取与棉田精确化管理分区研究[J]. 自然资源学报,2012, 27(11):1971-1980. Li Min, Zhao Gengxing, Cai Mingqing, et al. Extraction of cotton information using remote sensing and precision management zoning at county scale[J].Journal of Natural Resources , 2012, 27(11): 1971-1980. (in Chinese with English Abstract)
[18] 刘焕军,邱政超,孟令华,等. 黑土区田块尺度遥感精准管理分区[J]. 遥感学报,2017,21(3):470-478. Liu Huanjun, Qiu Zhengchao, Meng Linghua, et al. Site-specific management zone of field scale based on remote sensing image in a black soil area[J]. Journal of Remote Sensing, 2017, 21(3): 470-478. (in Chinese with English Abstract)
[19] Chang D, Zhang J, Zhu L, et al. Delineation of management zones using an active canopy sensor for a tobacco field[J]. Computers and Electronics in Agriculture, 2014, 109: 172-178.
[20] 李翔,潘瑜春,马景宇,等. 基于多种土壤养分的精准管理分区方法研究[J]. 土壤学报,2007,44(1):14-20. Li Xiang, Pan Yuchun, Ma Jingyu, et al. Soil nutrients-based zoning for management of precision agriculture[J]. Acta Pedologica Sinica, 2007, 44(1): 14-20. (in Chinese with English Abstract)
[21] Tong X, Brandt M, Hiernaux P, et al. Revisiting the coupling between NDVI trends and cropland changes in the Sahel drylands: A case study in western Niger[J]. Remote Sensing of Environment, 2017, 191: 286-296.
[22] Xiaojun L, Richard F, Hengbiao Z, et al. Using an active-optical sensor to develop an optimal NDVI dynamic model for high-yield rice production (Yangtze, China)[J]. Sensors, 2017, 17(4): 672-685.
[23] Rasel S. Proxies for soil organic carbon derived from remote sensing[J]. International Journal of Applied Earth Observation&Geoinformation, 2017, 59: 157-166.
[24] 蔡进,廖和平,邱道持,等. 重庆市农村耕地资源贫困测度及空间格局研究[J]. 农业工程学报,2017,33(18):251-259. Cai Jin, Liao Heping, Qiu Daochi, et al. Study on poverty measure of farmland resources and spatial pattern in Chongqing[J]. Transactions of the Chinese Society of Agricultural Engineering (Transactions of the CSAE), 2017, 33(18): 251-259. (in Chinese with English Abstract)
[25] Zhang X, Xiao P, Feng X, et al. Separate segmentation of multi-temporal high-resolution remote sensing images for object-based change detection in urban area[J]. Remote Sensing of Environment, 2017, 201: 243-255.
[26] Eisank C, Smith M, Hillier J. Assessment of multiresolution segmentation for delimiting drumlins in digital elevation models[J]. Geomorphology, 2014, 214: 452-464.
[27] 王绍强,朱松丽,周成虎. 中国土壤土层厚度的空间变异性特征[J]. 地理研究,2001,20(2):161-169. Wang Shaoqiang, Zhu Songli, Zhou Chenghu. Characteristics of spatial variability of soil thickness in China[J]. Geographical Research, 2001, 20(2): 161-169. (in Chinese with English Abstract)
[28] Dronova I, Gong P, Wang L, et al. Mapping dynamic cover types in a large seasonally flooded wetland using extended principal component analysis and object-based classification[J]. Remote Sensing of Environment, 2015, 158: 193-206.
[29] Mao J, Jain A K. Texture classification and segmentation using multiresolution simultaneous autoregressive models[J]. Pattern Recognition, 1992, 25(2): 173-188.
[30] 李晓娅,董雪娇,徐艳. 我国耕作单元演变特征及影响因素研究[J]. 中国农业资源与区划,2016,37(5):20-26. Li Xiaoya, Dong Xuejiao, Xu Yan. Study on the evolution characteristics and influencing factors of farming unit in China[J]. Chinese Journal of Agricultural Resources and Regional Planning, 2016, 37(5): 20-26. (in Chinese with English Abstract)
[31] 白由路,金继运,杨俐苹,等. 基于GIS的土壤养分分区管理模型研究[J]. 中国农业科学,2001,34(1):1-4. Bai Youlu, Jin Jiyun, Yang Liping, et al. Research on the subarea management model of soil nutrients by GIS[J]. Scientia Agricultura Sinica, 2001, 34(1): 1-4. (in Chinese with English Abstract)
Comparison of precision management zoning methods in black soil area based on SOM and NDVI
Liu Huanjun1,2, Bao Yilin1, Xu Mengyuan1, Zhang Xinle1※, Meng Xiangtian1, Pan Yue1, Yang Haoxuan1, Xie Yahui1
(1.,150030,; 2.,130012,)
Cultivated land allocation is the key link to implement variable fertilization management. According to spatial heterogeneity, a field is divided into several sub-field blocks with different homogeneity to adjust soil and crop management measures. The explanate Machinery Cooperative of Heilongjiang Province is taken as a research object in the typical black soil area, and the SPOT-6 remote sensing images from June to September are obtained. With the support of Arcgis, crop growth can be simulated well with, such as the Normalized Difference Vegetation Index (NDVI); the soil organic matter (SOM) content is calculated according to the spatial interpolation method; and the field sample information is measured with iRTK2 and converted into the digital elevation model (DEM) raster data. Based on the spatial SOM distribution information, the SOM spatial information with the topographical factors, the spatial information of SOM with both DEM and NDVI in August, and spatial information with 4 phases of NDVI(in June, July, August, and September) are used as input. Since the inputs of this study are different from the previous single soil nutrient information, the synthesis of multiple spatial information can reflect the spatial difference of the study area in many aspects, which is more consistent with the actual influencing factors. The object-oriented segmentation method is used to divide the study area according to the principle of high homogeneity within the partition and high heterogeneity between partitions. In order to find the index elements that can better reflect the actual growth, the partition accuracy under different inputs is evaluated by two standard indicators, pixel standard deviation and Morans index, which reflect the suitability and accuracy of the partition. When the internal standard deviation of pixels is small, which proves that the soil physical and chemical properties and vegetation growth of each field are more similar to the reality; when the Morans index between the partitions is small, which shows that the differences between the partitions are large, and the spatial similarity is not obvious; which conforms to the principle of division of precise management partitions. The results show that the precision of the precise management partition based on spatial information with the 4 phases of NDVI is the highest, the internal standard deviation of the partition and the Morans index are 0.010 and 0.065, respectively. The partition accuracy for spatial information of SOM with both DEM and NDVI is the secondly, with standard deviation of 0.011 and the Morans index of 0.072 respectively. The accuracy for the SOM spatial information considering the topographical factors is relatively lower, with the internal standard deviation of 0.014 and the Morans index of 0.192. The accuracy of the partition based on only the SOM spatial information has the lowest accuracy, which internal pixel standard deviation and the Morans index are 0.015 and 0.223 respectively. Compared with the traditional spatial interpolation in precision management partition, the remote sensing image has advantages in both data acquisition and precision. In addition, the advantage of multi-source spatial data is that multiple factors can be considered comprehensively, which is more accurate than single data. This method saves a lot of time and more efficient than traditional grid sampling partitioning. The zoning results are expected to promoted field division and management in future research.
remote sensing; evaluation; spatial interpolation; multi-source spatial data; precision management partition; object-oriented
10.11975/j.issn.1002-6819.2019.13.020
S127;TP79
A
1002-6819(2019)-13-0177-07
2018-09-21
2019-06-29
国家自然科学基金(41671438);中国科学院东北地理与农业生态研究所“引进优秀人才”项目吉林省科技发展计划项目(20170301001NY)
刘焕军,黑龙江穆棱人,副教授,博士生导师,主要从事精准农业及土壤遥感。Email:huanjunliu@yeah.net
张新乐,黑龙江鸡西人,副教授,博士,主要研究方向为生态遥感。Email:xinlezhang@yeah.net
刘焕军,鲍依临,徐梦园,张新乐,孟祥添,潘 越,杨昊轩,谢雅慧.基于SOM和NDVI的黑土区精准管理分区对比 [J]. 农业工程学报,2019,35(13):177-183. doi:10.11975/j.issn.1002-6819.2019.13.020 http: //www.tcsae.org
Liu Huanjun, Bao Yilin, Xu Mengyuan, Zhang Xinle, Meng Xiangtian, Pan Yue,Yang Haoxuan, Xie Yahui.Comparison of precision management zoning methods in black soil area based on SOM and NDVI [J]. Transactions of the Chinese Society of Agricultural Engineering (Transactions of the CSAE), 2019, 35(13): 177-183. (in Chinese with English abstract) doi:10.11975/j.issn.1002-6819.2019.13.020 http://www.tcsae.org

