利用随机森林法协同SIF和反射率光谱监测小麦条锈病
竞 霞,白宗璠,高 媛,,刘良云
利用随机森林法协同SIF和反射率光谱监测小麦条锈病
竞 霞1,白宗璠1,高 媛1,2,刘良云2
(1. 西安科技大学测绘科学与技术学院,西安 710054;2. 中国科学院遥感与数字地球研究所,北京 100094)
小麦受到条锈病菌侵染后,作物的光合能力及色素含量等均会发生变化,日光诱导叶绿素荧光(solar-induced chlorophyll fluorescence,SIF)对作物光合生理的变化比较敏感,而反射率光谱则受作物生化参数的影响较大,为了提高小麦条锈病的遥感探测精度,该文利用随机森林(random forest,RF)等机器学习算法开展了协同冠层SIF和反射率微分光谱指数的小麦条锈病病情严重度的遥感探测研究。首先利用3FLD(three bands fraunhofer line discrimination)算法提取了冠层SIF数据,然后结合对小麦条锈病病情严重度敏感的11种反射率微分光谱指数分别基于RF和后向传播(back propagation,BP)神经网络算法构建了反射率微分光谱指数与冠层SIF协同的小麦条锈病病情严重度预测模型。研究结果表明:RF算法构建的小麦条锈病病情严重度预测模型优于BP神经网络算法,3个样本组中RF模型病情指数(disease index,DI)估测值与实测值间的决定系数2平均为0.92,比BP神经网络模型(2的平均值为0.83)提高了11%,均方根误差(root mean square error,RMSE)平均为0.08,比同组BP神经网络模型(RMSE的平均值为0.12)减少了33%,RF算法更适合于小麦条锈病病情严重度的遥感探测。在反射率微分光谱指数中加入冠层SIF数据后,RF模型和BP神经网络模型精度均有所改善,其中RF模型估测值与实测值间的平均2提高了4%,平均RMSE减少了22%,BP神经网络模型估测值与实测值间的平均2提高了14%,平均RMSE减少了28%,综合利用冠层SIF和反射率微分光谱指数能够改善小麦条锈病病情严重度的遥感探测精度。研究结果可为进一步实现作物健康状况大面积高精度遥感监测提供新的思路。
遥感;监测;小麦;条锈病;随机森林;日光诱导叶绿素荧光;微分光谱指数
0 引 言
小麦条锈病()是一种发生范围广,危害程度大的病害[1],在条锈病流行的年份,会导致小麦减产40%以上,甚至绝收[2]。因此,及时掌握小麦条锈病的发病状态,对中国农业生产具有重要的意义。由于遥感技术在作物病害探测中具有快速、宏观、无损等传统田间取样调查病害方法难以比拟的优势,近年来利用遥感技术探测小麦条锈病已成为众多专家学者研究的热点,并取得了丰硕的成果[3-10]。其中Shi等[5]以反射率指数为自变量,建立基于小波变换的小麦条锈病估测模型,研究结果显示该方法可以很好地预测条锈病的发病状况。刘琦等[6]以不同的光谱特征为自变量,采用定性偏最小二乘方法建立小麦条锈病潜育期识别模型,结果表明,伪吸收系数二阶导数为自变量的识别模型精度最高,训练集和检验集的识别率分别为97.89%和92.98%。蒋金豹等[9]采用冠层一阶微分数据作为自变量构建小麦条锈病估测模型,研究结果表明以红边峰值区与绿边峰值区一阶微分总和的比值为自变量建立的估测模型精度最高。
上述研究中,小麦条锈病的遥感探测主要是利用反射率光谱数据以及由反射率光谱计算的一阶微分数据。但反射率光谱主要反映生化组分的浓度信息,不能直接揭示植被光合生理状态[11-12],而冠层SIF能够更敏感地反映病害引起的生理变化[13]及受胁迫状态[14],起到植物健康状态“探针”作用[15]。张永江等[16]利用标准FLD方法预测了小麦条锈病不同病情严重度的日光诱导叶绿素荧光,证实了冠层SIF信息可以反映田间小麦条锈病的发病状况。然而小麦受条锈病菌侵染后,其水分及叶绿素含量、光合速率和光能转换率等一些生理生化指标均会发生变化[17],仅利用反射率光谱数据或冠层SIF数据难以全面客观的映射小麦条锈病害的真实状况,影响小麦条锈病的遥感探测精度。
小麦条锈病病情严重度反演算法目前使用较多的是回归分析法[6,8,18],该方法计算简单、易于实现,然而由于数据获取时外界条件的差异,基于回归分析方法建立的数学统计模型的普适性较差[19]。因此也有一些学者将神经网络和支持向量机等机器学习算法应用于小麦条锈病病情严重度的遥感探测中,并取得了较好的研究成果[20-22]。但是目前为止将具有良好抗噪能力的RF算法应用于小麦条锈病遥感监测的研究鲜见报道,尤其是基于RF算法综合利用微分光谱数据和冠层SIF数据监测小麦条锈病的研究。为此,本文融合反射率光谱在作物生化参数探测方面的优势和叶绿素荧光在光合生理诊断方面的优势,基于RF和BP神经网络2种机器学习算法构建了冠层SIF与微分光谱指数协同的小麦条锈病病情严重度预测模型,并利用保留样本交叉检验方法对模型精度进行分析与评价,以确定小麦条锈病遥感探测的适宜方法和模型,以期为提高小麦条锈病病情严重度的遥感探测精度提供一种新的思路,对其他作物病害的遥感探测提供有价值的参考。
1 材料与方法
1.1 试验设计
试验区位于河北省廊坊市中国农业科学院试验站(39°30¢40²N,116°36¢20²E),小麦品种为对条锈病比较敏感的铭贤169号。试验区小麦平均种植密度为113棵/m2。2018年4月9日采用浓度为9 mg/100 mL的孢子溶液对小麦进行条锈病接种。试验区域小麦分为健康组(编号为A、D)和染病组(编号为B、C),每个试验组的面积为220 m2。每个组分为8个样方(A1-A8、B1-B8、C1-C8、D1-D8),即健康组和染病组各16个样方。
1.2 病情指数调查与田间冠层光谱测定
1.2.1 冠层光谱测定
本试验分别于2018年5月18日、5月24日和5月30日3个时期测定小麦条锈病不同病情严重度下的冠层光谱数据,测量仪器为ASD Field Spec 4地物光谱仪,其光谱分辨率为3 nm,采样间隔1.4 nm,采样波长范围350~2 500 nm,测量时间为北京时间11∶00-12∶30,测量高度距离地面1.3 m,探头视场角25°,每个采样点观测10次并对观测结果取平均作为该采样点的光谱数据,每次测量前后均用标准BaSO4参考板对冠层辐亮度数据进行校正。
1.2.2 病情指数调查
冠层病情指数调查采用5点取样法,在每个样方内选取对称的5点,每点约1 m2,随机选取30株小麦,分别调查其发病情况。病情严重度参照国家标准“小麦条锈病测报技术规范”(GB/T 15795)[23]进行量化。单叶严重度分为9个梯度,即0、1%、10%、20%、30%、45%、60%、80%和100%的叶片病斑覆盖,分别记录各严重度的小麦叶片数,按式(1)计算不同梯度测试群体的病情指数[8,24]。
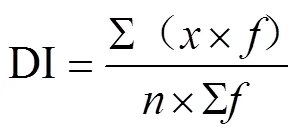
式中DI为病情指数;为各梯度级值;为最高梯度等级值;为各梯度的叶片数。
1.2.3 日光诱导叶绿素荧光的3FLD算法
目前常用的日光诱导叶绿素荧光的估测方法为基于夫琅和费暗线原理的标准FLD (fraunhofer line discrimination) 算法。该方法假设吸收线内外反射率和透过率相等,通过比较夫琅和费吸收线内外2个波段植被冠层上行辐亮度和下行辐照度光谱差异计算夫琅和费吸收线处的叶绿素荧光强度[25]。

式中I,I为夫琅和费吸收线内、外的太阳辐照度光谱强度(W/cm2/nm);L,L为夫琅和费吸收线内、外的植被冠层反射的辐亮度光谱强度 (W/cm2/nm/sr)。
标准FLD算法是基于吸收线内外反射率和透过率相等的假设估测日光诱导叶绿素荧光强度,但由于吸收线内外波段的反射率和荧光值实际上存在差异,影响了荧光的估测精度[26]。为了克服标准FLD方法局限性,Maier等[27]提出了一种改进的3FLD荧光预测算法,该算法认为在吸收线波段周围叶绿素荧光和反射率光谱是线性变化的,利用吸收线左右各一个波段的加权平均值代替标准FLD算法中的单一波段值,从而在一定程度上减小标准FLD方法中荧光和反射率恒定假设所带来的误差,提高了冠层SIF的预测精度[28],而且3FLD方法也是SIF估测的最鲁棒算法[29],基于此本文采用3FLD方法计算冠层SIF值,计算公式如式(3)~(5)所示。


为了减弱冠层光谱数据测试时不同时间段太阳光照强度等外界因素对日光诱导叶绿素荧光估算值的影响,提高日光诱导叶绿素荧光预测精度,本文将计算得到的日光诱导叶绿素荧光的绝对强度(W/cm2/nm/sr)分别除以参考板获取的夫琅和费吸收线内的太阳入射辐照度,得到该吸收线处的日光诱导叶绿素荧光的相对强度[30-31]。如式(6)所示


1.2.4 高光谱微分指数
为了快速寻找植被光谱曲线的弯曲点及最大最小反射率的波长位置等特征参量以及分解重叠的吸收波段,常常对原始光谱数据进行微分处理而得微分光谱。通过对反射率光谱进行微分处理能够增强光谱曲线在坡度上的细微变化[32],去除部分线性或接近线性的背景、噪声光谱对目标光谱的影响[33],本文结合已有的高光谱微分指数监测小麦条锈病方面的研究成果[18,34],选取的微分光谱指数如表1所示。
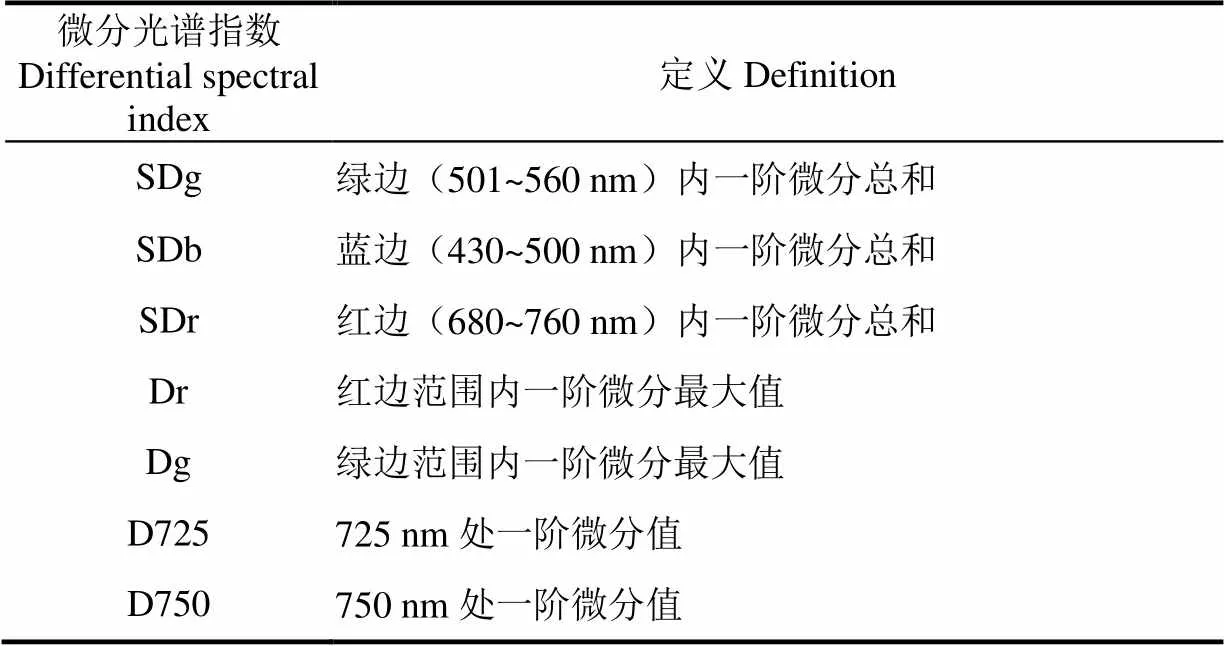
表1 微分光谱指数
由于光谱采样间隔的离散性,一阶微分光谱通常用差分方法近似计算[33]

1.3 模型构建
1.3.1 BP神经网络模型
神经网络模型中,BP神经网络是应用范围比较广泛的一种建模方法。BP神经网络模型的拓扑结构包括输入层(input)、隐含层(hide layer)和输出层(output layer),层与层之间的神经元通过相应的网络权重系数相互联系,每层内的神经元之间不连接。其核心思想是通过调整各神经元之间的权值,将误差由隐含层向输入层逐层反传,对误差函数进行“链式求导”,使误差逼近最小值[35]。本文中BP神经网络模型由输入层(对小麦条锈病敏感的各类特征参量)、隐含层和输出层(小麦条锈病病情严重度)构成。为了得到更好的网络训练效果,本文在建模前对各输入变量进行了归一化处理。
1.3.2 随机森林模型
随机森林是一种基于分类回归树的机器学习算法[36],能够将多种决策树算法结合起来,对同一现象进行重复预测[37],其基本思想是通过bootstrap重采样的方法在原始训练集中抽取多个样本,对每个抽取出的样本均进行决策树建模,最后通过多数投票法得到最终的预测结果[38]。本文中RF模型的输入变量为小麦条锈病的各个敏感因子,输出变量为小麦条锈病的病情严重度。
2 结果与分析
2.1 相关性分析
2.1.1 冠层SIF与DI的相关性分析
由于O2-A (760 nm)波段氧气吸收形成的夫琅和费暗线特征明显[39],荧光估测精度高[40]。因此本文利用测定的小麦条锈病不同病情严重度下太阳及冠层辐亮度数据通过3FLD方法计算O2-A暗线处的日光诱导叶绿素荧光相对强度,并在此基础上分析小麦条锈病病情严重度和叶绿素荧光相对强度的关系(图1)。由图1可以看出,O2-A波段处的日光诱导叶绿素荧光相对强度与小麦条锈病病情严重度达到了极显著负相关。这是由于O2-A波段的冠层SIF主要受植被吸收光合有效辐射APARchl(absorbed photosynthetic active radiation)影响[41],随着小麦条锈病病情严重度的增加,光合作用活性减弱,进而导致APARchl降低[42]和冠层SIF值减小,因此冠层SIF与小麦条锈病病情严重度之间呈现极显著负相关关系。
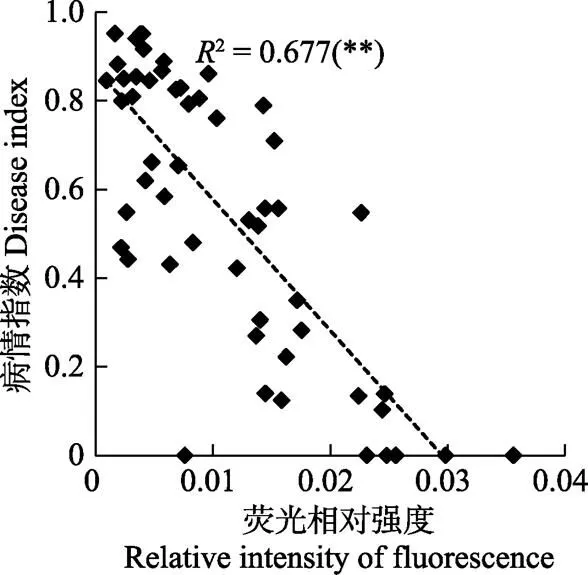
注:**表示1%水平极显著。下同
2.1.2 一阶微分光谱指数与DI的相关性分析
为了筛选对小麦条锈病病情严重度敏感的微分光谱指数,本文首先利用公式(7)对小麦条锈病不同病情严重度下的冠层光谱数据进行一阶微分处理,得到各微分光谱指数,并将其与小麦条锈病病情严重度进行相关性分析(表2)。由表2可以看出除SDg、Dg与小麦条锈病病情严重度的相关性不显著外,其他11个微分光谱指数均与小麦条锈病病情严重度达到了极显著相关,可以作为自变量构建小麦条锈病病情严重度的预测模型。
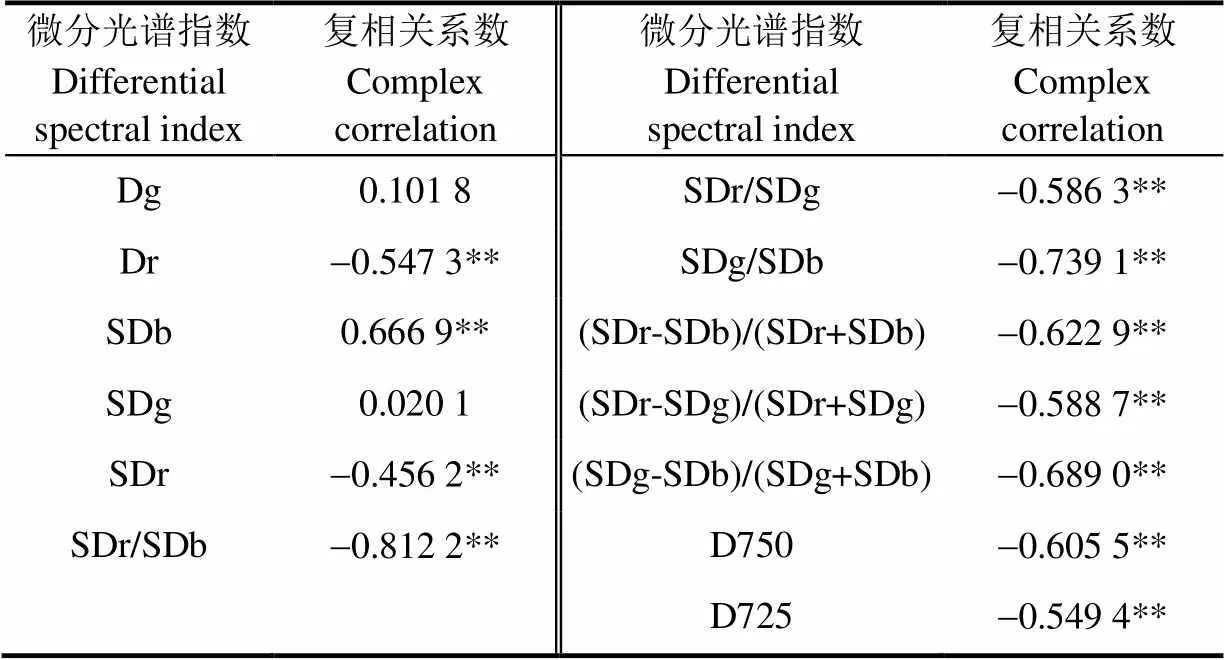
表2 DI与微分光谱指数之间的关系
2.2 模型构建与精度分析
在进行小麦条锈病病情严重度模型构建和精度评价时,为了使评价结果更客观,本文将53个样本数据(47个染病样本,6个健康样本)重复进行3次随机分组(记为a、b、c),每组中40个数据(35个染病样本,5个健康样本)作为训练样本用于模型构建,剩余的13个数据(12个染病样本,1个健康样本)作为验证样本用以模型评价。
2.2.1 病情严重度预测模型的构建
本文分别基于RF算法和BP神经网络算法构建小麦条锈病病情严重度估测模型,并对2种算法的模型精度进行评价,以确定小麦条锈病病情严重度遥感探测的适宜算法和模型。
论文通过对训练样本的多次仿真确定随机森林算法中决策树的数量(ntree)为500,内部节点随机选择属性个数(mtry)取默认值。BP算法采用3层网络标准结构,其中隐含层设置为5个神经元,最大训练次数为5 000,训练间隔为10,最小均方根误差为0.001,学习步长为0.1。
在构建小麦条锈病病情严重度预测模型时,本文分别以反射率微分光谱指数以及冠层SIF协同反射率微分光谱指数作为预测模型的输入参数,利用RF和BP神经网络算法构建了小麦条锈病病情严重度预测模型(表3)。
表3 训练集模型预测结果
Table 3 Training set model prediction result
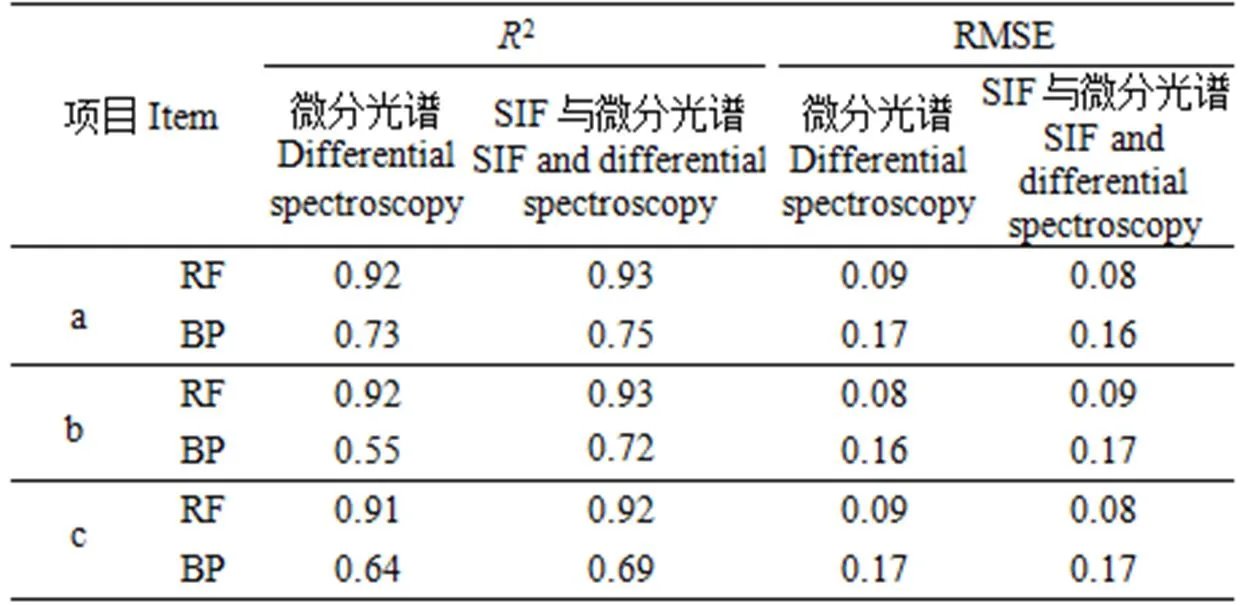
由表3可以看出,加入冠层SIF数据后,3个样本组中RF模型和BP神经网络模型DI估测精度较单一反射率微分光谱数据均有一定程度的提高。无论是以反射率微分光谱还是冠层SIF协同微分光谱作为模型的输入变量,RF模型的预测精度均高于同组BP神经网络模型,RF算法更适合于小麦条锈病病情严重度的遥感探测。
2.2.2 模型评价
为了保证评价结果的可靠性和稳定性,本文采用保留样本交叉检验方式,利用建模剩余的13个数据作为验证样本,分别对RF算法以及BP神经网络算法所构建的小麦条锈病病情严重度预测模型进行检验,结果如图2和图3所示。
由图2和图3可以看出,同时把SIF和微分光谱指数作为自变量,RF模型和BP神经网络模型的小麦条锈病病情严重度的预测精度较同组仅以微分光谱指数为自变量的模型精度都有一定的提高,其中RF模型估测DI值和实测DI值间的平均2提高了4%,平均RMSE减少了22%。BP神经网络的估测DI值与实测DI值间的平均2提高了14%,平均RMSE提高了28%,无论是微分光谱指数单独作为自变量还是SIF与微分光谱指数共同作为自变量,RF算法构建的小麦条锈病病情严重度的预测模型均优于同组BP神经网络模型,3个样本组中RF模型DI估测值与实测值间的决定系数2平均为0.92,比BP神经网络模型(2的平均值为0.83)提高了11%,RMSE平均为0.08,比同组BP神经网络模型(RMSE的平均值为0.12)减少了33%。因此RF算法构建的小麦条锈病病情严重度的预测模型优于BP神经网络模型,更适合于小麦条锈病病情严重度的遥感探测。
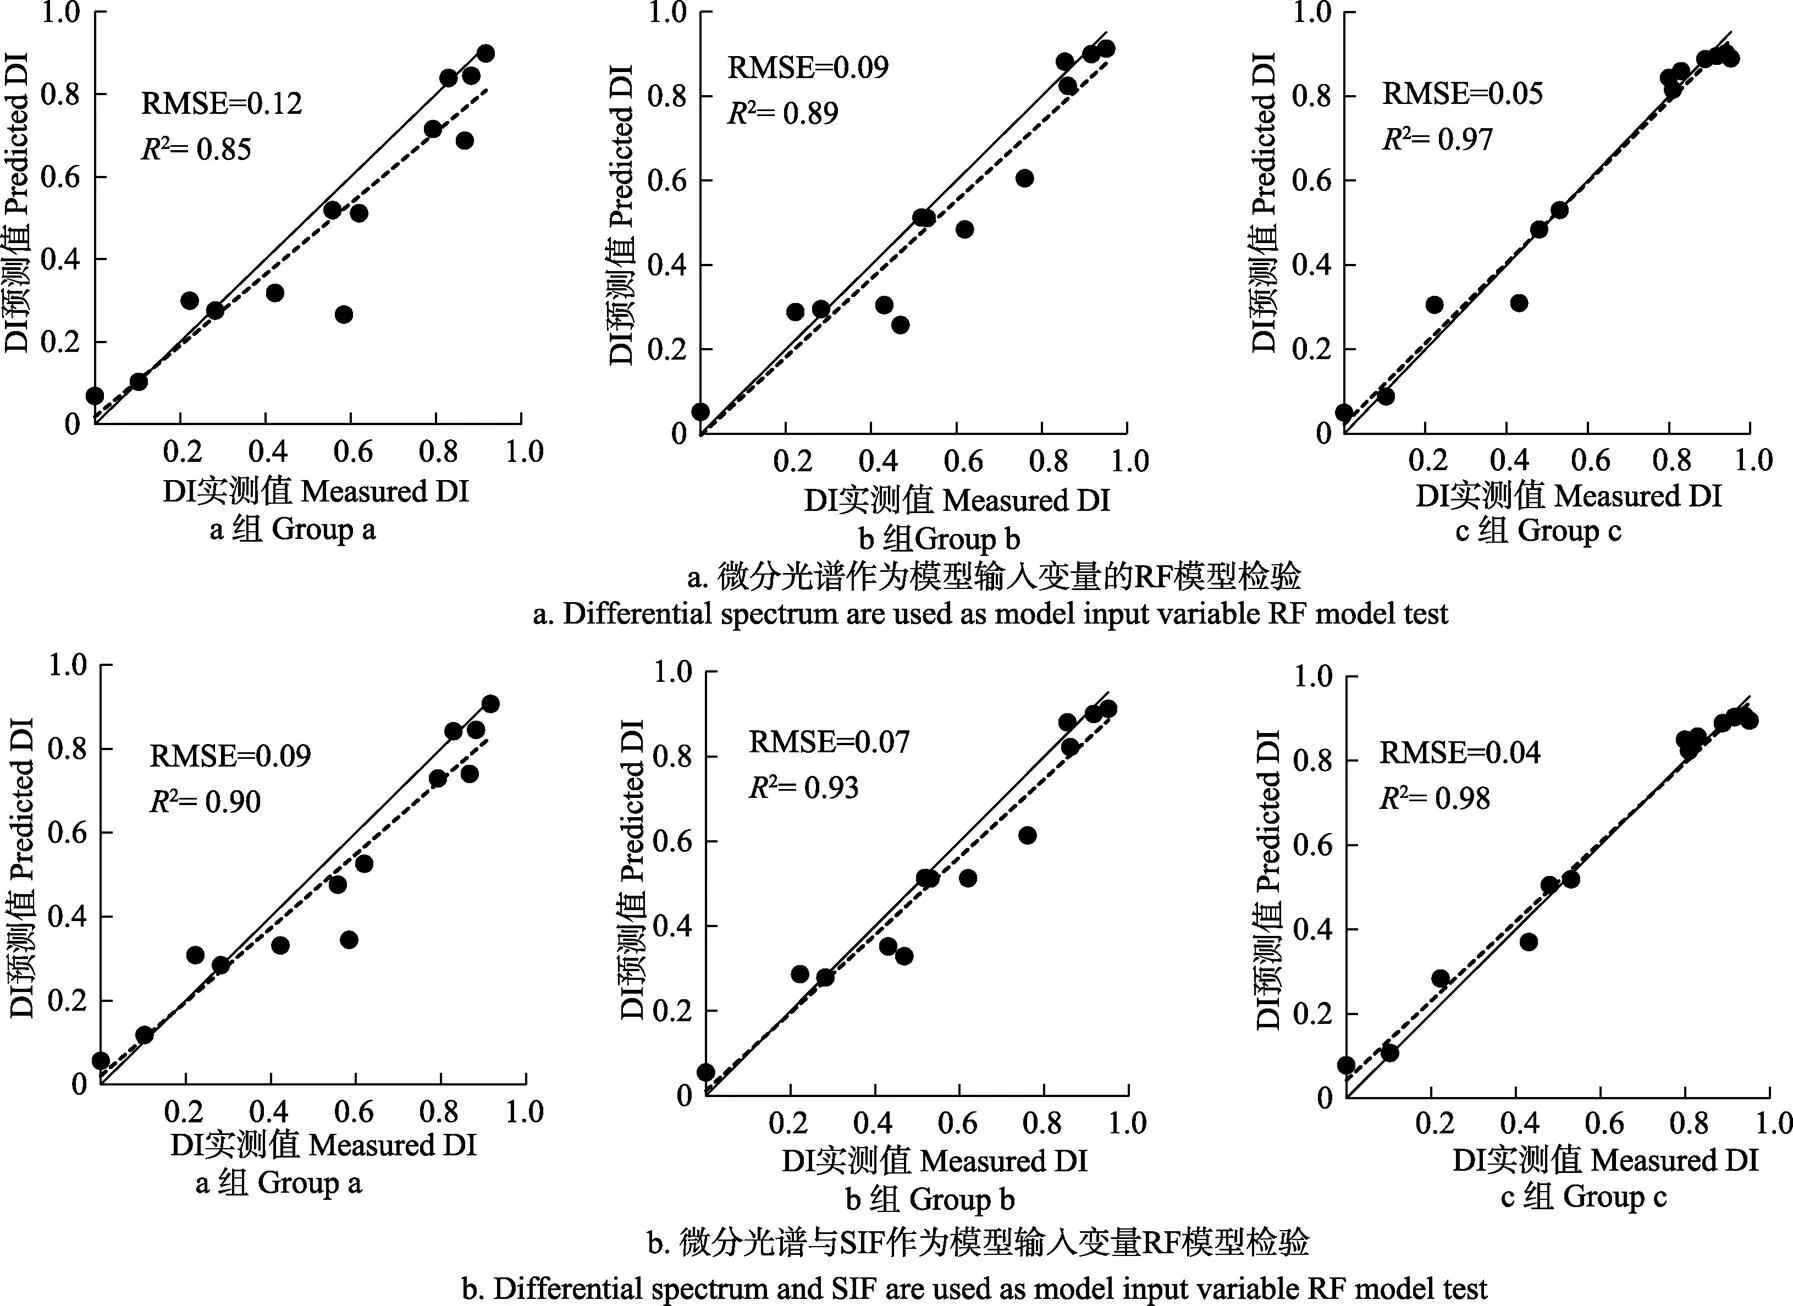
图2 小麦条锈病病情严重度RF预测模型验证
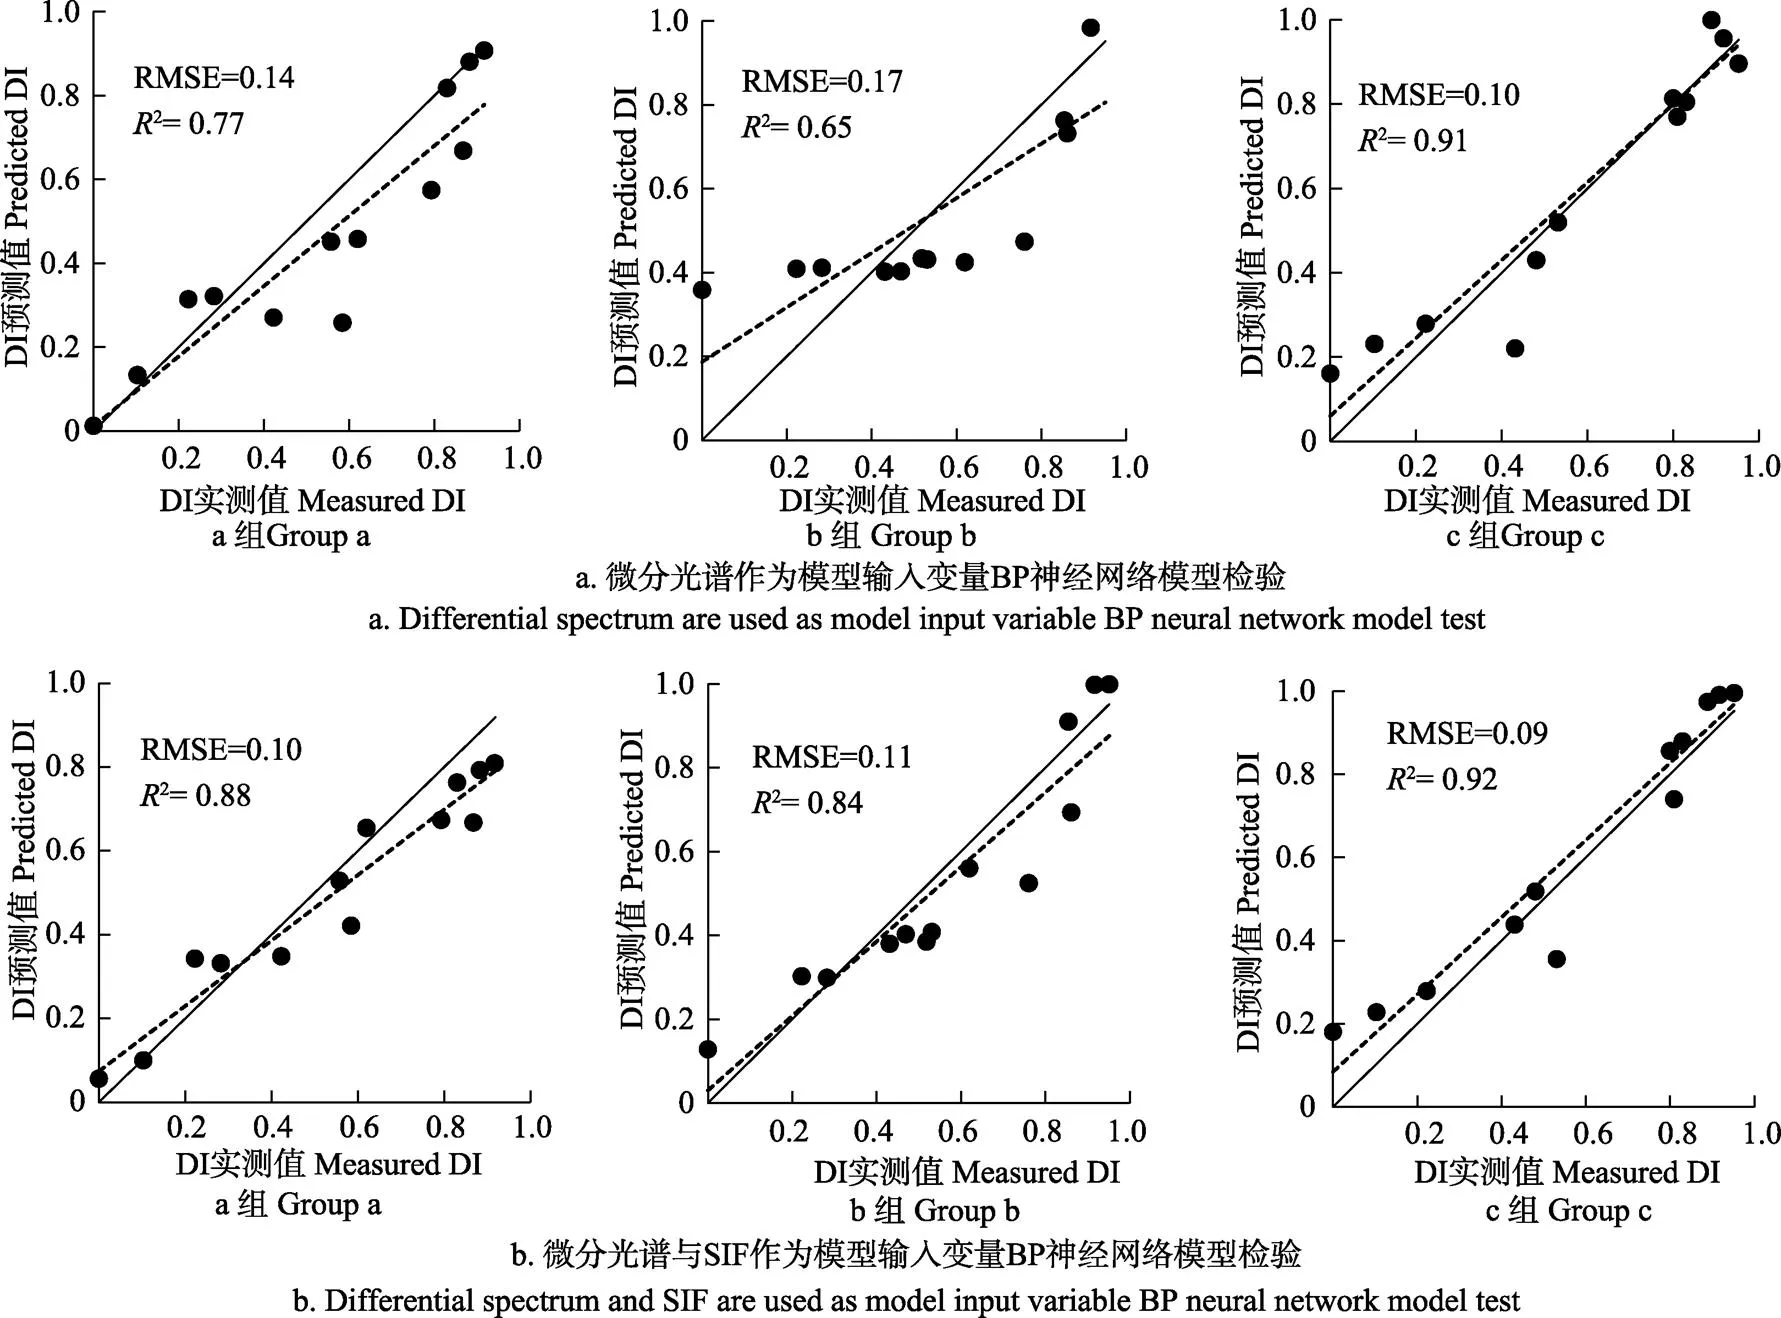
图3 小麦条锈病病情严重度BP神经网络预测模型验证
3 讨 论
冠层SIF和反射率光谱数据在小麦条锈病病情严重度的遥感探测中各有优势和局限性。反射率光谱受土壤颜色、阴影或者其它非绿色景观成分等背景噪声的影响较大[43],且对作物光合活性不敏感,但可以很好的监测作物色素含量变化[44-45],而SIF则受背景噪声的影响较小[46],对作物光合生理上的变化比较敏感,SIF和光合作用之间的直接联系能够改善植物胁迫遥感监测精度[43]。本文的研究结果也表明协同冠层SIF和反射率微分光谱指数为自变量构建的RF模型和BP神经网络模型精度均高于反射率微分光谱指数的模型精度。其中,RF模型预测DI值与实测DI值间的RMSE平均减小了22%,BP神经网络模型的RMSE平均减小了28%。与已有研究结果相比,本文综合利用冠层SIF数据和反射率微分光谱指数所建模型预测DI值与实测DI值间的RMSE分别减少了14%[9]和25%[10],加入冠层SIF数据能够提高小麦条锈病的遥感探测精度,这与陈思媛等的研究结论相一致[47]。这是因为小麦受到条锈病菌侵染后,APARchl和叶绿素含量降低,冠层SIF强度与APARchl密切相关,反射率微分光谱指数则对植物生化组分的浓度信息敏感,协同反射率微分光谱指数和日光诱导叶绿素荧光数据能够充分利用反射率光谱在作物生化参数探测方面的优势及叶绿素荧光在光合生理诊断方面的优势,从而提高小麦条锈病病情严重度的遥感估测精度。
在构建小麦条锈病病情严重度估测模型时,RF模型估测DI值与实测DI值间的2比BP神经网络模型提高了11%,RMSE减少了33%,其中,以反射率微分光谱指数为自变量构建的RF模型预测DI值和实测DI值之间2平均为0.90,RMSE平均为0.09,2比BP神经网络平均提高了17%,RMSE平均减少了36%。加入冠层SIF数据后,RF模型预测DI值和实测DI值之间2平均为0.94,RMSE平均为0.07,2比BP神经网络平均提高了6%,RMSE平均减少了30%。因此无论是否在模型特征参量中加入冠层SIF数据,RF模型预测精度都优于BP神经网络模型,这与姚雄等关于林地叶面积指数的遥感估算的研究结果相一致[19],王丽爱等在估算小麦叶绿素含量的研究中也表明RF模型的估测效果优于BP神经网路模型[48]。这主要是由于RF算法具有良好的抗噪能力,不易陷入过度拟合[37],而BP神经网络在训练过程中由于学习了过多的样本细节,学习出的模型难以体现样本内含的规律[19]。
本文将冠层SIF和微分光谱指数作为自变量构建小麦条锈病病情严重度估测模型时,没有考虑不同参数对模型贡献率的问题,如何确定各参量因子的权重并应用于模型的构建还有待继续研究。
论文在构建小麦条锈病病情严重度的遥感探测模型时,仅对比分析了RF和BP神经网络2种机器学习算法,如果使用更多的模型构建算法参与病情严重度估测精度的对比分析,RF模型是否仍是小麦条锈病遥感探测的最优模型,还需要进行进一步的探测。
本文在构建小麦条锈病病情严重度估测模型时,仅将冠层SIF和反射率微分光谱指数直接拼接作为模型的输入参量,并没有考虑不同特征参量与病情指数之间的映射关系,如何找到不同特征参量与病情指数之间的最优映射函数,针对融合后的反射率光谱-冠层SIF特征空间,利用多核学习算法建立基于特征最优核映射的小麦条锈病病情严重度的遥感探测模型则是下步要研究的问题。
4 结 论
为了提高小麦条锈病的遥感探测精度,本文综合利用反射率和冠层SIF数据在植物生理和生化探测中的优势,基于BP神经网络和RF算法开展了冠层SIF与反射率微分光谱指数协同的小麦条锈病遥感探测研究。主要结论如下:
1)反射率微分光谱指数以及冠层SIF协同反射率微分光谱指数均能实现小麦条锈病的遥感探测。但自变量中加入冠层SIF数据后,RF模型和BP神经网络模型的探测精度均有一定程度的提高,其中RF模型预测DI值和实测DI值间的RMSE平均减少了22%,BP神经网络模型的RMSE平均减小了28%。
2)无论利用反射率微分光谱指数还是冠层SIF协同反射率微分光谱指数作为自变量,RF模型的估测精度均高于BP神经网络模型,更适合小麦条锈病的探测。其中,3个样本组中RF模型的DI估测值与实测值的RMSE比同组BP神经网络模型减少了33%。以反射率微分光谱指数为自变量构建的RF模型预测DI值和实测DI值间的RMSE比BP神经网络模型平均减小了36%,加入冠层SIF数据后RF模型的RMSE比BP神经网络模型至少减少了30%。
[1] 王静,景元书,黄文江,等.冬小麦条锈病严重度不同估算方法对比研究[J]. 光谱学与光谱分析,2015,35(6):1649-1653.Wang Jing, Jing Yuanshu, Huang Wenjiang, et al. Comparative study on different estimation methods of severity of stripe rust of winter wheat[J]. Spectroscopy and Spectrum Analysis. 2015, 35(6): 1649-1653. (in Chinese with English abstract)
[2] 王利民,刘佳,杨福刚,等. 基于GF-1/WFV数据的冬小麦条锈病遥感监测[J]. 农业工程学报,2017,33(20):153-160.Wang Limin, Liu Jia, Yang Fugang, et al. Winter wheat stripe rust remote sensing monitoring based on GF-1/WFV [J]. Transactions of the Chinese Society of Agricultural Engineering (Transactions of the CSAE), 2017, 33(20): 153-160. (in Chinese with English abstract)
[3] Liang D, Liu N, Zhang D, et al. Discrimination of powdery mildew and yellow rust of winter wheat using high-resolution hyperspectra and imageries[J]. Infrared and Laster Engineering. 2017, 46(1): 1-8
[4] Zheng Q, Huang W, Cui X, et al. New spectral index for detecting wheat yellow rust using sentinel-2 multispectral imagery[J]. Sensors 2018, 868(18): 1-19
[5] Shi Y, Huang W, Gonzalez-Moreno P, et al. Wavelet-based rust spectral feature set(WRSFs):A novel spectral feature set based on continuous wavelet transformation for tracking progressive host-pathogen interaction of yellow rust on wheat [J]. Remote Sensing 2018, 252(10): 1-19
[6] 刘琦,谷医林,王翠翠,等. 基于偏最小二乘法的小麦条锈病潜育期冠层高光谱分析[J]. 植物保护学报,2018,45(1):138-145.Liu Qi, Gu Yilin, Wang Cuicui, et al. Canopy hyperspectral features analysis of latent period wheat stripe rustbased on discriminant partial least squares [J]. Journal of Plant Protection 2018, 45(1): 138-145. (in Chinese with English abstract)
[7] Hui W, Feng Q, Liu R, et al.Identification and severity determination of wheat stripe rust and wheat leaf rust based on hyperspectral data acquired using a black-paper- based measuring method[J]. Plos one. 2016, 11(4): e0154648.
[8] 鲁军景,黄文江,蒋金豹,等. 小波特征与传统光谱特征预测冬小麦条锈病病情严重度的对比研究[J]. 麦类作物学报,2015,35(10):1456-1461.Lu Junjing, Huang Wenjiang, Jiang Jinbao, et al. A comparative study on the severity of stripe rust disease in winter wheat estimated by little baud sign and traditional spectral features [J]. Journal of Wheat Crops, 2015, 35(10): 1456-1461. (in Chinese with English abstract)
[9] 蒋金豹,陈云浩,黄文江,等. 冬小麦条锈病严重度高光谱遥感反演模型研究[J]. 南京农业大学学报,2007,30(3):63-67. Jiang Jinbao, Chen Yunhao, Huang Wenjiang, et al. Study on hyperspectral remote sensing retriveralmodels about winter wheat stripe rust severity[J]. Journal of Nanjing Agricultural University. 2007, 30(3): 63-67. (in Chinese with English abstract)
[10] 陈云浩,蒋金豹,黄文江,等. 主成分分析法与植被指数经验方法估测冬小麦条锈病严重度的对比研究[J]. 光谱学与光谱分析,2009,29(8):2161-6165. Chen Yunhao, Jiang Jinbao, Huang Wenjiang, et al. Comparison of Principal Component Analysis with VI-EmpiricalApproach for Estimating Severity of Yellow Rust of Winter Wheat[J]. Spectroscopy and Spectral Analysis, 2009, 29(8): 2161-6165. (in Chinese with English abstract)
[11] McMurtrey J E, Middleton E M, Crop L A, et al. Optical reflectance and fluorescence for detecting nitrogen needs in zea mays L[C] //Geoscience and Remote Sensing Symposium, 2003. IGARSS’03.Proceedings. 2003 IEEE international. IEEE, 2003, 7: 4602-4604
[12] Ashour loo D, Mobasheri M R, Huete A. Developing two spectral disease indices for detection for wheat leaf rust ()[J]. Remote Sensing, 2014, 6(6): 4723-4740.
[13] Subhash N, Subhash N, Ravi V, et al. Detection of mosaic virus disease in cassava plants by sunlight-induced fluorescence imaging: A pilot study for proximal sensing[J]. International Journal of Remote Sensing, 2015, 36(11): 2880-2889.
[14] Liu L, Zhao J, Guan L. Tracking photosynthetic injury of Paraquat-treated crop using chlorophyll fluorescence from hyperspectral data[J]. European Journal of Remote Sensing, 2013, 46: 459-473.
[15] Krause G H, Weis E. Chlorophyll fluorescence and photosynthesis: the basics[J]. Annual Review of Plant Biology, 1991, 42(1): 313-349.
[16] 张永江,黄文江,王纪华,等. 基于Fraunhofer 线的小麦条锈病荧光遥感探测[J]. 中国农业科学,2007,40(1):78-83. Zhang Yongjiang, Huang Wenjiang, Wang Jihua, et al. Chlorophyll fluorescence sensing to detect stripe rust in wheat(L.)fields based on fraunhofer lines[J]. Scientia Agricultura Sinica, 2007, 40(1): 78-83. (in Chinese with English abstract)
[17] 刘琦,王翠翠,王睿,等. 潜育期小麦条锈菌的高光谱定性识别[J]. 植物保护学报,2018,45(1):153-160. Liu Qi, Wang Cuicui, Wang Rui, et al. Hyperspectral qualitative identification on latent period of wheat stripe rust[J]. Journal of Plant Protection, 2018, 45(1): 153-160. (in Chinese with English abstract)
[18] 蒋金豹,陈云浩,黄文江,等. 利用高光谱微分指数进行冬小麦条锈病病情的诊断研究[J]. 光学技术,2007,4(39):620-623.Jiang Jinbao, Chen Yunhao, Huang Wenjiang, et al. Diagnosis of stripe rust disease in winter wheat by using hyperspectral differential index[J]. Optics Technology, 2007, 4(39): 620-623. (in Chinese with English abstract)
[19] 姚雄,余坤勇,杨玉洁,等. 基于随机森林模型的林地叶面积指数遥感估算[J]. 农业机械学报,2017,48(5):159-166.Yao Xiong, Yu Kunyong, Yang Yujie, et al. Remote sensing estimation of woodland leaf area index based on random forest model [J]. Transactions of the Chinese Society for Agricultural Machinery, 2017, 48(5): 159-166. (in Chinese with English abstract)
[20] 胡小平,杨之为,李振岐,等. 汉中地区小麦条锈病的BP神经网络预测[J]. 西北农业学报,2000,9(3):28-31.Hu Xiaoping, Yang Zhiwei, Li Zhenqi, et al. BP neural network prediction of wheat stripe rust in hanzhong region [J]. Journal of Northwest Agriculture, 2000, 9(3): 28-31. (in Chinese with English abstract)
[21] L Mo. Prediction of wheat stripe rust using neural network[C]. IEEE International conference on intelligent computing & intelligent systems. 2010, 3: 475-479.
[22] Wang H, Ma Z. Prediction of wheat stripe based on support vector machine[C]. International conference on natural computation. 2011, 1: 378-382.
[23] 中华人民共和国国家质量监督检验检疫总局中国国家标准化管理委员会. GB/T 15795-2011小麦条锈病测报技术规范[S]北京:中国标准出版社,2011-11-19.
[24] 王纪华,赵春江,黄文江.农业定量遥感基础与应用[M]. 北京:科学出版社,2008.
[25] Plascyk K A, Gabriel F C. The Fraunhofer line discriminator MKII-an airborne instrument for precise and standardized ecological luminescence measurement[J]. IEEE Transactions on Instrumentation and Measurement. 1975, 24(4): 306-313.
[26] 刘良云.植被定量遥感原理与应用[M].北京:科学出版社,2014.
[27] Maier S W, Günther K P, Stellmes M. Sun-induced fluorescence: A new tools for precision farming[M]// Mcdonald M, Schepers J, Tartly L, et al. Digital imaging and spectral techniques: Aplications to precision agriculture and crop physiology. Madison, WI, USA: American Society of Agronomy Special Publication, 2003: 209-222.
[28] 刘新杰.日光诱导叶绿素荧光的遥感反演研究[D]. 北京:中国科学院大学,2016. Liu Xinjie. Study of Sun-Induced Cholorophy Retrieval Using Remote Sensing Methods[D]. Beijing: University of Chinese Academy of Sciences, 2016. (in Chinese with English abstract)
[29] Liu X, Liu L. Improving chlorophyll fluorescence retrieval using reflectance reconstruction based on principal components analysis[J]. IEEE Geoscience & Remote Sensing Letters, 2015, 12(8): 1645-1649.
[30] Liu L, Cheng Z. Detection of vegetation light-use efficiency based on solar-induced chlorophyll fluorescence separated from canopy radiance spectrum[J]. IEEE Journal of Selected Topics in Applied Earth Observations and Remote Sensing 2010, 3(3): 306-312.
[31] Cordon G, Lagorio M G, Paruelo J M. Chlorophyll fluorescence, photochemical reflective index and normalized difference vegetative index during plant senescence[J]. Journal of Plant Physiology, 2016, 199, 100-110.
[32] 童庆禧,张兵,郑芬兰,等.高光谱遥感——原理、技术与应用[M],北京:高等教育出版社,2015.
[33] 浦瑞良,宫鹏.高光谱遥感及应用[M],北京:高等教育出版社,2003.
[34] 蒋金豹,陈云浩,黄文江. 用高光谱微分指数预测条锈病胁迫下小麦冠层叶绿素密度[J]. 光谱学与光谱分析,2010,30(8):2243-2247.Jiang Jinbao, Chen Yunhao, Huang Wenjiang. Estimation of canopy chlorophyll density of wheat under stripe rust stress by using hyperspectral differential index[J]. Spectroscopy and Spectrum Analysis, 2010, 30(8): 2243-2247. (in Chinese with English abstract)
[35] 袁冰清,程功,郑柳刚. BP神经网络基本原理[J].数字通信世界,2008,8(17),28-29.Yuan Bingqing, Cheng Gong, Zheng Liugang. Basic principles of BP neural network [J]. Digital communication world. 2008, 8(17): 28-29. (in Chinese with English abstract)
[36] Breiman L. Random forest[J]. Machine Learning, 2001, 45(1): 5-32.
[37] Rodriguez-Galiano V, Mendes M P, Garcia-Soldado M J, et al. Precictive modeling of groungwater nitrate pollution using random forest and multisource variables related to intrinsic and specific vulnerability:A case study in an agricultural setting(Southern Spain)[J]. Science of the Total Environment.2014, 476-477: 189-206.
[38] 李健丽,董莹莹,师越,等. 基于随机森林模型的小麦白粉病遥感监测方法[J]. 植物保护学报,2018,45(2):395-396.Li Jianli, Dong Yingying, Shi Yue, et al. Remote sensing monitoring method of wheat powdery mildew based on random forest model [J]. Journal of plant protection, 2008, 45(2): 395-396. (in Chinese with English abstract)
[39] 刘良云,张永江,王纪华,等. 利用夫琅禾费暗线探测自然光条件下的植被光合作用荧光研究[J]. 遥感学报,2006,10(1):130-137.Liu Liangyun, Zhang Yongjiang, Wang Jihua, et al. Fluorescence study under natural light detection by using Fraunhofer dark line [J]. Journal of remote sensing.2006, 10(1): 130-137. (in Chinese with English abstract)
[40] 胡姣婵,刘良云,刘新杰. FluorMOD模拟叶绿素荧光夫琅禾费暗线反演算法不确定性分析[J]. 遥感学报,2015,19(4):594-608.Hu Jiaochan, Liu Liangyun, Liu Xinjie. Uncertainty analysis of FluorMOD simulated chlorophyll fluorescence fraunhofer inverse algorithm [J]. Journal of Remote Sensing, 2015, 19(4): 594-608. (in Chinese with English abstract)
[41] Du S, Liu L, Liu X, et al. Response of canopy solar-induced chlorophyll fluorescence to the absorbed photosynthetically active radiation absorbed by chlorophyll[J]. Remote Sensing, 2017, 9(9): 911.
[42] Porcarcastell A, Tyystjärvi E, Atherton J, et al. Linking chlorophyll a fluorescence to photosynthesis for remote sensing applications: mechanisms and challenges[J]. Journal of Experimental Botany, 2014, 65(15): 4065-4095.
[43] Song L, Guanter L, Guan K, et al. Satellite sun-induced chlorophyll fluorescence detects early response of winter wheat to heat stress in the Indian Indo-Gangetic Plains[J]. Global Change Biology, 2018, 24: 4023-4037.
[44] Beck P S A, Goetz S J. Satellite observations of high northern latitude vegetation productivity changes between 1982 and 2008: Ecological variability and regional differences[J]. Environmental Research Letters, 2011, 6(4): 049501.
[45] Gamon J A, Kovalchuck O, Wong C Y S, et al. Monitoring seasonal and diurnal changes in photosynthetic pigments with automated PRI and NDVI sensors[J]. Biogeosciences, 2015, 12(3): 4149-4159.
[46] Baker, Neil R. Chlorophyll Fluorescence: A Probe of Photosynthesis In Vivo[J]. Annu Rev Plant Biol, 2008, 59(1): 89-113.
[47] 陈思媛,竞霞,董莹莹,等. 基于日光诱导叶绿素荧光与反射率光谱的小麦条锈病探测研究[J]. 遥感技术与应用,2019,34(3):511-520. Chen Siyuan, Jing Xia, Dong Yingying, et al. Detection of wheat stripe rust using solar-induced chlorophyll fluorescence and reflectance spectral indices[J]. Remote Sensing Technology and Application, 2019, 34(3): 511-520. (in Chinese with English abstract)
[48] 王丽爱,马昌,周旭东,等. 基于随机森林回归算法的小麦叶片SPAD值遥感估算[J]. 农业机械学报,2015,46(1):259-265. Wang Liai, Ma Chang, Zhou Xudong, et al. Estimation of wheat leaf spad value using rf algorithmic model and remote sensing data[J]. Transactions of the Chinese Society for Agricultural Machinery, 2015, 46(1):259-265. (in Chinese with English abstract)
Wheat stripe rust monitoring by random forest algorithm combined with SIF and reflectance spectrum
Jing Xia1, Bai Zongfan1, Gao Yuan1,2, Liu Liangyun2
(1.,’,710054,; 2.,,100094,)
The prevalence of wheat stripe rust has a significant impact on the production of winter wheat all over the world. An effective monitoring and warning of this disease is imperative to ensure the quality of wheat production. Remote sensing detection of wheat stripe rust is important for agriculture management and decision. The reflectance spectrum is closely related to the changes of biomass. It cannot, however, directly reveal the photosynthetic physiological state of vegetation. Solar-induced chlorophyll fluorescence(SIF) can sensitively reflect the photosynthetic vitality of crops, and the canopy’s solar-induced chlorophyll fluorescence signal includes the fluorescence characteristics of physiological changes caused by plant disease stress. In order to improve detection precision of wheat stripe rust, this study made full use of the advantages of reflectance spectroscopy for the detection of crop biochemical parameters and the advantages of chlorophyll fluorescence in photosynthetic physiological diagnosis, a remote sensing study on the severity of wheat stripe rust was carried out by using random forest (RF) and other machine learning algorithms synergistic SIF and reflectance differential spectral index in the canopy of wheat. Firstly, based on Fraunhofer line principle, three bands fraunhofer line discrimination(3FLD) algorithm was used to predict the intensity of chlorophyll fluorescence in O2-A band (760 nm). Then 11 reflectance differential spectral indices, which are sensitive to the severity of wheat stripe rust disease were selected. Based on RF and back propagation(BP) neural network algorithm, a model for predicting the severity of wheat stripe rust with differential reflectance spectral index and canopy SIF was established. The study incorporated a cross-checking method based on measurements of control samples. Fifty-two raw crop samples were randomly divided into two parts three times, the first part including 39 datasets was used as the training set for the model building, and the remaining 13 data samples were used to evaluate the accuracy of the models. The results showed that: 1) There is a significant negative correlation between SIF and the disease severity of wheat stripe rust. Remote sensing detection of wheat stripe rust severity can both be realized using the differential spectral index alone or by using the differential spectral index and the solar-induced chlorophyll fluorescence in combination. However, the accuracy of the estimates made by the RF and BP neural network models using the combination of data from the differential spectral index and the solar-induced chlorophyll fluorescence were all higher than that for the models constructed using the differential spectral index alone. In the three sample groups, average determination coefficient between the estimated DI using the RF model and the BP neural network model and the measured DI increased by 4% and 14% respectively, and the average RMSE decreased by 33% and 28% respectively. The detection accuracy of wheat stripe rust severity can be improved using solar-induced chlorophyll fluorescence combined reflectance differential spectral index. 2) The canopy solar-induced chlorophyll fluorescence synergistic differential spectral index were used as sensitive factors, the coefficients of determination between the estimated DI using the RF model and the measured DI were 0.90, 0.93, and 0.98, respectively, which were greater than the coefficients produced when using the BP neural network model for the same group (0.88, 0.84, and 0.92). Similarly, the RMSEs were 0.09, 0.07, and 0.04, respectively, which were smaller than the RMSEs (0.10, 0.11, and 0.09) using the BP neural network model for the same group. Therefore, the model using the RF algorithm was better at estimating wheat stripe rust severity than the BP neural network-based model, and it is more suitable for the remote sensing detection of wheat stripe rust severity. These results have important significance for improving the accuracy of the real-world remote sensing detection of wheat stripe rust, and the analysis provides new ideas for further realizing large-area remote sensing monitoring of crop health.
remote sensing; monitoring; wheat; stripe rust; random forest; solar-induced chlorophyll fluorescence; differential spectral index
10.11975/j.issn.1002-6819.2019.13.017
S512.1+1
A
1002-6819(2019)-13-0154-09
2018-11-18
2019-05-24
国家自然科学基金(41601467)
竞 霞,博士,副教授,研究方向为农业定量遥感。Email:jingxiaxust@163.com
竞 霞,白宗璠,高 媛,刘良云.利用随机森林法协同SIF和反射率光谱监测小麦条锈病[J]. 农业工程学报,2019,35(13):154-161. doi:10.11975/j.issn.1002-6819.2019.13.017 http://www.tcsae.org
Jing Xia, Bai Zongfan, Gao Yuan, Liu Liangyun. Wheat stripe rust monitoring by random forest algorithm combined with SIF and reflectance spectrum [J]. Transactions of the Chinese Society of Agricultural Engineering (Transactions of the CSAE), 2019, 35(13): 154-161. (in Chinese with English abstract) doi:10.11975/j.issn.1002-6819.2019.13.017 http://www.tcsae.org

