
Assessing recent gradual upsurge of marine captured Hilsa stock (Tenualosa ilisha) in Bangladesh
2019-07-24 11:06EhsnulKrimQunLiuMingSunPrthoProtimBrmnShnurJhedulHsnEnmulHoq
Aquaculture and Fisheries 2019年4期
Ehsnul Krim, Qun Liu, Ming Sun, Prtho Protim Brmn, Shnur Jhedul Hsn,M. Enmul Hoq
a College of Fisheries, Ocean University of China, Qingdao 266003, China
b Bangladesh Fisheries Research Institute (BFRI), Mymensingh 2201, Bangladesh
A B S T R A C T The anadromous Hilsa shad(Tenualosa ilisha)fishery is the prime single species fishery of Bangladesh that driven by open access system which was selected for this study. Key purpose of this study was to assess the MSY(Maximum Sustainable Yield)in order to review the effectivity of the ongoing management policy of this fishery.For this reason,time series maritime or downstream catch-effort data of the Bay of Bengal were assembled from the Department of Fisheries, Bangladesh. MSY, CPUE and other population parameters were estimated through Surplus Production Models (SPMs) using computer software packages of CEDA,ASPIC and TropFishR.Assessed biological reference points of MSY from the best fitted CEDA package was 282,100 t(R2=0.822)for the normal assumptions of the Schaefer and Pella-Tomlinson models. MSY values from the ASPIC packages (324,100 t and 263,500 t; for Fox and Schaefer model) and Schaefer model from TropFishR (345,486t) were larger than the catch in 2017(278,948 t).The values of F ratio(F/FMSY)for all SPMs were found less than 1 and B ratio(B/BMSY)were greater than 1 that clearly indicate the gradual upsurge of the Hilsa stock. Based on the above findings of BRPs, it also proves the effectivity of the current “Hilsa fishery management action plan” by the authorities.*Corresponding author. College of Fisheries, Department of Marine Fisheries, Ocean University of China, Qingdao 266003, PR China.E-mail address: qunliu@mail.ouc.edu.cn (Q. Liu).
Keywords:Tenualosa ilisha SPM (surplus production model)CEDA (catch and effort data analysis)ASPIC(A surplus production model incorporate covariates)TropFishR
1. Introduction
Hilsa Shad (Tenualosa ilisha), the national fish of Bangladesh, has already achieved international reputation for its flavor, delicacy and nutritional values and which are basically anadromous in nature.This is an important migratory species not only in the Bay of Bengal but also in the Persian Gulf, Arabian Sea, Vietnam Sea and Andaman Sea(Mohammed & Wahab, 2013). Hilsa fishery in Bangladesh contributes about 10%of the country's overall fish production and about 60 percent of global catch of the species(Rahman &Cowx,2008).There are three types of Hilsa available in Bangladesh; except Hilsa Shad (Tenualosa ilisha)the rest two Tenualosa toli(Chandana)and Tenualosa kelee(Gorta illish) spent their whole lives on the coastal and marine environment.Actually, Hilsa are available in countries such as Bangladesh, India,Pakistan, Myanmar, Kuwait, Iran, Bahrain, Iraq, Indonesia, Malaysia and Thailand. After 2012, it is to be noted that the yield of Hilsa declined in many other countries except Bangladesh.
Hilsa fishery has had a glorious history in Bangladesh when plenty of Hilsa was captured from more than 100 rivers and its abundance were observed in every estuarine environment. Gradual declination started from the early 80's and yields(downstream marine)reached at a lower of 0.136 million tonnes in 2003 (DoF, 2016). The fishery was damaged because of a combination of the blockage of migratory routes,over-fishing, siltration, pollution, indiscriminate capture of brood stocks and youngs (locally known as Jatka), illegal use of banned fishing nets having tiny meshed, increased numbers of fishers, hydrological factors and climatic changes (Mohammed & Wahab, 2013).Since then,the policy makers and the authorities of Bangladesh realize about the proper action plan for sustainable management of this fishery. However, the foremost breeding season of Hilsa is September-October and the core period of laying eggs starts when the first full moon in the month of Ashwin arise (Bangla month which starts from the middle of September and end at the middle of October) which is also called the peak season. For this reason, the activities of acquiring,distributing, transporting, marketing, stocking and exchange activities on Ashwin's 1st four days of full moon and subsequent 17 days(4 + 1 + 17) are closed since 2010. In relation with, mother Hilsa conservation campaigns are also taken from the year of 2012 to raise awareness buildup throughout the fishing community from October 1 to October 22 (Rahman, FluraAhmed, Pramanik, & Alam, 2015).

Table 1Time series marine or downstream catch (including marine or coastal & estuarine catch in tonnes) of the Bay of Bengal and CPUE data from the 2001 to 2017 (Source: FRSS, DoF, 2017).
With the implementation of the proper Hilsa management strategy,the total production of Hilsa in Bangladesh now about to exceeds 0.5 million t. According to the statistics from DoF, the total production of Hilsa in the country during 2008 was 0.29 million t whereas it raises 0.395 million t in the fiscal year 2015-16 (Table 1) and downstream catch or marine catch (coastal and estuarine also included) contributes two-third of the total production (DoF, 2017). It proves that the fisheries department,administration and various law enforcement agencies have implemented the scheme of Hilsa properly which help to increase production throughout the country.After analyzing the data from 2010 to 2017 (last 8 years) statistics of the Hilsa producer countries, it is found that only in Bangladesh, the production has increased almost 30 percent rather than with the other producers - which is the great achievement of the current management policy (DoF, 2017). Proper conservation of mother Hilsa through considering the exact breeding time as well as protection and banning of harvesting of young juvenile Hilsa (Jatka) helps to increase production in the country. Other producers of Hilsa are now considered Bangladesh to be the role model of the stock reappearance of Hilsa. Recently, India starts to trail similar action plan of Hilsa Management Strategy as of Bangladesh. This success of the last two-three years production of Hilsa creates a new hope among the fishing community. Many of the fishers now realize that if they can properly protect the mother Hilsa and young,they will be able to enjoy the benefits of yielding Hilsa at an increased rate. For this reason, the fishermen are also involved in many cases to protect the mother Hilsa which now affect the reappearance of the stock of Hilsa.
Previously, most of the stock assessment and population dynamics reports on the Hilsa fishery of Bangladesh were mostly based on the upstream (riverine) captured data (Rahman, Amin, & Haldar, 1999,2000, 1998; Amin, Rahaman, Haldar, Mazid, & Milton, 2002, 2004,2008, 2000; BOBLME, 2014; Haldar, Mazid, Rahman, & Amin, 2001;Mazid, 2001; Rahman & Naevdal, 2000). Those studies demonstrated the reducing trends of Hilsa stock due to nonstop-unregulated catch of Hilsa in those areas and most of the time they used only FAO-ICLARM Stock Assessment tools (FISAT) packages where time series data is not the pre-requisite. In addition, their studies were also indicated that the increasing trends of fishing efforts e.g.both registered and unregistered fishing boats including a wide variety of fishing gears were used to exploit Hilsa throughout the year and the number of fishermen were also increased due to its higher demand in home and abroad market(Haldar, Mazid, Rahman & Amin, 2001; Halder, 2004a). Only a few study by Amin, Rahaman, Haldar, Mazid, and Milton (2008) and BOBLME, 2014 revealed that the cumulative increasing of fishing intensity in the downstream zones particularly in inshore waters whereas satisfactory concentrations of Hilsa were not available. Similarly, CPUE (catch per unit effort i.e catch/year/boat) was seriously reduced about 50%-60% in both upstream and downstream areas(Halder,2004b).Therefore,downstream harvesting zones were favored to provide a guesstimate stock and exploitation scenario of Hilsa fishery in the present study and in context of this fishery of Bangladesh;it may be the first attempt to assess stock and BRPs by using SPMs.
The surplus production model has been sensibly chosen for assessing MSY of this study because it is simple and easy.Its parameters can be easily assessed by using only catch and effort data (or catch and CPUE data) and the estimated parameters can easily be interpreted as biological reference point. Likewise, this model is especially well fitted and relaxed to identify the potentially serious effects and also requirements of limited data in the both case eg. single-species or multispecies fishery (Jensen, 2002). Former versions of SPMs generally use non-linear regression, which are somewhat difficult to interpret(Hilborn&Walters,1992;Ricker,1975).The early standard production models have often expected equilibrium conditions, but fish stocks are hardly in equilibrium state (Hilborn &Walters,1992).The equilibrium models need simply a linear regression for its implementation but for non-equilibrium production models, which need non-linear regression methods that are comparatively difficult to implement (Hilborn &Walters,1992).Recently,several softwares have been developed which can measure biomass dynamics of the exploited fish stocks which are easily reckonable and very effective tools i.e. TropFishR (production models scheme) (Mildenberger, Taylor, & Wolff, 2017), CEDA (catch and effort data analysis) (Hoggarth et al., 2006), ASPIC (a stock production model incorporating covariant) (Prager, 2005).
Hence, the maximum sustainable yield (MSY) of Hilsa Shad fishery of Bangladesh was estimated through analyzing time series catch and effort data from the year of 2001-2017 that were collected from the log book of Fisheries Resources Survey System (FRSS), Department of Fisheries (DoF), Bangladesh. This study may be the opening attempt to estimate MSY through analyzing downstream time series catch and effort data of Hilsa fishery using various software packages.
2. Materials and methods
2.1. Source of data and sampling
The catch fishery of Hilsa shad in case of marine and coastal capture or downstream catch mostly depend on artisanal fishery (both mechanized and non-mechanized boats) in Bangladesh that contributed more than 90% of total captures and the rest from industrial trawls. In artisanal catches, several types of seine net (SN) i.e. current jal, specialized gill nets(GN),drift gill nets(DGN)are playing supreme role for capturing and fixed or set bag nets(SBN)are also seen in somewhere for harvesting Hilsa (Amin et al., 2002).
The time series maritime catch data from the period between 2001 and 2017 (Table 1) of Hilsa (T ilisha) that covering annual landings(both artisanal and industrial) and their equivalent efforts have been considered for this study. This data was taken from the Fisheries Statistical Report of Bangladesh which compiled by Fisheries Resource Survey System (FRSS), Department of Fisheries (DoF). Actually, a common log sheet has been provided by DoF to the licensed vessel's crews for reporting of their catch preceding to get a navigating approval for the forthcoming fishing trip. Then these secondary landing data contained log sheets are randomly cross-checked by the accredited persons of the Department of Fisheries (DoF) and compiled through a system.
In this study,CPUE(catch per unit effort)was calculated on routine basis fishing i.e.the quantity of fish(in weight)that were captured by a registered vessel per annum (the average fishing days varied from 200 to 220 days per year).
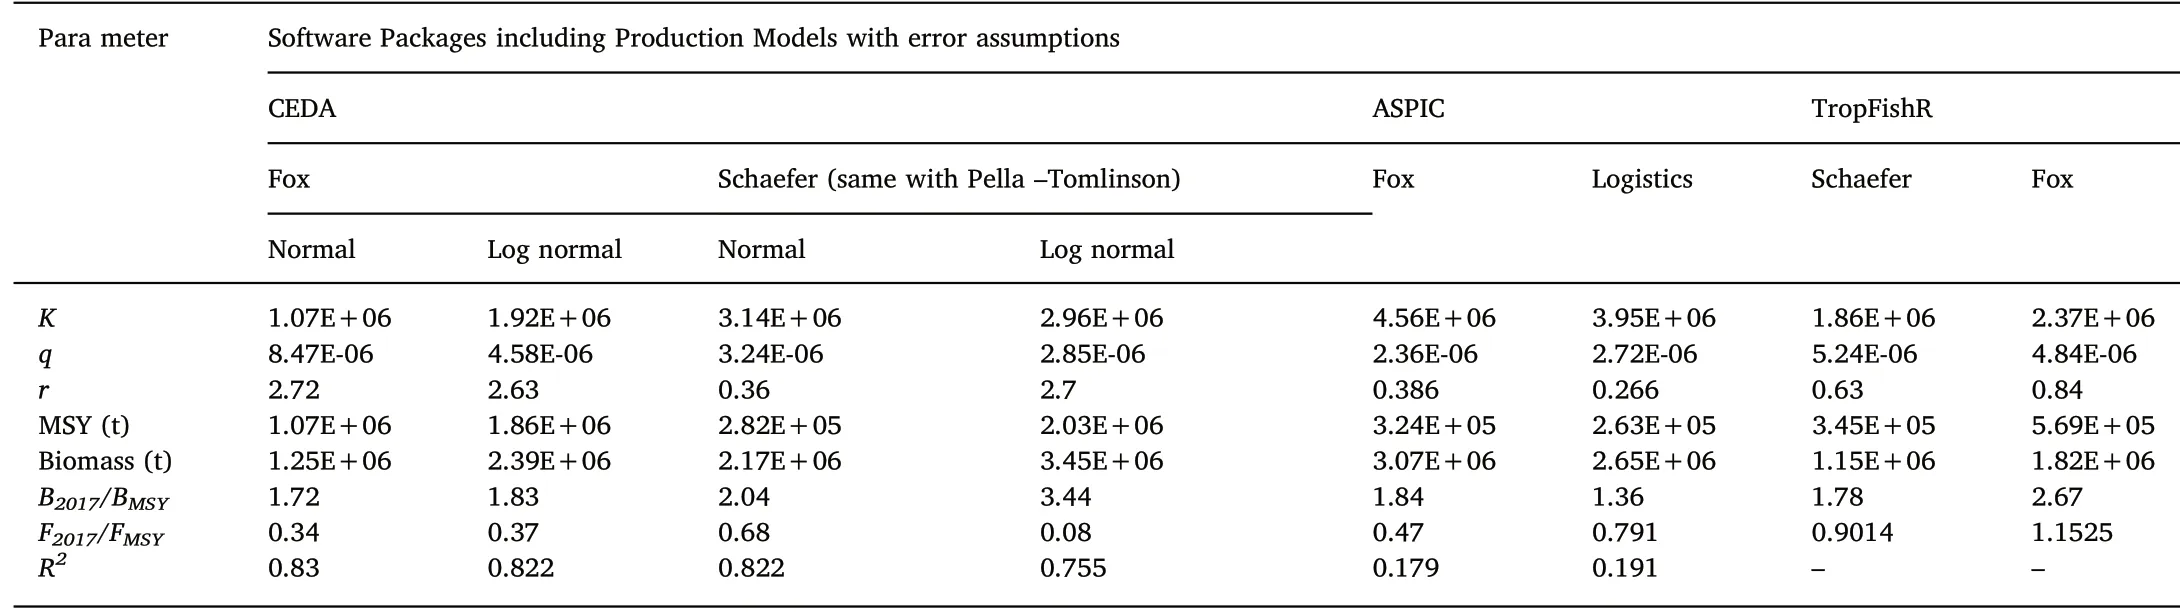
Table 2Comparative study of the outputs from three different software packages of SPMs for the downstream Hilsa catch fishery of Bangladesh (from 2001 to 2017); in all cases of CEDA, ASPIC and TropFishR packages, IP (initial proportion) was used 0.6
2.2. Data analysis by different software
The time series catch and effort data of downstream captured Hilsa(T ilisha) were analyzed by using a software package CEDA (Catch and Effort Data Analysis) (Hoggarth et al., 2006). The three surplus production models (SPMs) i.e.Schaefer, Fox and Pella-Tomlinson are used in CEDA packages with three error assumptions. The most typically used model is Schaefer(1954)which is based on the logistic population growth function:
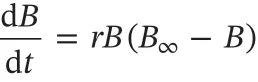
Later,Fox(1970)enhanced a Gompertz population growth equation while Pella and Tomlinson(1969)recommended the use of generalized population production curve.
In the above calculations, sign B used for fish stock biomass, B∞for carrying capacity, t for time, and r for intrinsic rate of population increase.
2.2.1. CEDA (version 3.0.1) software package
This package normally allows fitting three non-equilibrium surplus production models i.e. Schaefer (1954), Fox (1970) and Pella and Tomlinson (1969) having facility of assessing three error assumptions(normal, log-normal and gamma). It can calculate the following key parameters:MSY(maximum sustainable yield),K(carrying capacity),q(catchability coefficient), r (intrinsic growth rate), final biomass, replacement yield, whereas CV (coefficient of variation) of the assessed MSY values can also be calculated.
2.2.1.1. Pre-requisite of CEDA software packages. This package requires an input value of initial ratio of starting biomass(B1)over the carrying capacity(K)by the user.In this study,we used the ratio of initial catch with maximum catch as IP value and it was fixed at 0.6. When the IP(initial proportion) value is fixed at zero, it designates that the fishery originated from a virgin population and if the IP value is close to 1, it represents severely harvested fishery. Nevertheless, in some cases programmer fixes the starting biomass such as B1= K.
2.2.2. ASPIC (A surplus production model incorporate covariates, version 5.0) (Prager, 2005)
It comprises of two surplus production models Fox(a distinct case of GENFIT) and Logistic (Schaefer). The main output parameters are maximum sustainable yield (MSY), catchability coefficient, proportion of initial biomass over carrying capacity(B1/K),coefficient of variation(CV), coefficient of determination (R2), fishing mortality rate at MSY(FMSY) and stock biomass giving MSY (BMSY) (NOAA, 2018).
The initial proportion (IP) which plays as an indicator that shows how data started.Actually,the user commands IP as of B1/K and it was also 0.6.
2.2.3. TropFishR software package (Mildenberger et al., 2017)
The R package TropFishR is a latest analysis toolbox accumulating single-species stock assessment approaches specially designed for datalimited fisheries analysis. It can be used to assess biological stock features i.e. growth and mortality as well as exploitation rate, virtual population analysis (VPA) and stock status with yield prediction or production models(eg.Schaefer and Fox)etc.Data set consisting of-time series (year - year vector), catch (“Y” yield) in weight per year and fishing effort per year (“F” effort) or CPUE (catch per unit effort) per year.The main outputs are maximum sustainable yield(MSY),intrinsic population growth (r) fishing mortality rate at MSY (FMSY), stock biomass giving MSY (BMSY) and carrying capacity (Fig. 1).
3. Results
3.1. Outputs from CEDA package
The results obtained from the CEDA package are highly responsive to the input IP(initial proportion)values and in this study,IP=0.6 was used(Table 2)because the initial yield was about 60%of the maximum catch.The biological reference point of MSY with the CEDA package for the Fox model with two error assumptions (normal and log normal)were 1069,740 t and 1856,514 t respectively (Table 2). Likewise, the estimated values of MSY for Schaefer and Pella Tomlinson with two error assumptions of normal and log normal were same which was 282,223 t and 2033,083 t respectively (Table 2). In relation with, intrinsic population growth (r) of all Fox assumptions were found higher than Schaefer(normal)which is one of the crucial factors of estimating population parameters. The values of catchability coefficient (q) for both error assumptions (normal and lognormal) of Fox model and intrinsic population growth (r) of Fox (normal error assumption) were found higher than those of Schafer and Pella-Tomlinson (Table 2).Furthermore,the estimated values of carrying capacity(K)and biomass(B)and biomass giving MSY ratio(B/BMSY)were found higher in case of Schaefer (Table 2). The observed catches from Schaefer models were roughly close to the expected catch when applying IP value 0.6 that were displayed in Fig. 2. From visual examination of the graphical illustration of observed and predicted annual catch values, it can be acknowledged that for all the error assumptions used in Fox model,observed and expected catch values are close to each other,however in detail, they are different from each other. CEDA computed higher MSY values with lower IP values and vice versa.
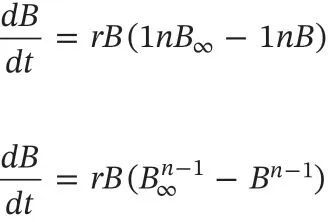
Fig. 1. Three major downstream data collection spots (Red marked) and suitable breeding zones of Hilsa in the Bay of Bengal maritime area, Bangladesh (Source:Hossain,Sarker,Chowdhury,&Sharifuzzaman,2014).(For interpretation of the references to color in this figure legend,the reader is referred to the Web version of this article.)
CEDA exhibited sensitivity towards the input IP values as it produced various output MSY for various IP inputs (Table 3). Gamma assumption for CV values produced minimization failure for IP values of 0.1-0.5 and 0.9 of the Fox model (SPMs) and 0.1, 0.4, 0.6 and 0.9 for Schaefer (same as Pella-Tomlinson) that were obtained by using a special method termed as bootstrapping confidence limit method. Except for IP=0.6,for all SPMs from CEDA package used along with their error assumptions either BRPs(i.e MSY,B/BMSY,F/FMSY)or R2value did not produce rational results. The best fit of the model was determined with the estimated BRPs(i.e MSY,B/BMSY,F/FMSY)and R2value for the Schaefer (normal) model, whereas Fox model produced the higher value of MSY, which was more conservative than Schaefer (Tables 2 and 3).
3.2. Outputs from ASPIC
Computed parameters for IP 0.6 are presented in Table 2.MSY along with their CV values for Fox and Logistic models used in ASPIC were estimated at 324,100 t (0.266) and 262,500 t (0.232) in that order.Except catchability coefficient (q) and F ratio (F/FMSY) all other computed values like K (carrying capacity), intrinsic growth (r), biomass and biomass ratio of Fox model were higher than the Logistic(Schaefer)model that also proved the conservativeness of Fox model. The estimated MSY of the Schaefer (Logistic) model was close to the most recent yields, which designates a better fit (Table 2).
Table 4 reveals various factors estimated for IP=0.1-0.9. Like CEDA, ASPIC also showed sensitivity to IP values as it evaluated different output parameter values for different IP input. However, parameters calculated by this software did not exhibit higher differences as compared to CEDA. Computed MSY by ASPIC, for instance, ranged in 262,500 t - 324,100 t while for CEDA its most of estimated range was 282,223 t -2033,083 t. It means even though ASPIC is sensitive to IP values but its sensitivity is less than CEDA.
Estimated fishing mortality (F), biomass (B), the F ratio and B ratio values of the downstream captured Hilsa fishery by using ASPIC are presented in Table 5.Calculated figures indicate that F/FMSYhas shown rising trend with passage of time whereas B/BMSYis more or less stabilized during the course of study period (Fig. 3). Both, F/FMSYand B/BMSYindicate safer stock of this fishery.
3.3. Results from TropFishR packages
The biological reference point of MSY for the newly developed TropFishR package for the Schaefer and Fox model were 345,486 t and 569,499 t respectively (Table 2). In addition, except catchability coefficient (q) the computed all other values like carrying capacity (K),intrinsic growth(r),F ratio and B ratio values of Fox model was higher than that of Schaefer. All of the output findings i.e. yield, CPUE and biomass from TropFishR packages are illustrated on Fig. 4. Only Fox models from TropFishR package was produced higher F/FMSYvalue out of all other estimated SPMs that were analyzed from CEDA and ASPIC packages,that indicates overexploitation but this is not well fitted,as its estimated MSY was so higher than the recent catch. Thus, Schaefer model is determined as best fit than Fox because the observed catches were roughly close to the expected catch (Fig. 4).
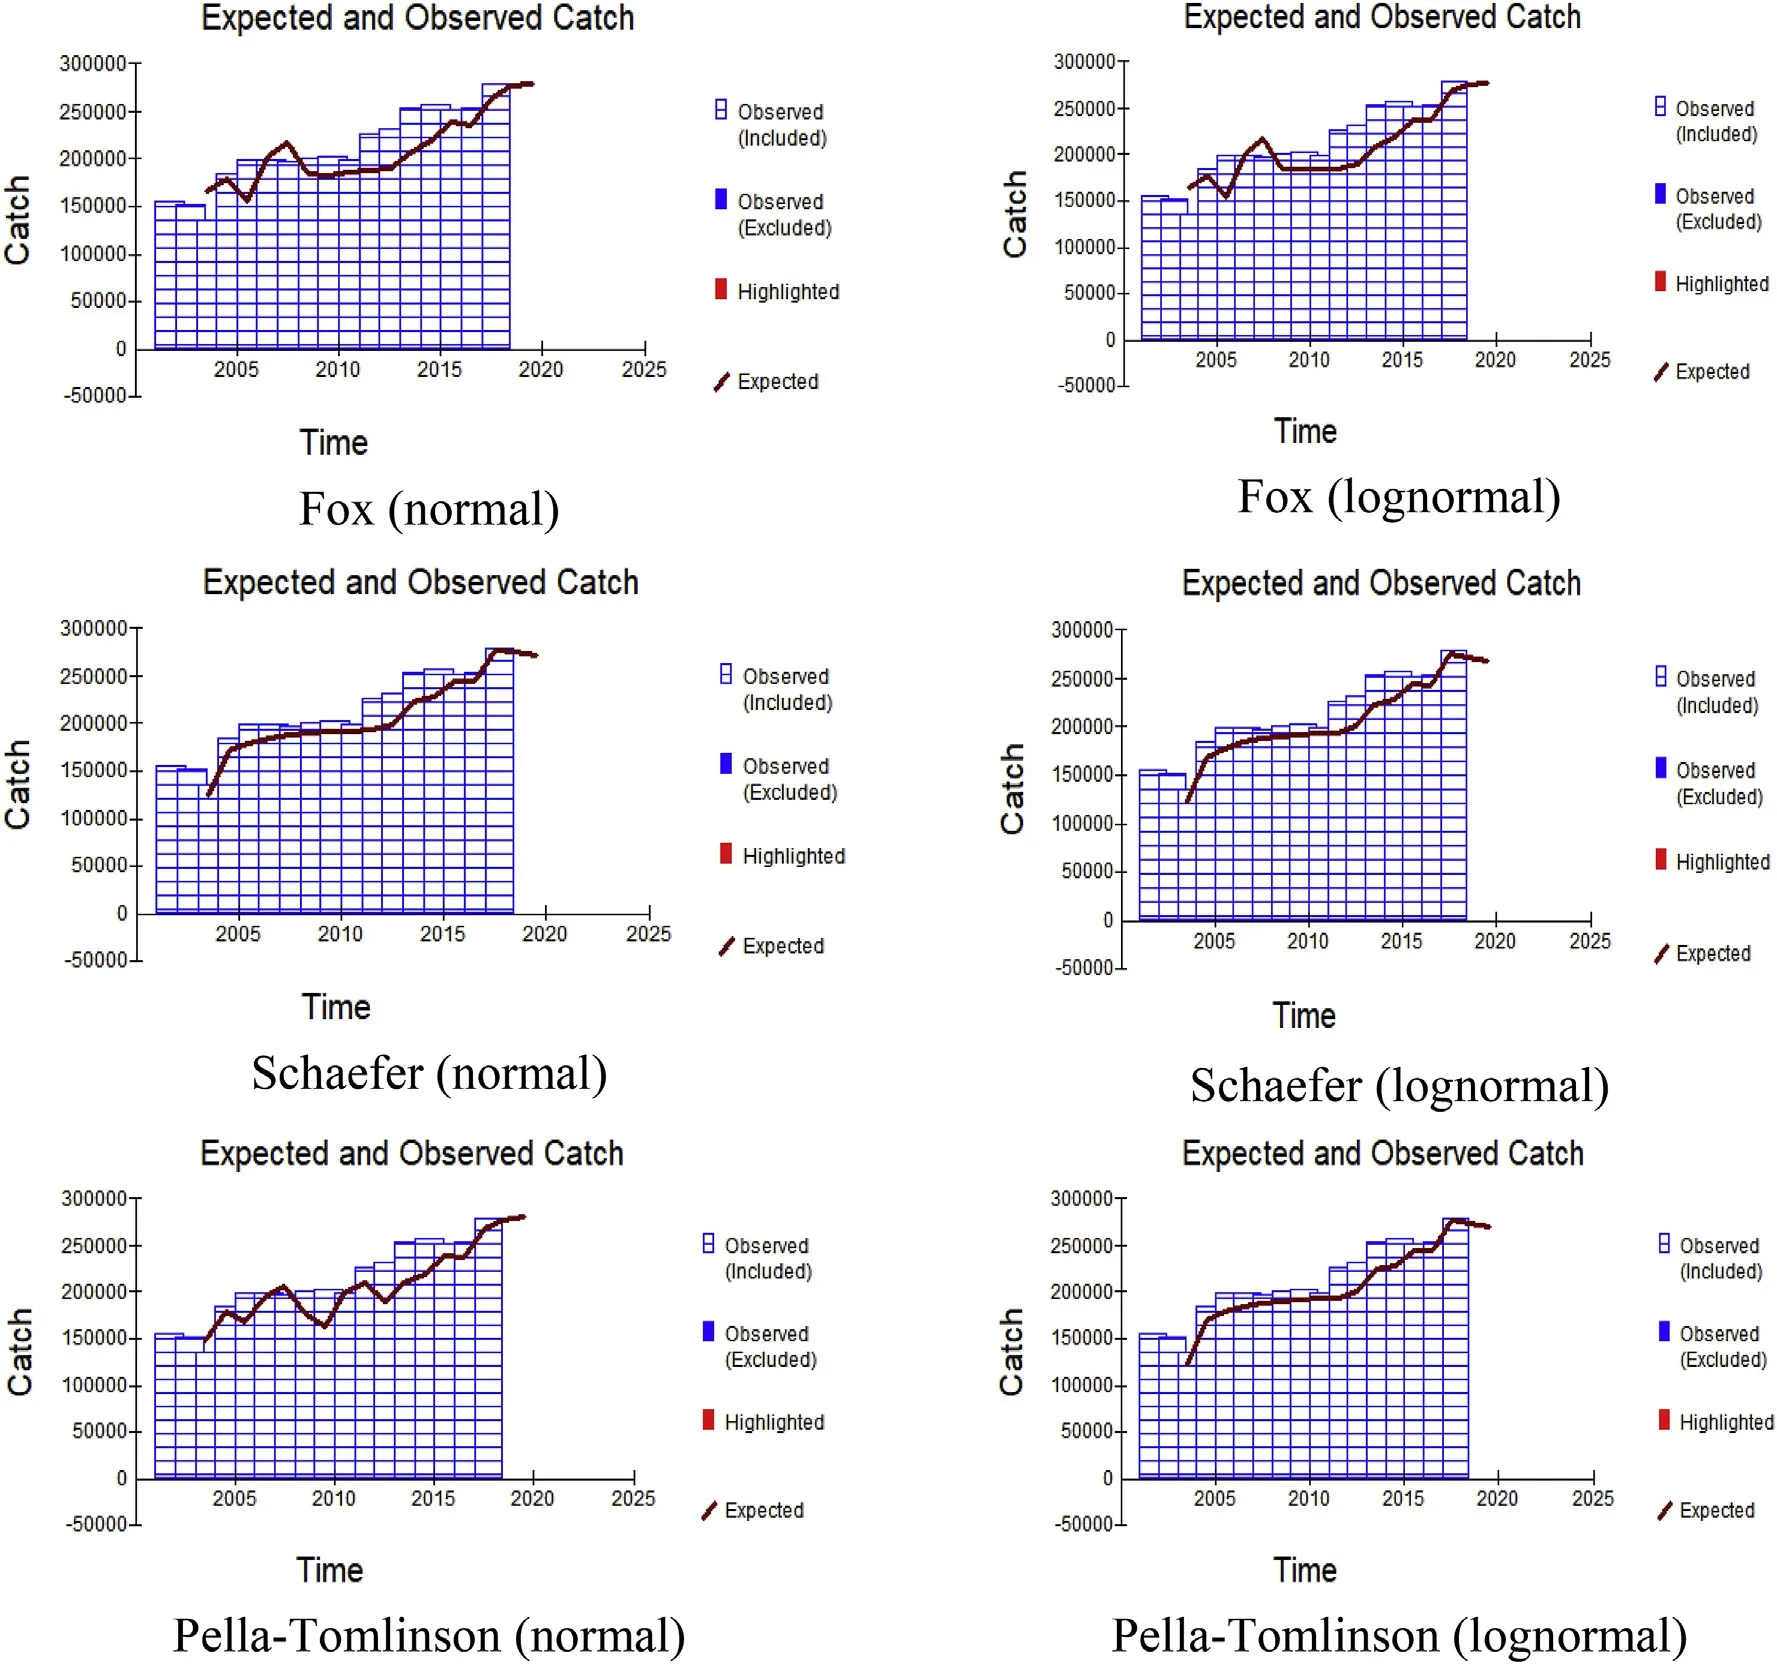
Fig. 2. Graphs obtained by using CEDA packages for IP=0.6. Blue colored segmented bar indicate observed catches whereas brown colored bold straight line represents expected catches. (For interpretation of the references to color in this figure legend, the reader is referred to the Web version of this article.)
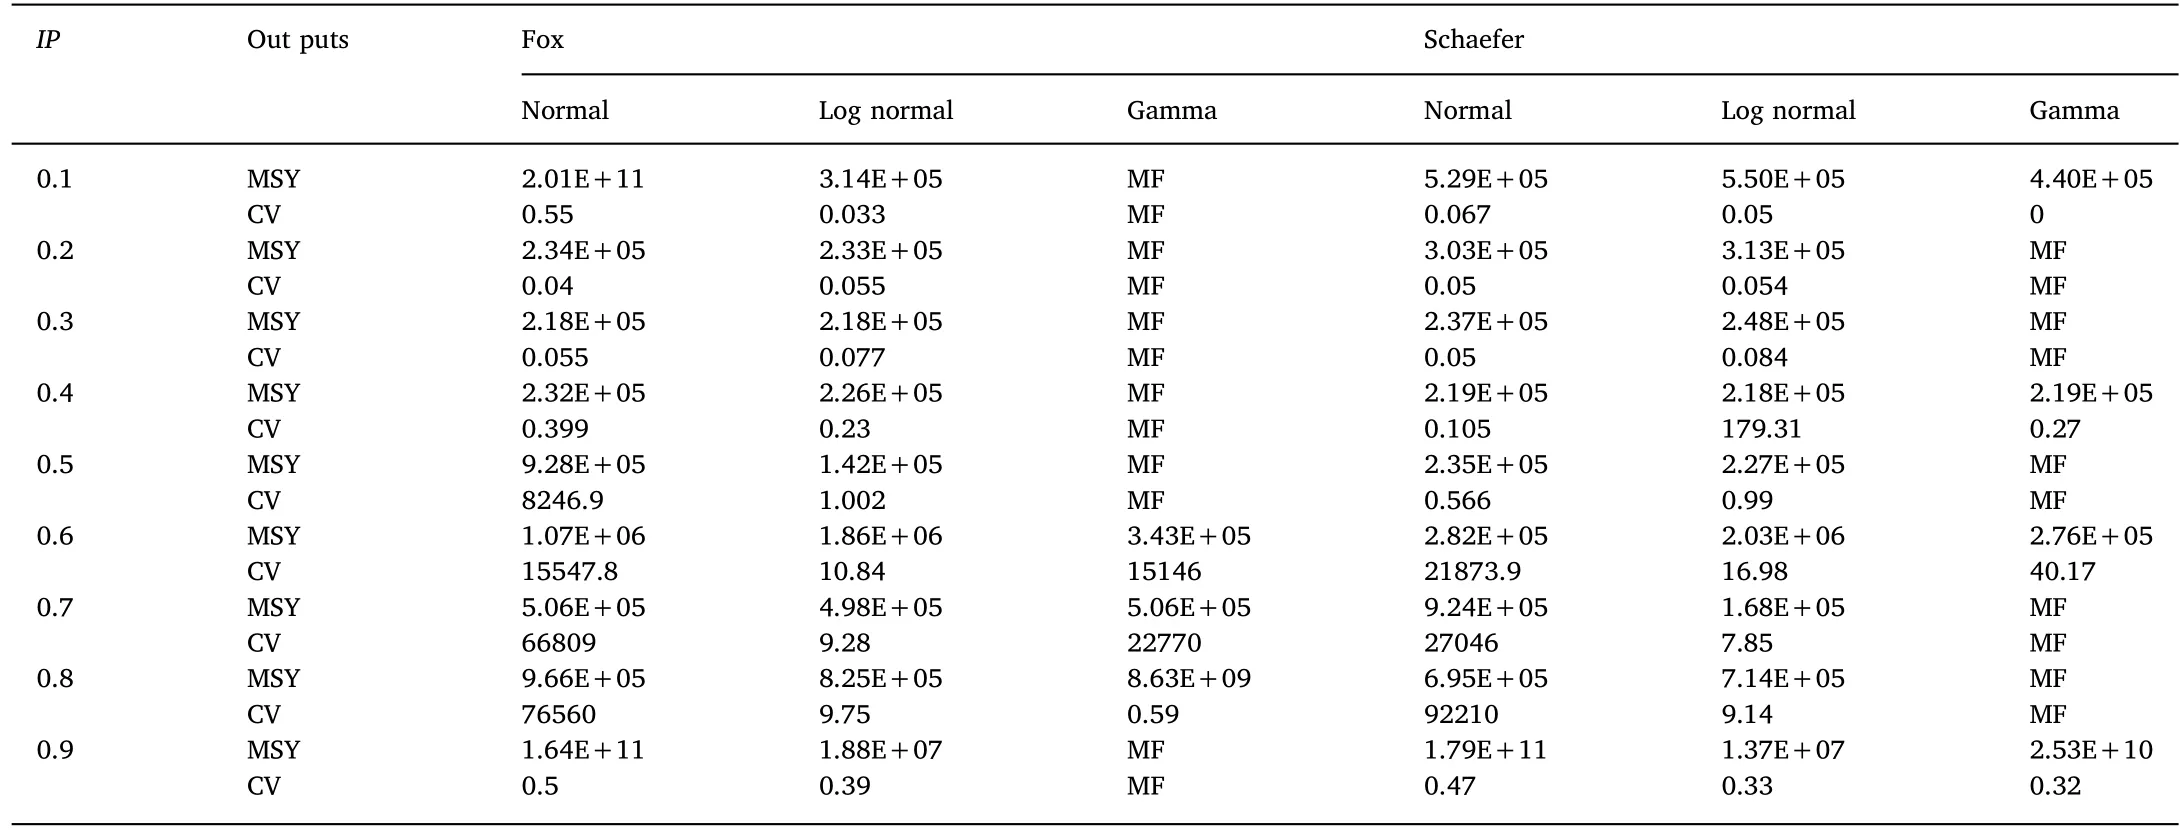
Table 3Sensitivity analysis of the estimated parameters from CEDA software package results with IP value(0.1-0-9)of the downstream captured Hilsa fishery of Bangladesh.
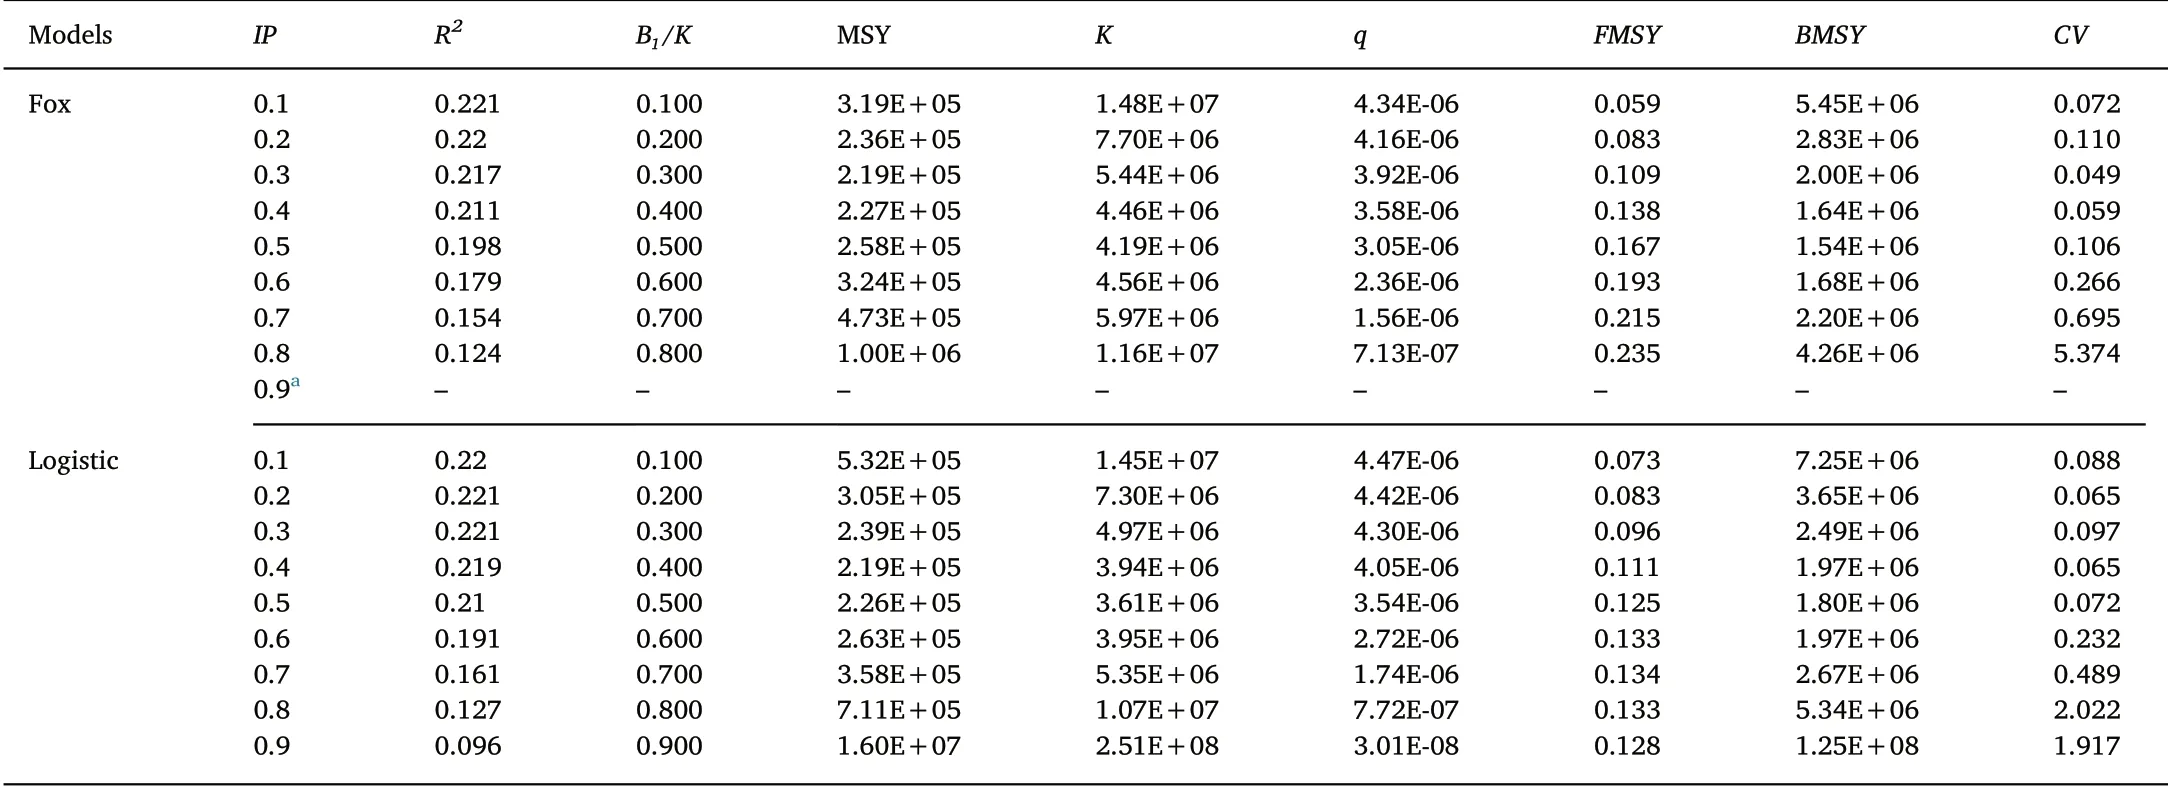
Table 4Sensitivity analysis of the estimated parameters from ASPIC software package results with IP value(0.1-0-9)of the downstream captured Hilsa fishery of Bangladesh.
4. Discussion
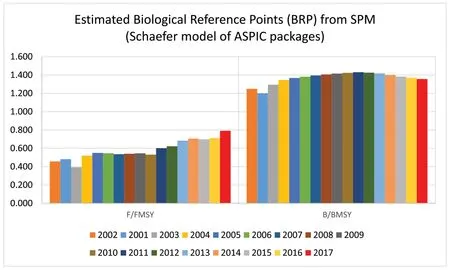
Fig. 3. ASPIC software estimates (Schaefer model) of F/FMSY and B/BMSY from 2001 to 2017 of the maritime captured Hilsa fishery of Bangladesh.
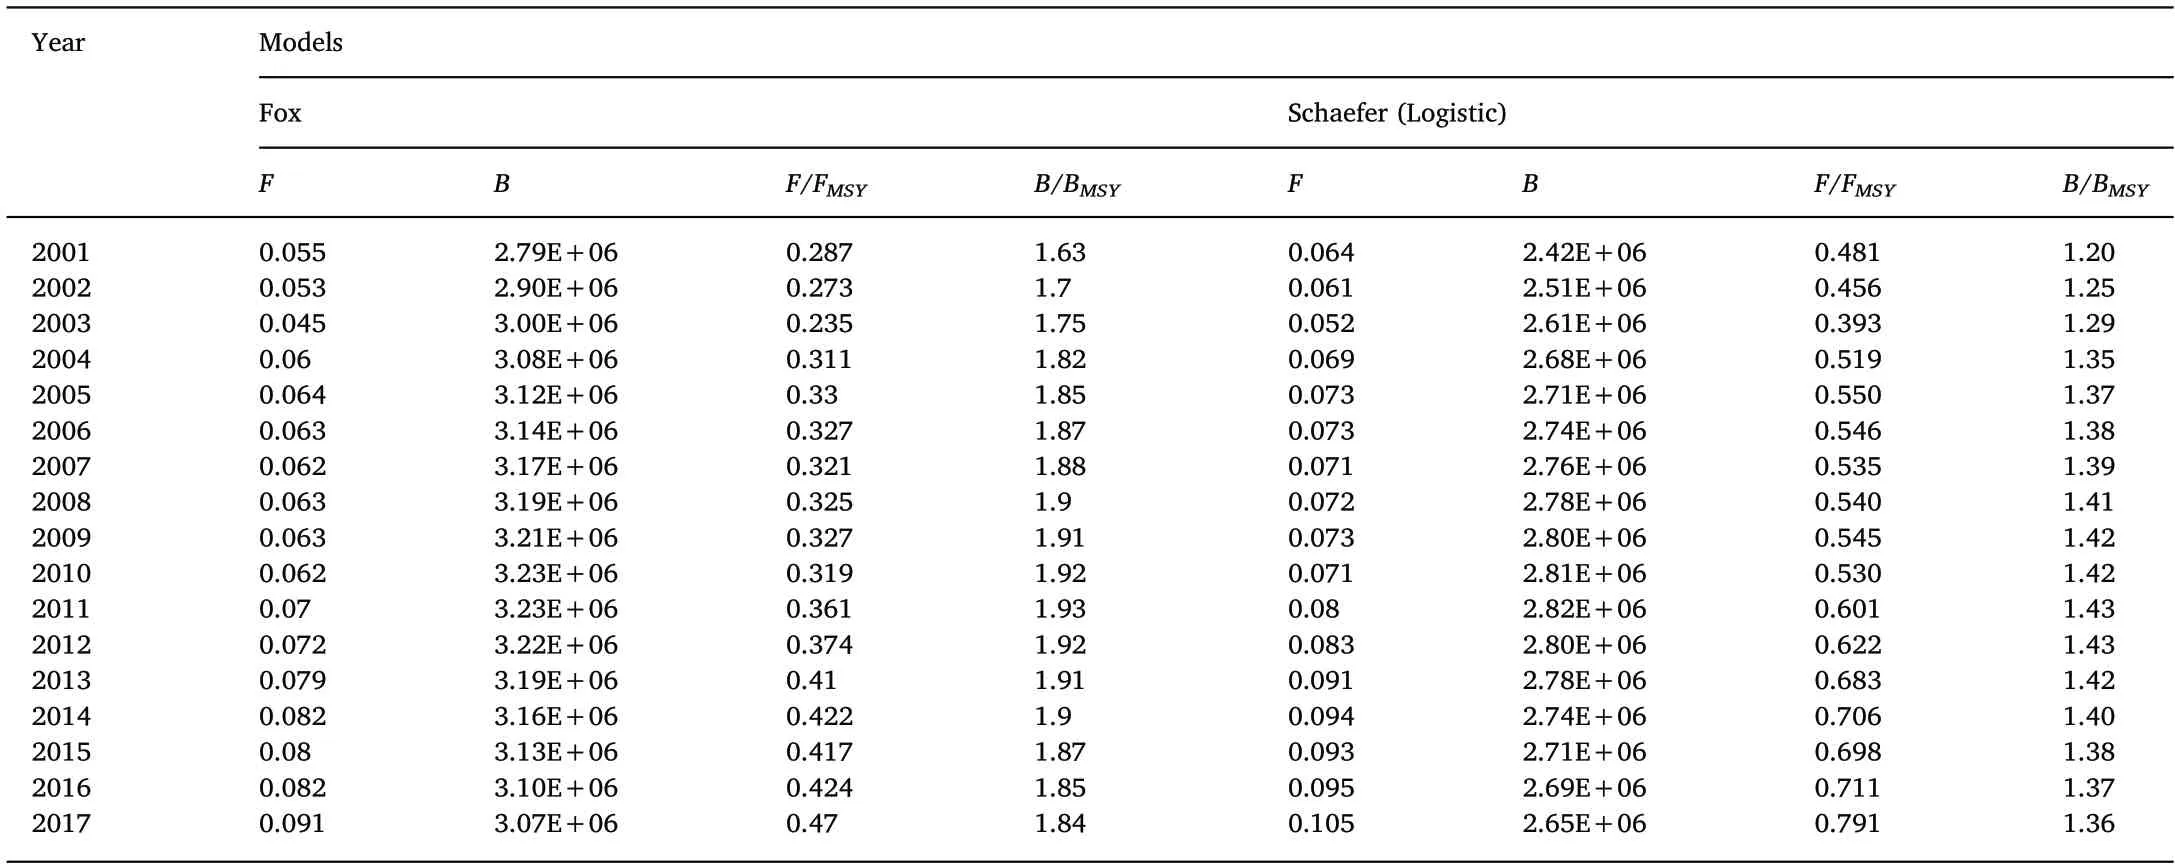
Table 5ASPIC software estimates of the ratio of fishing mortality(F)over fishing mortality rate at MSY(FMSY)and biomass(B)over biomass giving MSY(BMSY)from 2001 to 2017 of the maritime captured Hilsa fishery of the Bay of Bengal, Bangladesh.
This study was conducted to estimate the biological reference points of MSY through using different software packages in order to review the effectivity of the ongoing management policy of this fishery. The assessed MSY from the all software packages (CEDA, ASPIC and TropFishR) were ranged between 263,500 t to 345,486 t (Table 2).Highest MSY value was obtained from TropFishR package and lowest figure from the Schaefer (Logistic) which was slightly less than the last catch (Tables 1 and 2). Furthermore, based on the goodness of fitness criterion, the best-fitted MSY was 282,100 t obtained from the normal assumptions of the Schaefer and Pella-Tomlinson models of the CEDA package (Table 2). According to some previous studies by Amin et al.(2002 and 2008) which was based on maritime captured Hilsa, the estimated MSY were 162,396t in 2002 and 210,125 t in 2008(Table 6).All of those studies revealed the over-exploitation states ranged between 20 and 45 percent (Table 6) whereas in 2002 it was highest(45%). Actually, these outputs showed two patterns: a gradual increasing trend in MSY with few fluctuations during 2002-2008,and an MSY lower than that determined in the present study.This may be due to increased survival through some improvements to the protection of juveniles and brood fish. Because, first management action plan i.e.banning of exploiting less than 25 cm young Hilsa, was adopted in the year of 2004-2005 (Hoq, 2014). Nevertheless, all of those previous studies were not justifiable as these studies have carried out the stock assessment of Hilsa from both upstream and downstream water bodies through length frequency based FISAT (FAO-ICLARM stock assessment tools) package. In fact, this approach is not rigorous, and thus, the estimated exploitation rates are highly uncertain and would not form the basis of management decisions in most cases(BOBLME,2014).For this reason, alternative assessment preferences including Age-structured Integrated Assessments, life history-based modelling approaches like‘Leslie Matrix Models (LMMs)' and time-series catch based Surplus Production Models (SPMs) assessments are needed to formulate effective management action plan for this fishery.
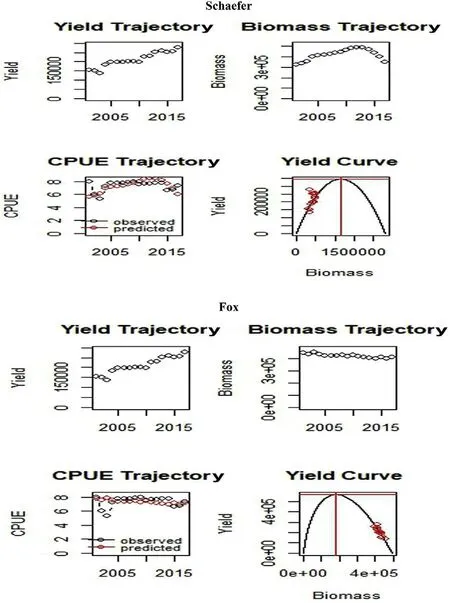
Fig. 4. Yield (t), biomass (t) and CPUE trajectory and yield curve for T ilisha found from the production models of Schaefer and Fox by using TropFishR package.
4.1. Modelling approaches: surplus production models (assumptions,limitations and trends)
Sustainable management policy in capture fisheries are usually dependent on stock assessment outcomes.Therefore,it is essential for the fisheries scientists to provide a consistent illustration of stock dynamics and stock status to the supreme authorities (Lynch, Shertzer, & Latour,2012).One of the key apprehension of this study was to assess the BRPs(i.e. MSY, F ratio, B ratio) of T. ilisha of the downstream zones of Bangladeshi waters through SPMs by using software packages of ASPIC,CEDA and TropFishR.
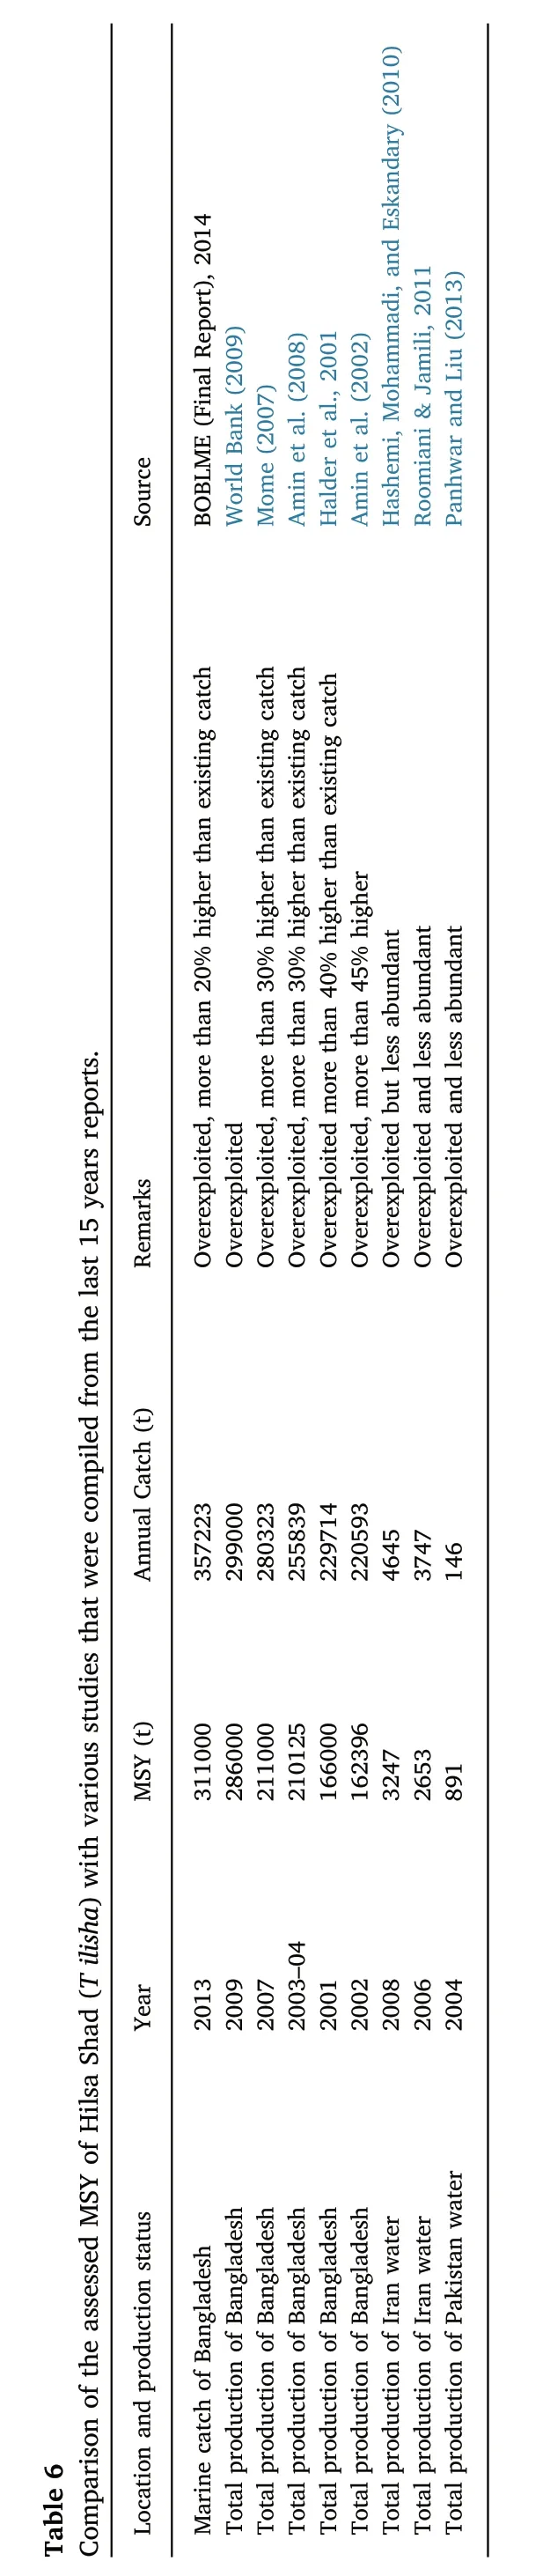
Table 6 Comparison of the assessed MSY of Hilsa Shad (T ilisha) with various studies that were compiled from the last 15 years reports.Source Remarks Annual Catch (t)MSY (t)Year Location and production status BOBLME (Final Report), 2014 World Bank (2009)Mome (2007)Amin et al. (2008)Halder et al., 2001 Amin et al. (2002)Hashemi, Mohammadi, and Eskandary (2010)Roomiani & Jamili, 2011 Panhwar and Liu (2013)Overexploited, more than 20% higher than existing catch Overexploited Overexploited, more than 30% higher than existing catch Overexploited, more than 30% higher than existing catch Overexploited more than 40% higher than existing catch Overexploited, more than 45% higher Overexploited but less abundant Overexploited and less abundant Overexploited and less abundant 357223 299000 280323 255839 229714 220593 4645 3747 146 311000 286000 211000 210125 166000 162396 3247 2653 891 2013 2009 2007 2003-04 2001 2002 2008 2006 2004 Marine catch of Bangladesh Total production of Bangladesh Total production of Bangladesh Total production of Bangladesh Total production of Bangladesh Total production of Bangladesh Total production of Iran water Total production of Iran water Total production of Pakistan water
CPUE is assumed as to be proportionate to the fish population that is used as the relative abundance index. Numerous population dynamic models were used for projecting the relative abundance index in order to achieve the forthcoming values of predicted entire abundance by multiplying with a constant (catchability coefficient, q) (Hinton &Maunder, 2004).Actually, there were two mathematical approaches in fisheries science (i) Surplus production models considered to be the earliest approach, initially recommended by Schaefer (1954) and then by Fox(1970)and(ii)the“YPR”or yield-per-recruit analysis(Beverton& Holt, 1957) is the second approach. Between them, SPMs are the sensible approach due to their holistic or simplicity in nature. The surplus production models can define the level of effort at which a fishery produces a maximum yield of a fish stock in a sustainable means without changing the long-term productivity that is designated as MSY(Sparre & Venema, 1998).
In the study of fish population dynamics,surplus production models are the foremost conventional well-organized tools for estimating fish stock when the data encompass with time series of landing and abundance index for an exploited population. Although, they are not as realistic as age-structured models but are convenient for signifying the concerned aspects in yield policies (Jensen, 2002). Occasionally they may provide better estimates of BRPs (biological reference points; i.e.MSY, F ratio and B ratio) than the age-structured models (Prager,2002). Equilibrium approaches undesirably exaggerate the MSY because of the consideration of the continued altering nature of the fisheries in the realistic world.Therefore,nowadays it is suggested that if possible the non-equilibrium SPMs can be used in anywhere. Furthermore, numerous studies have reported that the non-equilibrium SPMs may provide better answers that are sometimes more suitable for management purposes as compare with age-structured models(Haddon, 2011, p. 449).
The concept of reference points (RPs), which is presently a part of FAO code of conduct for responsible a fishery that was first originated in 1992(FAO,1995).Managerial goals and assessment of fishery status is generally based on these reference points in the science of fishery management (Hoggarth et al., 2006). These, RPs are widely classified into two main types i.e. TRPs (target reference points) and LRPs (limit reference points) which are detrimental fishery points that must be avoided or otherwise the fish stock shall suffer(Caddy&Mahon,1995;Cochrane, 2002). RPs assist fishery managers in making decision and policy framing. When fishing mortality (FMSY), for instance, crosses BMSYlimit then fishing will be stop. However, when it is below BMSYfishing may be continued.This simple decision making rule is known as“pulse fishing”in fishery management science(Caddy&Mahon,1995).
When the managerial goal is to estimate the possible catch hypothetically,then commonly three RPs or indicators viz.MSY,FMSYand BMSYare used. The concept of MSY was originated in 1992 for the first time (FAO, 1997, pp. 1-82). Afterward, it was included in the UN Convention on the Law of the Sea (FAO, 1995) and UN Fish Stock Agreement defined MSY in terms of FMSYand BMSYin 1995 (Hoggarth et al.,2006).MSY is more advantageous than other others RPs because of its protuberance in previous fisheries stock assessment studies(Smith& Punt, 2001). Normally, when both the computed MSY and catch figures are equal the fishery stock is considered in equilibrium. However, when estimated MSY is lower than catch values it means that fishery stock is overexploited which must be restricted to protect this resource for future. Conversely, when computed MSY is higher than catch statistics, it means fishery stock is flourishing and, even more,fishing is allowed up to the estimated MSY. It was suggested that FMSYshould be taken as lower bound of LRPs (Hoggarth et al., 2006) while Gabriel and Mace (1999) described that FMSYis upper bound for LPRs.Consequently, TRPs should be kept underneath MSY level. TRPs for MSY should be checked very carefully.Underestimated MSY will cause economic losses and if the MSY,conversely,is overestimated the fishery stock shall decline in future (Smith & Punt, 2001). It should be kept in mind that RPs are indicators and does not stipulate stable quantities.Their indication does not allow constant yield rather they should be noted as overfishing alarms (Rosenberg, Fogarty, Sissenwine,Beddington, & Shepherd, 1993).
Fish stock distributions can vary comprehensively even in their untouched or under-utilized state,due to the changes in environmental factors and interactions with other species (Hilborn & Walters, 1992).Some researchers have pointed out that if the surplus production is greater than the capture it means the population size increasing when the capture is greater than surplus production the population has a diminishing trend. Similarly, when the catch and surplus production give the equivalent score,it revealed a constant trend in fish population size (Hilborn & Walters, 1992; Prager, 2002).
Diagnosis of best fit model is an extremely key factor of the analysis(Haddon, 2011, p. 449). Available catch and effort data and aims of analysis are the main aspects, which are required in selection of SPMs.In general, even all the SPMs give almost identical parameters results variations may be present because of the model assumptions (Prager,2005). The results will be independent to some un-testable biological assumptions even though two or more models calculated similar estimates for parameters. It is generally better to examine more than one production models and then obtained results may be compared to select the best fit (Hoggarth et al., 2006). Various reference points (RPs) of fish resource can be estimated with the use of best fitting of data gathered by using model parameters (Hoggarth et al., 2006).
Goodness of fit(R2)of the SPMs is also very useful in choosing bestfit model which is based upon two factors.First,the obtained R2values and these values, however, must not be used alone. Second, the visual inspection of graphs,fit between experiential and predicted data points,is a necessary constituent while selecting best model. High R2values should not be considered if the graphs show poor fit (Hoggarth et al.,2006).
4.2. Analysis of CEDA outputs
CEDA package is restricted to three surplus production models of Fox,Schaefer,Pella-Tomlinson with three error assumptions of normal,log-normal and gamma from which we can assess the MSY and other related parameters for defining fish stocks. It is comparatively easy menu-driven software and having facility to estimate the assurance intervals and produce output plots (Hoggarth et al., 2006). CEDA can assess the parameters values and confidence intervals through bootstrapping, projection and practical diagnostic tools (goodness of fit &residual plots). The estimated outputs from this study, which are illustrated in Table 2,similar value of MSY are observed from Schaefer and Pella-Tomlinson models than that of Fox model.Actually,these models are largely dependent upon the IP value, increase or decrease of this value greatly affect the output parameters from CEDA. In the current study, initial proportion IP=0.6 was used as the initial catch was approximately 60% from the maximum catch and estimated MSY ranged from 282,223 t to 2033,083 t for three models of SPMs found from CEDA package (Table 2). All of the MSY values were higher than the last catch(Table 1)which represent suitable and safer stock of T.ilisha.Another key finding of this analysis was intrinsic population growth rate (r) which is very useful to demonstrate the resilience (Froese &Pauly,2015;Martell&Froese,2013;Froese,Demirel,Coro,Kleisner,&Winker, 2017) and also it is related with natural mortality of a species(Froese et al., 2017). In this study, Fox produced very high (2.63 and 2.72; for normal and lognormal error assumptions) value than that of Schaefer (normal error assumption). Previously, Panhwar and Liu(2013) also estimated the higher value of intrinsic population growth rate (r) of the same species by using CEDA packages in their study.According to the user guide of Froese et al. (2017), a resilience of the parameter r can be high (0.6-1.5), medium (0.2-0.8), low (0.05-0.5)and very low (0.015-0.1). Among them, high resilience can be determined by when the minimum population doubling time is less than 15 months (Froese et al., 2017).
Actually, this trend of the enhancement of the stock of Hilsa shad throughout the downstream zones was primarily started from the year of 2011 (Table 1), when foremost declaration of prohibition of capturing gravid fish was activated.Based on the R2(goodness of fit)values and analyzing the illustration of expected and observed catch from Fig.2,it is concluded that the Schaefer model provide better fit to those data which are also close to the existing catch than that of Fox.
4.3. Analysis of ASPIC results
Generally,it is considered that package ASPIC(a surplus production model incorporate covariates) holds more flexibility than CEDA (catch and effort data analysis). One of the key difference between these softwares - ASPIC permits analysis of multi-fleet data sets whereas CEDA have no option of this type of analysis. One more difference of these packages, ASPIC does not show more sensitivity to initial proportion (IP) as compared to CEDA package. In this study, the assessed values of MSY (Table 2) by applying ASPIC packages for the downstream captured Hilsa shad of Bangladesh were 324,100 t and 262,500 t for Fox and Logistics (Schaefer) production models respectively. Estimated MSY value of Schaefer was slightly lesser than the recent catch while Fox showed greater MSY.Except carrying capacity(K)and F ratio(Schaefer) of both assumption by ASPIC was found smaller than the CEDA assumptions.In addition,the computed BRPs values of MSY from the Schaefer showed best fitting of the data than that of Fox by ASPIC.From the above study,it is understood that the commercial downstream Hilsa shad catch fishery of Bangladesh are now retaining a stabilize position and current action plan that was adopted by the authorities are now functioning excellently.
4.4. TropFishR
This new package of R _Code software was used to assess recent fishing pressure and stock biomass in association with biological reference points which supports to formulate better management approaches for sustainable yield. This package allows assessing BRPs and other population parameters through application of production models which may be easier comparing with other packages because of their simple requirements i.e. time series (at least 10 years) catch or yield and fishing effort or CPUE(Mildenberger et al.,2017).In this study,we introduce this package TropFishR for the first time for estimating BRPs and population parameters and MSY levels of T ilisha, through using downstream (Marine and coastal catch) catch data from 2001 to 2017.The estimated values of MSY were found 345,486 t for Schaefer assumptions and 569,499t for Fox assumption (Table 2). The estimated value of MSY from the Schaefer is smaller than that from Fox model and both of them are larger than the recent catch (Fig. 4). In case of other BRPs i.e. B ratio and F ratio, only F ratio of Fox showed slightly higher value (greater than 1) but more suitable values (greater than 1) of B ratio were found from this package. Therefore, it is concluded that the MSY and other parameters found from this package indicate that the downstream Hilsa shad catch fishery is now running with the sustainable exploitation.
4.5. Effectivity of the existing management plan
Throughout the downstream area (marine and coastal) in Bangladesh, not only Hilsa and but also other commercially important marine fisheries have been suffered by a combination of various issues viz. severe recruitment over-fishing (indiscriminate concentration of gravid fishes)and growth over-fishing(unselective harvesting of young‘Jatka'). For this reason, prohibition of industrial trawling activities is taking place from the mid of May to the end of July by the Department of Fisheries (DoF). Actually, migratory fishes like Hilsa starting their upstream spawning migration(marine water to freshwater)during this period and lastly, enter to the freshwater zones for breeding. At that time,large numbers of adolescent and fishes gravid are being harvested through using various non-selective fishing gears during their rapid movement. In these situations, considering the significance of Hilsa fishery in employment and economy as well as nutrition, the Hilsa Fishery Management Action Plan (HFMAP) was primed for the improvement, management and conservation of Hilsa fishery combining the purposes of nursery ground protection and breeding grounds protection and prohibition of the capturing young Hilsa indiscriminately since 2010 (Rahman et al., 2015). Nevertheless, such a ban, artisanal fishers roam for fishing to nearby littoral waters of 10-40 m depth and Hilsa are the major targeted fish in that period (Rahman et al., 2015).The fishing consequence not only shrinks population but also create variations in the species inter-relations (Nikolskiii, 1980, pp. 1-323).
From the above discussion, it is proved that proper conservation of mother Hilsa through considering the exact breeding time as well as protection and prohibition of harvesting of young or juvenile Hilsa(Jatka)assists to upsurge production throughout the downstream zones(Marine and coastal). The supreme authorities ‘fisheries department',various administration and law-enforcement agencies are now engaged to implement the scheme of proper rebuilding of Hilsa stock not only in the downstream zones but also in upstream or riverine zones of the country (Rahman et al., 2015). Assessed MSY of Hilsa Shad (T. ilisha),which were compiled from the earlier studies of the last 15 years that mainly stated over-exploitation (Table 6) and so far as of our current study may be the maiden expression of the safer stock of Hilsa shad(T.ilisha) in the Bay of Bengal. Therefore, it may be an ample example for other Hilsa producing countries of the world, which are now facing stock reduction problems considering this action plan of Bangladesh to be the role models of Hilsa stock reappearance.
5. Conclusion
The current study represents that the stock of Hilsa shad are now in safer condition in the downstream zones of Bangladesh which also proves the effectivity of the ongoing management strategies of “Hilsa management action plan”. However, in order to continue this exploitation trends as well as sustainability of this fishery,further studies on age-structure analysis through otolith observation, migration route mapping and ecosystem analysis or eco-modelling of the Hilsa nursing or breeding grounds are needed by using various newly developed method to understand better of the population characteristics of this fishery.
Acknowledgement
The first author would like to express appreciation to the Chinese Scholarship Council (CSC) and SOA (State Oceanic Administration) for the sponsorship during his doctoral degree. This work is supported by the special research fund of Ocean University of China (201022001).
 Aquaculture and Fisheries2019年4期
- Aquaculture and Fisheries的其它文章
- Natural versus synthetic anesthetic for transport of live fish: A review
- Methane and nitrous oxide emissions in rice-crab culture systems of northeast China
- Increased pCO2 changes the lipid production in important aquacultural feedstock algae Isochrysis galbana, but not in Tetraselmis suecica
- Effects of fermented protein feed on the growth performance of pond-raised crab
- Comparative age and growth of Uroteuthis chinensis and Uroteuthis edulis from China Seas based on statolith