Methane and nitrous oxide emissions in rice-crab culture systems of northeast China
Ang Wang, Xuzhou Ma, Jing Xu, Weiqun Lu
a National Demonstration Center for Experimental Fisheries Science Education, Shanghai Ocean University, 999 Huchenghuan Road, Shanghai, 201306, China
b Key Laboratory of Exploration and Utilization of Aquatic Genetic Resources, Ministry of Education, Shanghai Ocean University, 999 Huchenghuan Road, Shanghai,201306, China
c Key Laboratory of Freshwater Aquatic Genetic Resources, Ministry of Agriculture, Shanghai Ocean University, 999 Huchenghuan Road, Shanghai, 201306, China
d Shanghai Engineering Research Center of Aquaculture, Shanghai Ocean University, 999 Huchenghuan Road, Shanghai, 201306, China
e Shanghai Collaborative Innovation for Aquatic Animal Genetics and Breeding, Shanghai Ocean University, 999 Huchenghuan Road, Shanghai, 201306, China
f Panshan County Meteorological Bureau, Hongqi Road, Liaoning, 124000, China
Keywords:Rice-crab integrated ecosystem Methane Nitrous oxide Rice yield Global warming potentials Net ecosystem economic budget
A B S T R A C T Rice-crab integrated ecosystem has been confirmed to improve the ecological environment and brought greater economic benefits.In order to know greenhouse gases methane(CH4)and nitrous oxide(N2O)emissions in ricecrab system, they were quantified from a flooding rice field in northeast China, as affected by integrated ricecrab cultivation. Three treatments with three replications each were given: (1)RC1-rice with crab(megalopa),(2) RC2 - rice with crab (juvenile), (3) RM - rice only. Seasonal CH4 and N2O fluxes were measured by closed chamber method. Compared with RM treatment, RC1 and RC2 treatments greatly enhanced the cumulative seasonal CH4 emissions(by 36.8%and 29.2%,respectively),and reduced the cumulative seasonal N2O emissions(by 28.2% and 19.7%, respectively). Across treatments, CH4 represented over 97% of total global warming potential (GWP) and as a result, RC1 and RC2 treatments significantly increased the GWP than RM treatment.Although the GWP was highest in RC1 treatment,it provided highest rice yield(8780 kg/ha)and net ecosystem economic budget (NEEB, 23,159 Yuan/ha) over RM (7668 kg/ha, 15,130 Yuan/ha) and RC2 (8042 kg/ha,18,713 Yuan/ha)treatments.To summarize,cultivation of megalopa in rice field is a better strategy to optimize the economic and environmental benefits in northeast China.
1. Introduction
Carbon dioxide (CO2), methane (CH4), and nitrous oxide (N2O) are the three major gases leading to global warming (Lashof & Ahuja,1990).The concentrations of CH4and N2O in the atmosphere are much less than that of CO2, while their global warming potential (GWP) is approximately 25 and 298 times greater over a time span of 100 years,than that of CO2, respectively (Zhang et al., 2016). A man-made wetland, the rice field is considered to be a main source of CH4and N2O emissions due to water and nutrient management practices (Akiyama,Yagi, & Yan, 2005; Hadi, Inubushi, & Yagi, 2010; Linquist et al., 2012;Zou et al., 2009). Globally, the gross CH4emissions from rice paddies were accounted at approximately 20-40 Tg/yr,while the total N2O was assessed to be 1.7-4.8 Tg/yr from overall farmland area (Yan et al.,2009;Yao et al.,2010).China is one of the major rice producers in the world, accounting for 16% of the global rice planting area (Xu et al.,2015). Evaluations of total CH4and N2O emissions from Chinese rice fields were 6-10 Tg/yr and 32-51 Gg/yr,respectively(Liu et al.,2015).
The emissions of CH4and N2O are comprised of production, conversion, and transportation processes. Methanogenic archaea can produce CH4by breaking down organic matter in oxygen-poor conditions(Conrad,2006;Huang et al.,2005).At the same time,CH4transformed in the environment can be partly oxidized to CO2by methanotrophs in aerobic zones (Brune, Frenzel, & Cypionka, 2000; Chen et al., 2013a).Then, it is expelled into the atmosphere mostly through plants, aerenchyma, rarely through ebullition and diffusion from the sites of production(Aulakh,Wassmann,&Rennenberg,2001;Schutz,Seiler,&Conrad, 1989). Nitrification and denitrification processes occurring in appropriate soil regions simultaneously can produce N2O (Hu et al.,2013). Nitrification takes place where sufficient oxygen (O2) exists,while denitrification requires anaerobic conditions. It is commonly assumed that only small amounts of N2O are emitted from rice fields under waterlogged conditions, because N2O as an obligate intermediate, would be ultimately reduced to nitrogen (N2) as a result of oxides limitation (Kampschreur et al., 2009; Li et al., 2009). Furthermore,because it is easily soluble in water,N2O has more opportunities to be reduced (Tumendelger et al., 2016; Weiss & Price, 1980). N2O mainly diffuses from soil to atmosphere if there is no water layer. On the contrary, rice plants emit N2O when the soil is flooded (Yan et al.,2000). Many reports have indicated that the fluxes of CH4and N2O from rice fields are implicated in many factors, such as fertilization,water regime, tillage, and cultivation (Cai et al., 1997; Xu et al., 2015;Zhang et al. 2014, 2016; Zhou et al., 2015).
Rice-fish culture is a typical model combining planting of rice and rearing if fish in the rice field with a long history in China (Feng et al.,2016; Frei et al., 2007b; Li, 1988; Mirhaj et al., 2013; Mohanty et al.,2010; Saiful Islam, Barman, & Murshed-e-Jahan, 2015). O2deficiency and other conditions that increase organic carbon levels are characteristic of rice-fish cultivation system, which promote the CH4emission and depress the N2O emission (Bhattacharyya et al., 2013; Datta et al.,2009;Frei&Becker,2005;Frei et al.,2007a).The Chinese mitten crab, Eriocheir sinensis (hereafter referred to simply as crab), is one of the most important commercial crustacean species and a popular food in Southeast Asia (Zeng et al., 2013). The total production of crab reached 796,622 metric tons in 2014 in China(Yuan et al.,2017).After the successful application of rice-fish integrated culture, farmers in northern area attempted to introduce the crabs into rice fields and gained good economic benefits(Li et al.,2007).In order to adapt to the growth cycle of rice, two models have been used in rice fields: one is rearing megalopa (June to October), the other is rearing juvenile crab(June to September). Many researches have focused on the ecology,feeding habits, yield, and food web structure in rice-crab culture, and came to the conclusion that crab rearing in rice field could improve the ecological environment and bring greater economic benefits(Guo et al.,2015; Li et al. 2007, 2013b; Xu, Ma, & Wang, 2014). However, little is known about CH4and N2O emissions in rice-crab paddy fields. This study conducted an experiment to(1)estimate the effect of crab rearing on the amount of CH4and N2O emitted from rice fields; (2) determine the dependence of CH4and N2O emissions on soil and water characters in rice-crab culture system; and (3) assess the effect of the rice-crab systems on the environment in comparison with their economic benefits for the farmers.
2. Materials and methods
2.1. Experimental sites and design
The field used in this experiment was located in Jiangjia village(122.26 E, 41.17 N) in Panjin city, Liaoning province in northeast China, with a temperate, warm, monsoon climate. The annual temperature and precipitation are about 8.6°C and 627 mm, respectively.The temperature and rainfall levels during the experimental period are presented in Fig. 1a. The soil properties determined in May 2013 are shown in Table 1.
Three replications of three treatments were conducted:(1)RC1-rice with megalopa,(2)RC2-rice with juvenile crab,and(3)RM-rice only.The experimental field was divided into 9 equal plots (each area 10 m×10 m). Each plot had its own water inlet and outlet gates covered with nylon nets (mesh size 1 mm) to filter debris, wild fish and aquatic predators, and to prevent the loss of crabs. A 40 cm high polyethylene membrane was fixed around each plot to prevent crabs from escaping.Ridges(100 cm wide and 50 cm high)between the plots were covered with plastic film and anchored 30 cm into the soil to prevent lateral spreading of water and fertilizer.All plots were fertilized and tilled on 27 May,then flooded and levelled on 30 May.N(urea),P(calcium superphosphate), and K (potassium sulfate) fertilizers were applied once at a rate of 160 kg N, 70 kg P2O5, and 80 kg K2O/ha for each plot.
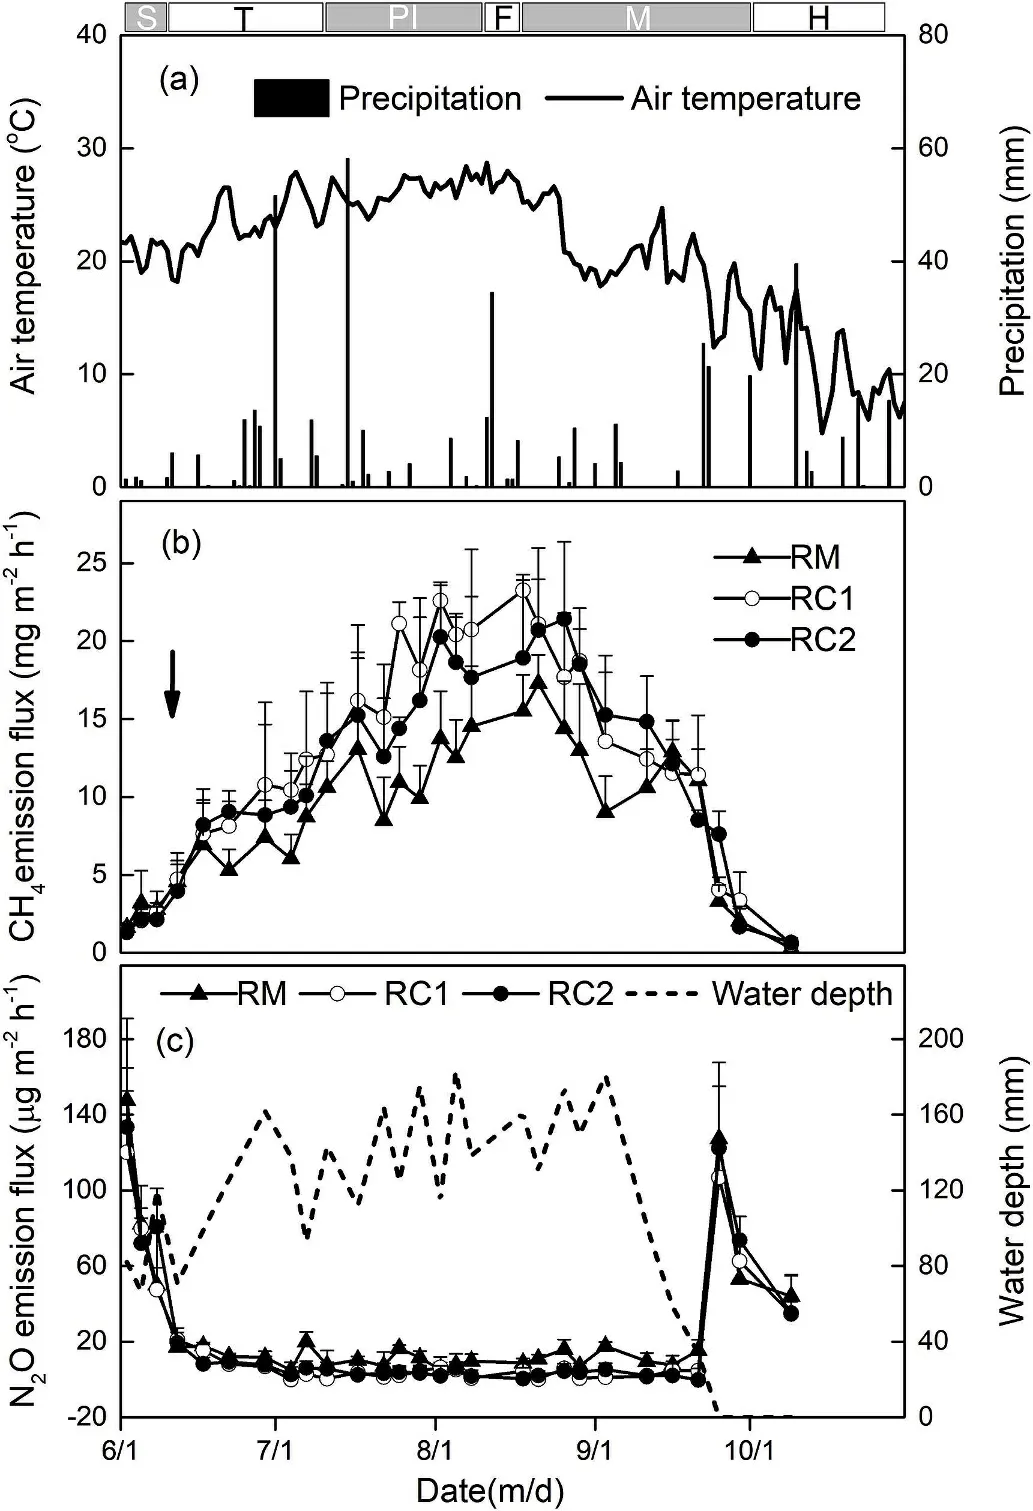
Fig. 1. (a) Air temperature and precipitation, (b) CH4 emissions, and (c) N2O emissions with corresponding floodwater depth, over the rice growing season.Dates of rice seedling, tilling, panicle initiation, flowering, maturation, and harvesting for the rice growing season are indicated by S, T, PI, F, M, and H,respectively. Arrow bars denote the time of crab released (8 days after rice seedling transplanting).

Table 1Soil (0-10 cm) properties in paddy fields.
The cultivar of rice (Oryza sativa L.) was Yanjing 456, provided by Liaoning Academy of Agriculture Sciences. On 1 June, thirty-five dayold rice seedlings were transplanted at a planting distance of 30 cm×15 cm. During the rice growth period, all plots were flooded,and there were no pest or weed control measures in all plots.The crops were harvested at 1 October. The crabs (megalopa and juvenile) were provided by Panshan Research Institution of Crab Technology. The megalopa (average weight 5 mg) and juvenile (average weight 12 ± 1.5 g) were stocked at 1,200,000 and 6000 ind./ha on 9 June,respectively. They were fed with a compound feed (crude protein≥35%, crude fat ≥5.5%, crude fibre ≥9%, crude ash ≤15%, total phosphorus ≥1%)purchased from Wellhope Agri-tech Joint Stock Co.,LTD. (Shenyang, China). The crabs were fed once at 5 p.m. every day,and the feeding rate was adjusted based on the assessment of the leftover feed.In addition,crabs in the RC1 plots were not given food from 21 August to 15 September to decrease the rate of precocity (Li et al.,2011a). The total amounts of food provided for RC1 and RC2 treatments were 859 kg/ha and 613 kg/ha, respectively. The crab in RC1 and RC2 treatments were harvested on 20 October and 25 September,respectively.
2.2. Measurement of CH4 and N2O fluxes
The closed-chamber method was adopted for the measurement of CH4and N2O emissions(Das&Adhya,2014).A square aluminium alloy base(55 cm per side),with a channel to accommodate the chamber and water to ensure a sealed condition, was permanently fixed in the field soil at the sampling site throughout the cropping season.The sampling chamber made of acrylic plate,with a size of 50 cm×50 cm×110 cm,was placed in the grooves of the base over six hills of rice seedlings enclosed within the base. An electric fan, fixed on the top of the chamber, was used to mix the gases. In addition, a rubber tube was inserted through the wall of chamber, and was connected outside to a three-way stopcock. Gas samples were collected every 5 days on average,for a total of 28 times from 3 June to 11 October,covering the entire rice growing season.In each plot,a board collecting the chamber and the ridge was built to reduce soil disturbance.Gas sampling usually began at 9:00 in the morning, and the chamber was closed for 30 min.During sampling,a layer of sponge and aluminium foil that enclosed the chambers prevented temperature increases from direct solar radiation.Gas samples were gathered at 0, 10, 20, and 30 min using 20 mL syringes through the three-way stopcock,and immediately transferred to a 100 mL aluminium foil gas sampling bag (Haide, Dalian, China) for future analysis.
The gas concentrations were detected by a gas chromatograph(Shimadzu GC-14B) equipped with a flame ionization detector (FID),electron capture detector (ECD) and a 6-1/8-fit stainless steel column(Porapak Q, 3 m length×2 mm inner diameter) (Li et al., 2009). For CH4analysis, the injector, column and detector (FID) temperatures were 100°C, 55°C, and 200°C, respectively. The carrier gas (N2), fuel gas (H2), and supporting gas (zero air) were 330 mL/min, 30 mL/min,and 400 mL/min, respectively. For N2O analysis, the injector, column,and detector (ECD) temperatures were 100°C, 65°C, and 300°C, respectively.The carrier gas(N2)flow was maintained at 40 mL/min.The fluxes of CH4and N2O were calculated according to the following equation (Xu et al., 2015):

Where F is the gas emission flux(mg/(m2·h)for CH4,μg/(m·h)for N2O);dC/dt is acquired by the linear regression equation between the gas concentration and sampling time (μL/(L·h) for CH4, nL/(L· h) for N2O);and H,ρ,and T are height of water surface to the top of the sample box(m),CH4or N2O density(kg/m3)at the standard state and temperature(oC), respectively.
The total emissions of CH4and N2O during the study period were calculated as sums of the fluxes between every two sampling intervals of measurements, described by Li et al. (2013a).
2.3. Estimation of GWP and net ecosystem economic budget (NEEB)
GWP is a relative measurement of how much heat a greenhouse gas prevents from being released into the atmosphere. We used the following equation to calculate the combined GWP, which was expressed as kg CO2-eq./ha.

The NEEB components of rice-crab culture systems are summed up to evaluate the economic feasibility according to the following equation(Zhang et al., 2015):
NEEB = Yield gains - Production costs - GWP costs
2.4. Soil and water analyses
The water depth was read directly from a scale.Oxygen dissolved in flooding water(DO,mg/L)was measured using a portable DO detector(550a,YSI,USA).Soil temperature(oC)was determined at 5 cm using a temperature probe. Soil nitrate (NO3--N, mg/kg soil) from fresh soil samples was extracted by 2 mol/L KCl and determined from water extracts using the phenol disulphonic acid method (Kumar et al., 2000).Dissolved organic carbon (DOC) in soil was detected according the method proposed by Jiang et al. (2006).
2.5. Rice parameters and yield, crab yield
An area of 1 m2(18 hills) was selected randomly within an individual replicated plot on 1 October.Grains were sun-dried to constant weight (14% moisture content) and then weighed. The grain yields were recorded as kg/ha. Crab fed in replicated plots were caught (juvenile from 18 to 25 October,adult from 22 to 25 September),weighed,and recorded as kg wet biomass/ha.
2.6. Statistical analysis
Two-way ANOVA analysis was perf ormed with SPSS 19.0 to analyze the effects of cultivation systems and sampling times on the flooding water DO, soil NO3-, and DOC concentrations, with the cultivation system treated as the main factor.Differences between the means were performed by Duncan's multiple range tests (DMRT). Regression analysis was applied to evaluate the relationships among the gases fluxes with environmental factors. Origin 9.1 was employed to prepare figures.
3. Results
3.1. Rice yield and crab productivity
The rice yields ranged from 7668 (in RM) to 8780 (in RC1) kg/ha(Table 2). Thus, compared with the rice-only field, rice-crab fields produced visible increases in rice yields, although it was onlystatistically significant (P <0.05) between RC1 and RM treatments.The yields of crab in RC1 and RC2 treatments were 1086 ± 170 and 319 ± 46 kg/ha (Table 2), respectively.

Table 2Changes in grain and crab yields, cumulative seasonal emissions of CH4 and N2O, and GWP under different treatments.
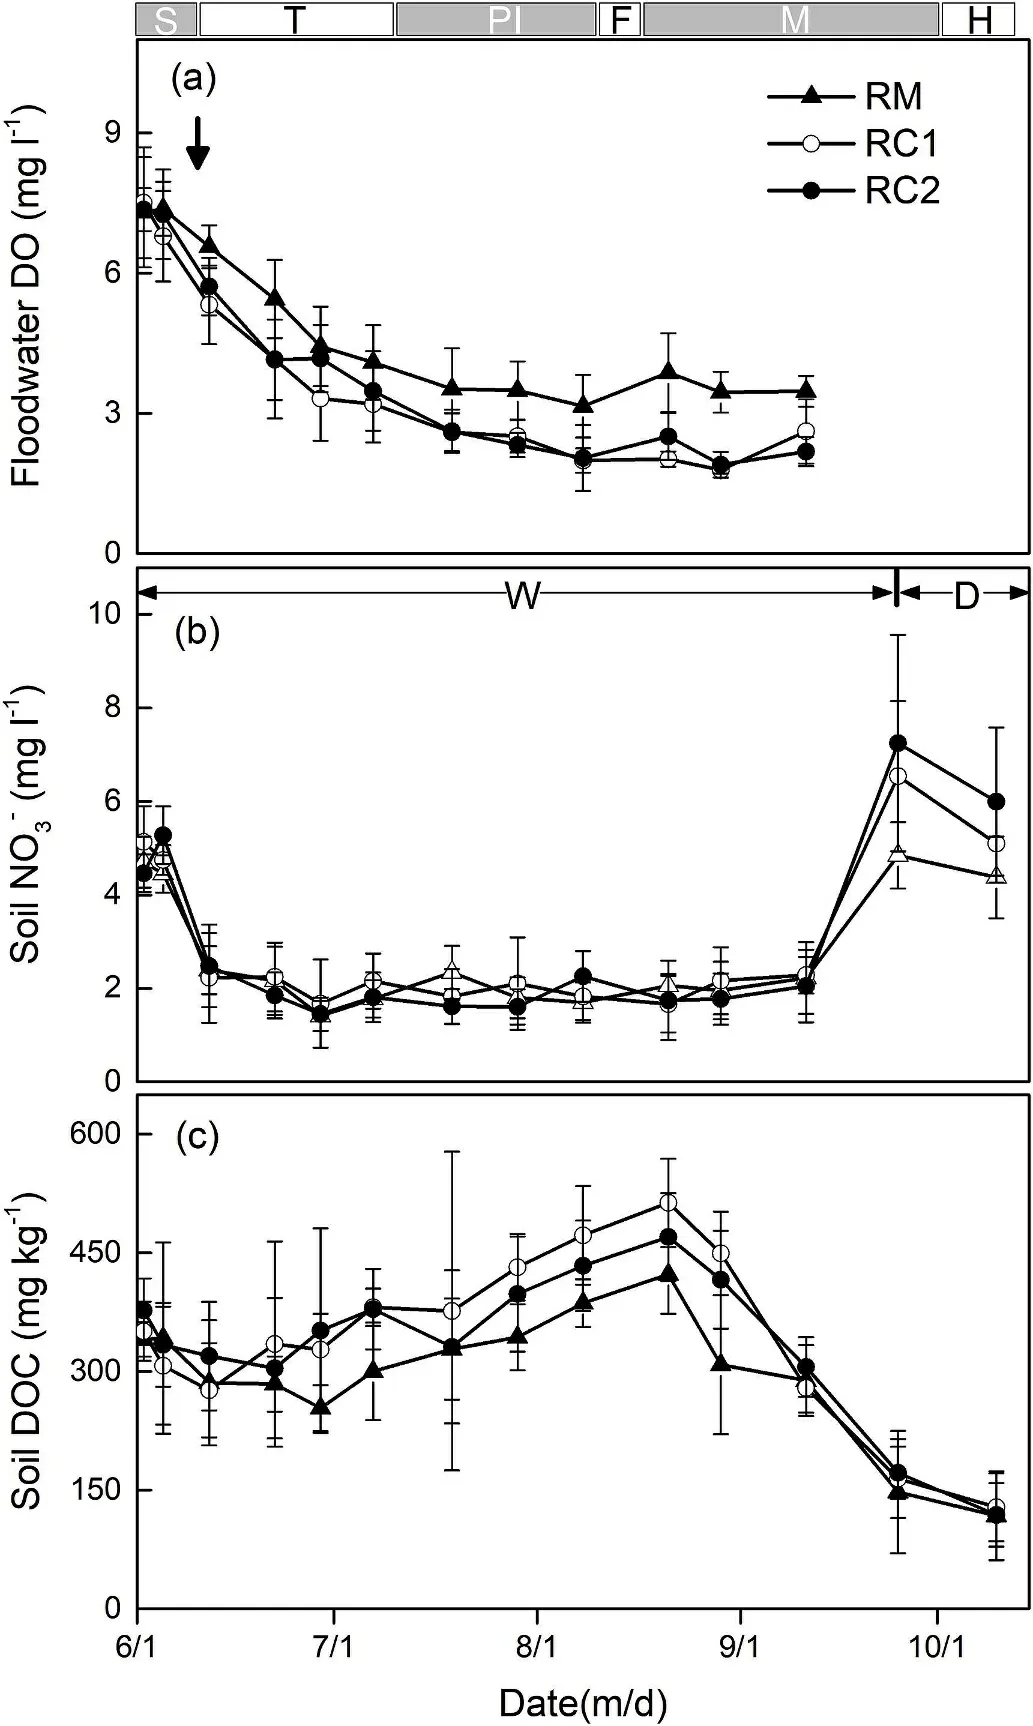
Fig. 2. Concentrations of floodwater DO (a), soil NO3-, (b) and DOC, (c)during the rice growing period. The error bars represent standard deviations(n=3).Dates of rice seedling,tilling,panicle initiation,flowering,maturation,and harvesting for the rice growing season are indicated by S,T,PI,F,M,and H,respectively. Arrow bars denote the time (8 days after rice seedling transplanting) of crab released. W and D indicate waterlogging and drainage, respectively.
3.2. Water and soil properties
Depth of flooding water depended on rice and crab growth stages(Fig.1c).At the seeding stage,the depth of flooding water was less than 10 cm. When the crabs entered the rice fields, water depth was kept over 15 cm. During the maturation stage of rice, all the fields stopped irrigation, and the flooding water naturally drained on September 25.
Fig. 2a shows the flooding water DO concentrations. The DO levels steadily decreased during the growing season in all fields.The mean DO levels in RM,RC1,and RC2 were 4.68 mg/L,3.65 mg/L,and 3.81 mg/L,respectively.Compared to RM,the flooding water DO concentrations in RC1 and RC2 were significantly lower (P <0.01). Soil NO3-contents(1.41-7.25 mg/L) increased with the N fertilizer applied, then decreased rapidly and maintained very low throughout the flooding period, followed by a rise due to drainage (Fig. 2b). There were no significant differences in soil NO3-contents among treatments(P >0.05). Soil DOC concentrations kept steady during the flooding stage,ranging from 253.75 to 513.32 mg/kg,but declined rapidly after the drainage (Fig. 2c). Compared with RM (mean: 296.45 mg/kg), soil DOC concentrations were increased by 15.5% (P <0.01) and 13.5%(P <0.01) in RC1 and RC2, respectively.
3.3. CH4 and N2O emissions
CH4emissions from rice fields were pronounced primarily during flooding (Fig. 1b). During the rice growing season, similar CH4flux patterns were observed for all three treatments. In general, CH4fluxes increased steadily until the flux peaks were attained in late August,before declining rapidly. CH4fluxes ranged from 0.27 to 23.27 mg/(m2·h) across the three treatments. Compared to RM, the introduction of crab into rice fields increased the CH4fluxes throughout the season.Average CH4fluxes for the RC1(12.33 mg/(m2·h))and RC2(11.57 mg/(m2·h1)) treatments were higher than the RM treatment (8.92 mg/(m2·h)).Not surprisingly,as compared to the RM treatment,cumulative seasonal CH4emissions for the RC1 and RC2 treatment significantly increased the CH4emissions by 36.8% (P <0.05) and 29.2%(P <0.05), respectively (Table 2).
Similar variations of N2O fluxes from different treatments are shown in Fig. 1c. The initially high N2O fluxes appeared following N fertilization and dropped rapidly due to the flooding water. Relatively low N2O fluxes occurred during the flooding period, and peaked on September 25 after drainage. N2O fluxes ranged from 4.9 to 147.6 μg/(m2·h)(mean:27.0 μg/(m2·h))for the RM treatment,0-120.2 μg/(m2·h)for the RC1 treatment (mean: 19.8 μg/(m2·h)) and 0-133.5 μg/(m2·h)(mean: 22.1 μg/(m2·h)) for the RC2 treatment. Crab rearing in rice fields depressed N2O emission. The seasonal cumulative N2O emission was 0.71 kg/ha from the RM treatment, significantly higher by 39.2%(P <0.05) and 24.6% (P <0.05) than the RC1 and RC2 treatments,respectively (Table 2).
3.4. Correlation analysis between gas emission and environmental factors
CH4emissions were negatively correlated with water DO and soil NO3-,but positively correlated with soil temperature and DOC(Fig.3).On the contrary,N2O flux was shown to have positive correlations with water DO and soil NO3-, but negative correlations with soil temperature and DOC (Fig. 4).
3.5. GWP and NEEB
The calculated GWP (kg CO2eq/ha) of the three treatments is shown in Table 2.From the GWP,the CH4accounted for 97.1%,98.5%,and 98.2%,while N2O had a comparatively lesser contribution of 2.9%,1.5%, and 1.8% in RM, RC1, and RC2, respectively (Fig. 5). The RC1 and RC2 treatments significantly increased the GWP by 34.9%(P <0.05) and 27.7% (P <0.05) compared with RM treatment.Among the three treatments, the RC1 treatment reached the highest NEEB, while the RM treatment resulted in the lowest (Table 3). In comparison, the RC1 treatment significantly outperformed the RM treatment by 53.1% (P <0.05) and the RC2 treatment by 23.8%(P <0.05).
4. Discussion
4.1. Effect of rice-crab culture on CH4 emission
CH4emissions are enhanced under anaerobic conditions, where methanogens produce CH4during the final step of anaerobic breakdowns of organic compounds in soils (Mer & Roger, 2001; Chen et al.,2013b). Therefore, rice fields are a main source of CH4emissions(Huang et al., 2005). As observed in this experiment, seasonal CH4emissions in all of the plots showed a steadily increasing trend,peaking at the flowering stage of the rice and dropping severely after these peaks (Fig. 1b). Similar results were also observed at other research sites (Cai et al., 1997; Chen et al., 2013b; Zhou et al., 2015; Kumar et al., 2016). The triggering factors in CH4emissions were (1) the anaerobic environment regulated by flooding water (Fig. 1c)(Wassmann & Aulakh, 2000), (2) increased carbon substrate from decayed leaves and root exudates (Watanabe, Hashimoto, & Shimoyama,1997), and (3) advanced aerenchyma in rice roots, stems, and leaves(Lu et al., 1999).
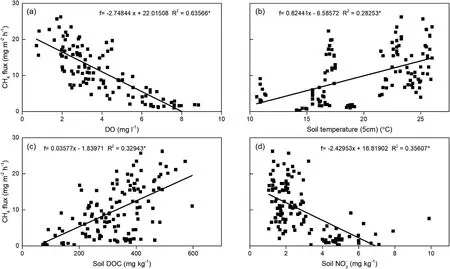
Fig. 3. Dependence of CH4 fluxes on soil and water parameters in the paddy fields. (a) DO; (b) Soil temperature (5 cm); (c) soil DOC; and (d) soil NO3-.
We also found significantly lower CH4emission rates after the final drainages (September 25, Fig. 1b). After draining, soil aeration increased with soil exposed to the air, consequently suppressing CH4producing activity and favoring the oxidization of CH4by methanotrophs, ultimately decreasing emissions (Woese, Magrum, &Fox, 1978). In addition, the lower soil temperature also significantly contributed to the relatively low CH4emissions (Fig. 3a), which is in accordance with previous studies (Zhong et al., 2016). Furthermore,aging and breaking of ventilation tissues in rice after drainage, restricted gas to transport from soil to atmosphere (Shao & Li, 1997).Remarkably,CH4emission had a significantly negative correlation with soil NO3-(Fig. 3d), which agreed with previous finding (Zhong et al.,2016).CH4production is inhibited by nitrite(NO2-),nitric oxide(NO),as well as N2O that amassed transiently during NO3-reduction, which are harmful to methanogenic bacteria (Klüber & Conrad, 1998).
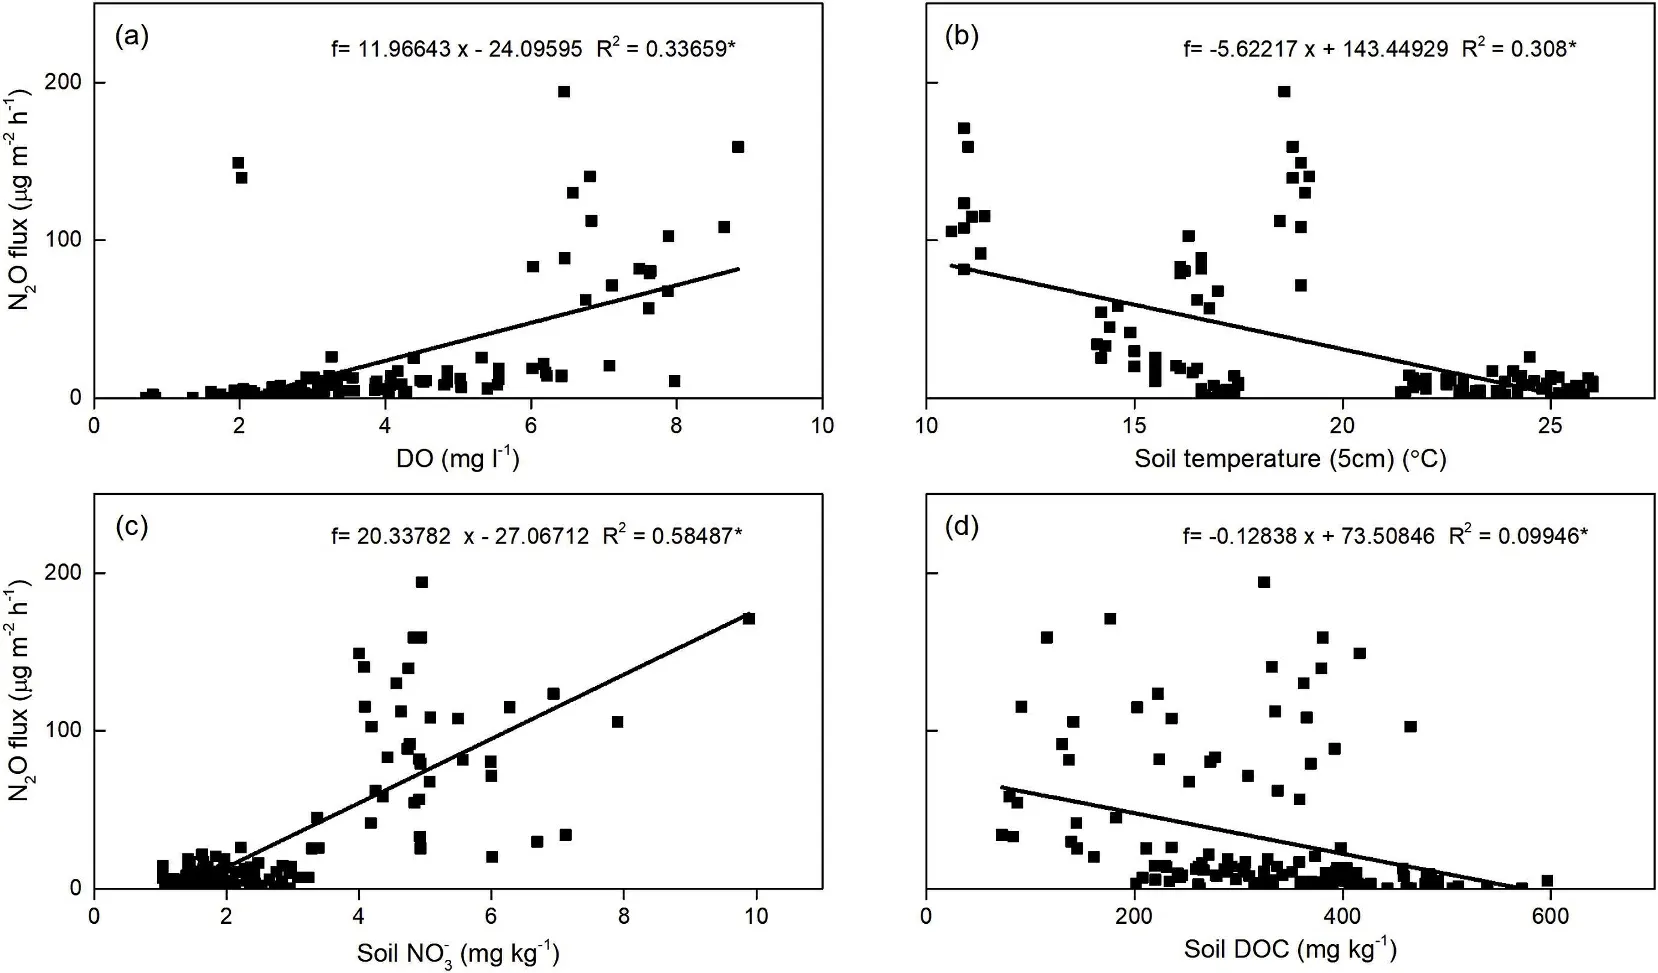
Fig. 4. Dependence of N2O fluxes on soil and water parameters in the paddy fields. (a) DO; (b) Soil temperature (5 cm); (c) soil NO3-; and (d) soil DOC.
In this study, CH4emissions were significantly higher in rice-crab systems as compared to rice monocultures, for which there would be three reasons. First, crab excrement and remnants of their food would have improved the DOC availability in the soil(Fig.2c),which would in turn have promoted CH4production and its subsequent emission(Pandey et al., 2014). Unsurprisingly, CH4emissions were positively related to soil DOC (Fig. 3c). Second, the presence of crab dropped the floodwater DO concentration, thus developed the anaerobic condition of the soil (Fig. 2a). In line with previous reports (Whiting & Chanton,2001; Huttunen et al., 2006; Datta et al., 2009), a significant negative correlation between CH4fluxes and DO concentration was found in the present study (Fig. 3a). High DO concentration would depress methanogens but promote CH4oxidation in the process of accumulation and transmission(Mer&Roger,2001).Third,crabs as a kind of zoobenthos,released entrapped CH4and accelerated the releasing of newly generated CH4by movement and predation. The entrapped CH4would be oxidized in aerobic zone (e.g. root zone and soil surface) rather than escaping to the atmosphere (Alberto et al., 2000). Disturbances of the sediment-water interface can lead to the CH4emission before further oxidation(Frei&Becker,2005).Thus,the CH4emissions were higher in rice-crab plots, owing to more CH4escaping from the soil from crab movement and predation. Similar results have been obtained in some rice-fish fields(Bhattacharyya et al.,2013;Datta et al.,2009;Frei et al.,2007b). However, Liu et al. (2015) reported that crab would reduce CH4production, through their activities and foraging on the surface of soil.This is because,the sediment carbon substrate for CH4production,which would be disturbed by the crabs' movement, was rapidly oxidized through artificial aeration of bottom surface by micropore aerators.
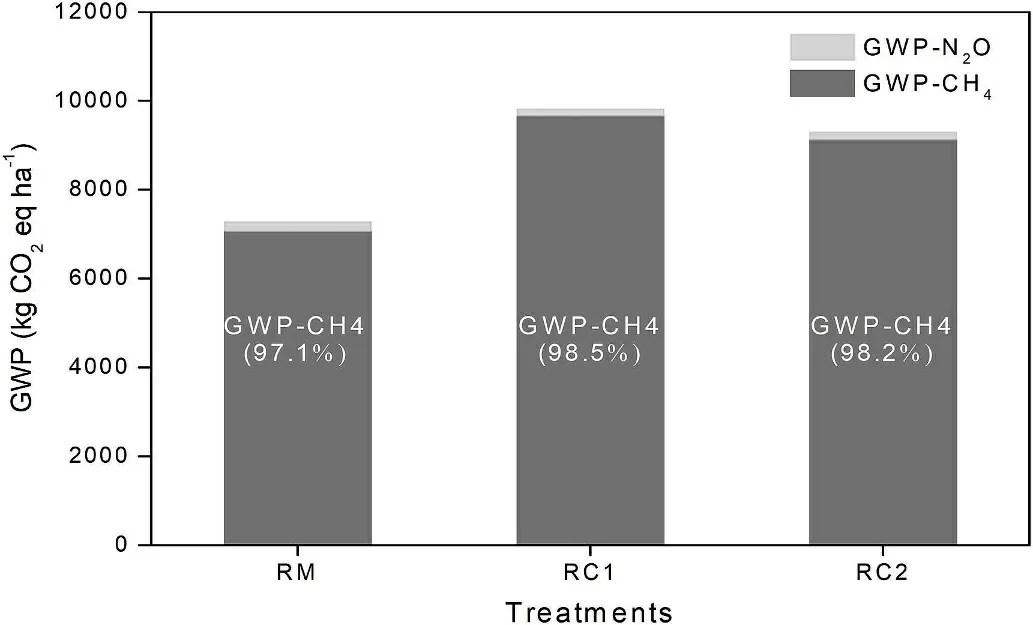
Fig.5. Total GWP in different treatments during the rice growing period.Value in brackets is the proportion of GWP-CH4 in the total GWP.
It was noteworthy that the RC1 treatment showed a higher CH4flux before 21 August (Fig. 1b). This was mainly because the crab yield in the RC1 treatment was much higher than the RC2 treatment(Table 2),which would provide more organic matter for microorganisms to produce CH4. Moreover, the juvenile crabs in the RC2 plots were always inactive during the daytime (Li et al., 2011b), while the disturbances from larva crabs in RC1 plots continued all day long, hence releasing more entrapped CH4.From 21 August to 16 September,CH4flux in RC1 treatment decreased rapidly and dropped below that of the RC2 treatment(Fig.1b),due to the interrupted feeding during 21 August and 15 September.Thus,this can account for the lack of a significant difference between accumulate CH4emissions observed in the two rice-crab treatments (Table 2).
4.2. Effect of rice-crab culture on N2O emission
The N2O emissions from rice fields prove to be mainly effected by soil moisture, nitrogen substrates, and organic carbon (Zou et al.,2007). Our data indicated that flooding water had substantially weakened N2O emissions from the plots (Fig. 1c). The initially high N2O emissions could be attributed to high available N from the fertilizer,the low water depth,and the high levels of DO.However,the application of mineral N fertilizer increased the available nitrogenous substrates and flooding water DO and strengthened nitrification and denitrification,ultimately leading to N2O emissions (Pandey et al., 2014). During the rice growth stage (i.e. 2 June to 11 September), the intensification of anaerobic conditions,due to consistent flooding and a deficiency of soil N substrates (due to rice absorption and substantial N loss), jointly reduced N2O fluxes (Fig. 1c). The N2O fluxes are generally low for flooded fields due to the lack of available O2in the soil environment,where denitrification processes reduce N2O to N2(Pittelkow et al.,2013).Furthermore,N2O emitted from soil dissolves so readily in water that it rarely passes through the water layer into the atmosphere(Pathak et al., 2002). After drainage, elevated N2O fluxes were monitored when the soil was exposed to the air(Fig. 1c).Then,the aerobic conditions were gradually created, promoting the synchronous nitrification and denitrification occurrence in residual soil N (Pathak et al., 2002). As a result, a large amount of N2O would have been emitted through the soil pores,rather than being reduced.Therefore the N2O flux had significant positive correlations with DO and soil NO3-(Fig. 4a and c). Similar results were reported in previous studies(Bhattacharyya et al.,2013;Datta et al.,2009;Liu et al.,2015;Tang&Maggi, 2012).
Some studies have reported that soil organic carbon (SOC) or soil DOC could promote N2O emissions from rice fields (Liu et al., 2015;Bordoloi, Baruah, & Maji, 2016). On the contrary, we found a significant negative correlation between N2O fluxes and soil DOC(Fig. 4d). This is most likely caused by the production of soil DOC,which consuming O2, which in turn creates an environment that favor the reduction from N2O to N2, which is consistent with the results reported by Millar and Baggs (2005). Moreover, for all the treatments,N2O fluxes were surprisingly negatively related to soil temperature(Fig. 4b), which implied that under the conditions of this experiment,temperature was not a constraint on N2O emission(Kumar et al.,2016;Wang et al., 2015).
Finally, the N2O emissions in rice-crab cultures were significantly lower than those in the rice monocultures (Table 2). The decreasing tendency of N2O emissions in rice-crab cultures could be explained by two reasons. First, as previously mentioned, a drop in the flooding water DO concentration occurred in the fields where crabs were being raised(Fig.2a).In these rice-crab plots,nitrification was limited due to the lack of O2, and thus produced less NO3-. Therefore, the soil NO3-concentration levels were not significantly different between thetreatments (Fig. 2b). On the contrary, denitrification might be carried out smoothly in these anaerobic environments and most of the intermediates were reduced to N2as alternative electron acceptor of NO3-,ultimately decreasing N2O emissions (Bhattacharyya et al., 2013).Second, Li et al. (2007) had demonstrated that crabs could suppress aquatic plants in paddy fields. According to Yan et al. (2000), N2O is mainly transported from the soil to the atmosphere (87.3%) via plant aerenchymas in flooded paddy fields. Thus, we inferred that crabs might weaken N2O transmission by consuming or killing weeds in rice fields.

Table 3Changes in NEEB under different treatments.
4.3. Effect of rice-crab culture on rice yield, GWP and NEEB
Cultivation of crabs in the rice fields improved the grain yield of rice, although the increase was significant only between the RM and RC1 treatments (Table 2). Increase in soil fertility as well as nutrients being absorbed by the rice due to crab rearing had been reported because of (1) additional nutrients from crab faeces, (2) movements of crab accelerating the release of accumulated nutrients, and (3) crab feeding on aquatic plants contributing to nutrient recycling and reducing N losses (Bhattacharyya et al., 2013; Zeng et al., 2013). However,the rice yield in the treatment RC2 was not significantly increased compared with RM (Table 2). Presumably, a few new budding tillers may have been broken by the juvenile crabs during tillering stage, similar to results found by An et al. (2012). GWP is thought to be an integrative evaluation of N2O and CH4emissions from rice-crab ecosystems to assess the contribution of the system to the effects of global warming (Zhang et al.,2016). According to GWP calculations, the CH4contributed more than 97% (Fig. 5) and the GWPs of RC1 and RC2 treatments were considerably higher than rice monocultures as a consquence (Table 2). NEEB is a comprehensive economic evaluation index, combining the output value of products and agricultural production inputs as well as GWP costs. NEEB can be used to evaluate the relationship between system productivity and its impact on the environment in rice fields (Zhang et al., 2015). Rice-crab cultivations provided significantly higher NEEB results than rice monocultures,and RC1 was highest, followed by RC2, and finally RM (Table 3). Thus,integrated cultivation of rice and crabs is both an economically viable and environmentally sound model. Furthermore, breeding the megalopa larva of crab in rice fields(RC1 treatment)may be a better option,in terms of obtaining better NEEB results in northeast China.
5. Conclusions
This experiment is the first to specifically focus on measuring and comparing greenhouse gas emissions in rice-crab culture systems.Overall, the integration of rice and crab cultivation increased CH4emissions,but also decreased the discharge of N2O.The RC1 treatment had the highest GWP, followed by RC2 treatment, then RM treatment.However,the cultivation of crab in rice fields visibly increased the rice yield, as well as providing additional crab output. Moreover, considering the attendant economic benefits, rearing crab in rice fields could obtain higher net profit and underwrite the increased GWP costs.RC1 treatment obtained the highest NEEB, demonstrating that culture of megalopa larva of crab in rice field is the best strategy of the three for optimizing the highest NEEB results for rice fields in northeast China.
Acknowledgements
This work was supported by Agriculture Research System of Shanghai, China (Grant No. 201804), Shanghai Leading Academic Discipline Project(No.Y1101)and the AqASEM project(245020)under FP7. The study was also supported by Shanghai Universities First-class Disciplines Project of Shanghai Collaborative Innovation for Aquatic Animal Genetics and Breeding (No. ZF1206). We also would like to acknowledge the valuable technical assistance of our staffand students.
 Aquaculture and Fisheries2019年4期
- Aquaculture and Fisheries的其它文章
- Natural versus synthetic anesthetic for transport of live fish: A review
- Increased pCO2 changes the lipid production in important aquacultural feedstock algae Isochrysis galbana, but not in Tetraselmis suecica
- Effects of fermented protein feed on the growth performance of pond-raised crab
- Assessing recent gradual upsurge of marine captured Hilsa stock (Tenualosa ilisha) in Bangladesh
- Comparative age and growth of Uroteuthis chinensis and Uroteuthis edulis from China Seas based on statolith
