
MODISobserved snow cover variations in theAksu River Basin,Northwest China
2019-07-10 09:53:20JingLiShiYinLiuQiaoLiu
Jing Li,ShiYin Liu,Qiao Liu
1.State Key Laboratory ofCryospheric Sciences,Northwest Institute ofEco-Environment and Resources,Chinese Academy of Sciences(CAS),Lanzhou,Gansu 730000,China
2.Institute of InternationalRiversand Eco-security,Yunnan University,Kunming,Yunnan 650500,China
3.Key Laboratory ofMountain Surface Processesand Ecological Regulation,Institute ofMountain Hazards and Environment,Chinese Academy of Sciences,Chengdu,Sichuan 610041,China
ABSTRACT Amajor proportion of discharge in the Aksu River is contributed from snow-and glacier-meltwater.It is therefore essential to understand the cryospheric dynam ics in this area forwater resourcemanagement.The MODISMOD10A2 remotesensing database from March 2000 to December 2012 was selected to analyze snow cover changes.Snow cover varied significantly on a temporal and spatial scale for the basin.The difference of themaximum andm inimum Snow Cover Fraction(SCF)in w inter exceeded 70%.On average for annual cycle,the characteristic of SCF is that it reached the highest value of 53.2%in January and lowest value of 14.7%in July and the distributions of SCF along with elevation is an obvious difference between the range of 3,000m below and 3,000m above.The fluctuation of annual average snow cover is strong which shows that the spring snow coverwas on the trend of increasing because of decreasing temperatures for the period of 2000-2012.However,temperature in April increased significantly which lead tomore snowmeltand a decrease of snow cover.Thus,more attention isneeded for flooding in this region due to strongmelting of snow.
Keywords:MODISsnow data;Aksu River;snow cover fraction;climate change
1 Introduction
Snow cover area of the Northern Hem isphere is up to 50%during the w inter,considerably in f luencing Earth's energy balance(Barry,2008).Mountain snowpack and spring runoff are key components of surface water resources,and serve as important,regionally integrated indicators of climate variability and change(Stewart,2009).Snow cover in the Tianshan M ountains is an important predictor of regional climate change,aswell as a crucialwater source for its surrounding arid regions,and greatly influences the hydrological and biological processes(Tang et al.,2017).M eanwhile,snow cover area is an important parameter of hydrologicalmodels to predict the seasonalwater supply,runoff and f looding risk in watersheds dom inated by snowmelt(Hall et al.,1998;Jain and Lall,2000;Yang et al.,2003;Tong et al.,2009).It has been realized thatmeltwater from seasonal snow is onemain component of river runoff in the Tianshan(Aizen et al.,1995;Hagg et al.,2007;Krysanova et al.,2015).Both temperature and precipitation increases to date have impacted mountain snowpack simultaneously on a global scale,but the nature of the impact is strongly dependent on geographic location,latitude,and elevation(Stewart,2009).While human-induced warm ing has produced detectable and consistent hydroclimatic consequences on a global scale in many compartments of the cryosphere(Lemke et al.,2007),mountain snow cover remains lesswellunderstood.
Climate change is has been reported in Central Aisa and particularly for the Tianshan Mountains.An increase in mean annual air temperatures(MAAT)since the 1970s for the entire Central Asia with pronounced rise in w intertime has been presented(Sorg etal.,2012).Precipitation trends are heterogeneous throughout Central Asia and,equally important,statistically not significant(Unger-Shayesteh et al.,2013;Aizen et al.,1997).Using ground observation data and remote sensing data,snow cover of Central Asia has been observed a general decrease,in extent(Unger-Shayesteh et al.,2013),depth(e.g.,Unger-Shayesteh etal.(2013)and Aizen etal.(1997)for the period 1940-1991)and also duration(e.g.,Unger-Shayesteh et al.(2013)and Zhou et al.(2013)for the period 1986-2000,Aizen etal.(1997)for the period 1940-1991).For Central Asia,an increase of 1.0-1.2°C formean surface tem perature is predicted compared with 0.3-0.7°C for global temperature(IPCC,2013).Annual river discharge is generally expected to rise formost catchmentswithin the nextdecades due to amore pronounced warm-season(Kundzew icz etal.,2015).The shiftof the peak discharge from summer to spring may,in the future,result in reduced water availability in the dry season(Barnett etal.,2005).
The Aksu River originates from the Tianshan Mountains which are the source of major rivers in Central Asia.The snowmeltwater from the Tianshan M ountains is the lifeblood of agriculture and animal husbandry in its downstream arid regions(Hu,2004).M apping the duration and variability of snow cover can help to identify regions with stable snow-cover conditions as well as areas in which snow is highly variable between different years.The spatiotemporal variation of the snow cover is likely to be affected substantially by climate change,but to what extent is yet unclear(Li et al.,2018).Traditional sources of snow observationswere usually obtained from in situ station observation.However,due to the scarcity and lim itation of in situ observations,it is difficult to adequately quantify the spatiotemporal variability of snow cover inmountainous regions(Woo and Thorne,2006;Pu etal.,2007).Recently,as the benefitof spatial and temporal resolution,MODIS snow map has been extensively used to monitor snow cover dynamics in amore integrated scale(Pu etal.,2007;Immerzeel etal.,2009;Gao etal.,2012;Zhang etal.,2012;Dietz et al.,2013;Ke and Liu,2014;Li and Ke,2014),which is very difficultwhen using in situ observation data.High accuracy of MODIS snow product has been suggested by many evaluation studies when compared with in situ observations and other remote sensing data at both regional and global scales(Archer et al.,2004;Parajka and Blöschl,2006;Pu et al.,2007).A detailed accuracy assessmentof the MODIS snow producthas been given by Hall and Riggs(2007).In general,the accuracy of MODIS snow products is satisfactory in the global scalewith the value of 93%.For example,K lein and Bernett(2003)showed an overall accuracy of 94%by comparing MODIS snow product with in-situ Snow pack Telemetry(SNOTEL)measurements at 15 locations in the Upper Rio Grande Basin during the snow season of 2000 and 2001.It is also found that in the majority of days MODIS fails to map snow at depths of less than 4 cm.Parajka and Bloeschl(2006)presented an extensive validation using daily in-situ observations of snow depths from 754 climatic stations over Austria from 2000 to 2005.The accuracy of MODIS snow products is very high with an average of 95%on cloud free days.Sim ilarly,Wang et al.(2008)evaluated the accuracy of MODIS snow products using ground observed snow depth data at20 climatic stations in Northern China from 2001 to 2005.They also show 94%accuracy of MODIS snow product on cloud free days at snow depth of more than 4 cm.
In this study,MODIS snow data was used to acquire the Snow Cover Fraction(SCF)information for a Tianshan Mountain watershed.The temporal and spatial snow cover characteristic of thewatershed has been analyzed using snow cover fraction information.Finally,the change trend of snow cover and possible climate causeshave also been exam ined.
2 Study area
The Tarim River Basin(TRB)is the biggest inland river basin in China and most water supplies originate from the surrounding mountainous areas,such as Tianshan,eastern Parim,Karakoram and Kunlun mountains.The total snow and ice-melt contribution to the Tarim River is estimated atabout 48%(Xu et al.,2009).The Aksu River Basin(ARB)is one of themain tributaries to the Tarim River Basin(Figure 1).The ARB is an international river,originating in Tianshan in Kyrgyzstan and draining into the Xinjiang Uyghur Autonomous Region of China.Although the area of the ARB is only less than 5%of the area of the entire TRB,the average annual flow of the ARB accounts for 70%-80%of the average annual flow of the Tarim River(Duethmann etal.,2015).The precipitation to the ARB ismainly supplied by westerly flows,with thewesterly jet location and intensity determ ining the seasonal variation in the moisture route(Bothe etal.,2012).
In the ARB,there are few meteorological and hydrological data available for research.The situation of measure stations are presented in Figure 1,and basic information in Figure 2.

Figure 1 Location of the Aksu River Basin,SRTM DEM of the basin and gauging station situationwithin the basin
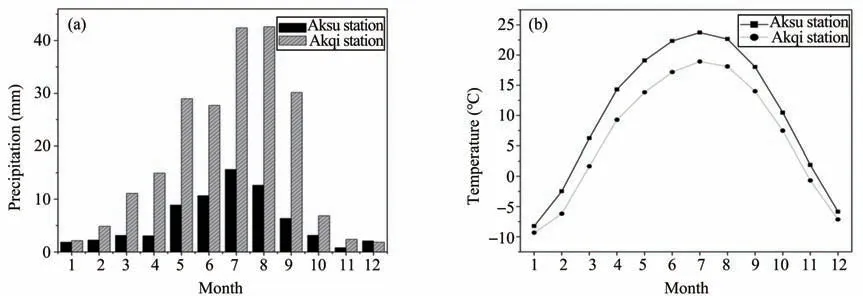
Figure 2 Distribution ofmonthly precipitation and temperature from Akusu and Akqimeteorologicalstations in the ARB(1957-2012)
3 Data and method
3.1 MODSI snow data and processing
Considering that the MODIS 8-day composite snow data elim inates cloud obscuration and thereby provides more consistent and cloud-free coverage than daily resolution data products,we have chosen to rely on analyses of the 8-day composite snow data product in this work.There are two types of 8-day com posite snow data products available(MOD10A 2 and MOD10C2).Specifically,MOD10A2 data are the 8-day composite snow cover observations at 500 m resolution and in this study we use MOD10A2 products.In the MOD10A2,the MODIS snow cover algorithm labels each 500 m pixel as clear land,snow,cloud obscured,and water.MOD10A2 data used in this study were obtained from the National Snow and Ice Data Center in America.The availableMODIS images,from 2000-2012 on an 8-day classif ication basis,were mosaicked and projected with the WGS 1984 projection system.Then the ARB area was extracted from themosaicked scene to assess the snow and ice cover percentage in the study area over a 13-year period.When the percentage of cloud cover exceeded 15%on a specific date,the record was eliminated and the average snow cover on this datewas estimated by interpolating linearly between the previous and nextavailable cloud-free images.The snow cover area was also calculated for the different elevation zones to investigate snow cover dynam ics in these zonesovera period from 2000 to 2012.
However,about 13%cloud coverage remains during w inter for the 8-day maximum snow cover map(Figure 3).In order to remove the clouds,a Spatial Filter(SF)method used by Tong etal.(2009)was applied in this study.In the SFmethod,the snow maps are reclassif ied as snow,no snow,and cloud.A cloudcovered pixel is replaced by the majority of noncloud pixels in the eight closestneighborhood pixels.If the number of pixelswith snow equals the number withoutsnow,the center pixel is def ined as snow.However,if all of the eight closest neighborhood pixels are cloud-covered,the center pixel is still classified as cloudy.The SF decreases the cloud coverage to lower than 10%in theARB inw inter(Figure 3).
The snow cover area on cloud-free Landsat TM images were compared with MODIS snow cover images on the same date to validate the MODIS snow cover productas given in Table 1.The validation was done for the totalaswell as for band-w ise snow cover area of the images.The results obtained for the validation of MODIS imageswith TM images suggests that MODIS snow products are reliable in estimating the snow cover area in the ARB.
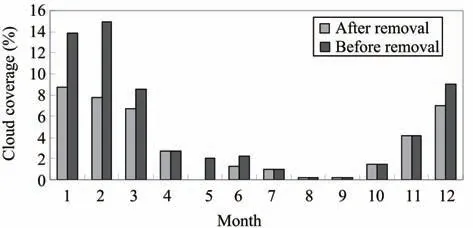
Figure 3 The change of cloud coverage before and after cloud removalusing spatial filtermethod forMODIS 8-day composite snow data
3.2 DEM data
The elevation data used in this study were obtained from the Shuttle Radar Topography M ission(SRTM).The high-quality SRTM DEM version 4 with a resolution of 90m are freely available from the U.S.Geological Survey(USGS)(http://seam less.usgs.gov/).The SRTM DEM was further treated using standard GIS techniques to delim it the ARB.Four different altitudinal zones were extracted from the DEM study area for detailed analysisof snow cover distribution.The characteristics of each elevation zone are given in Table 2.Glacier cover data in the ARB is acquired from the second China glacier inventory with a value of 2,395 km2(Guo etal.,2015).
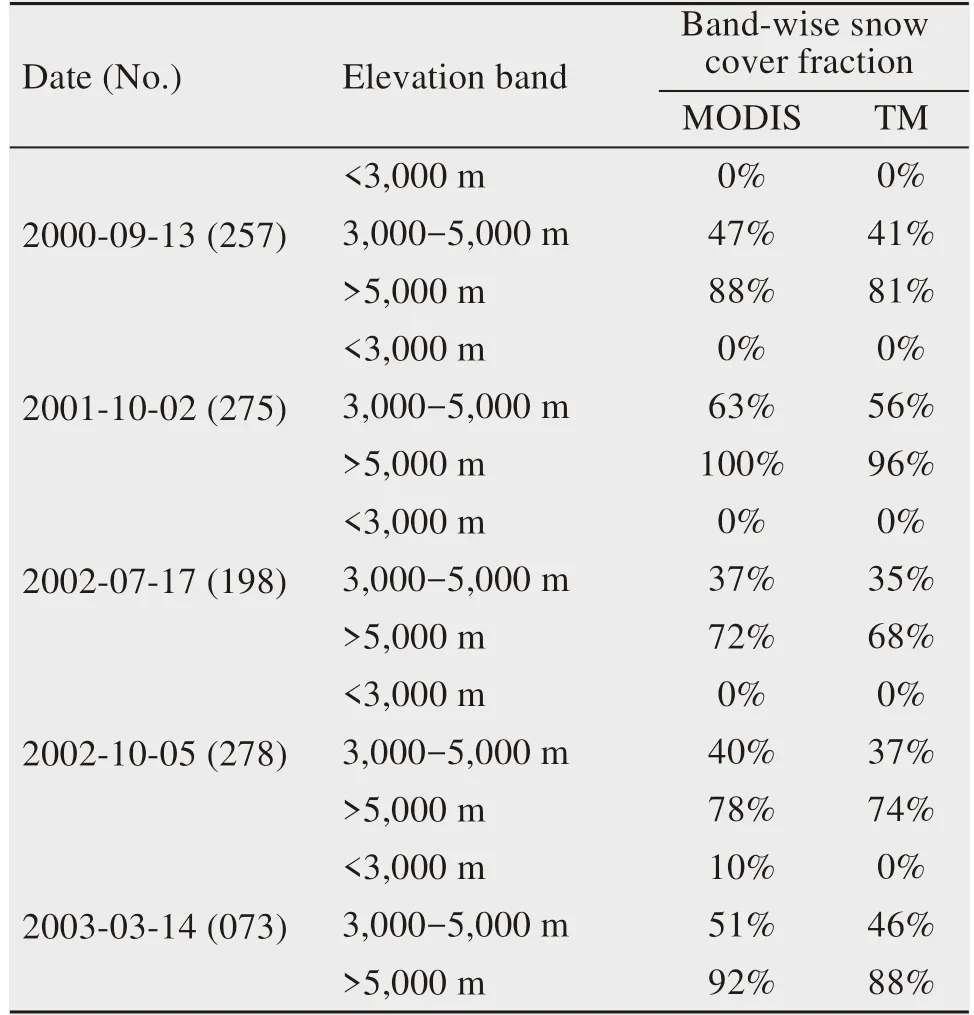
Table 1 Comparison of snow cover fraction derived from MODISand TM
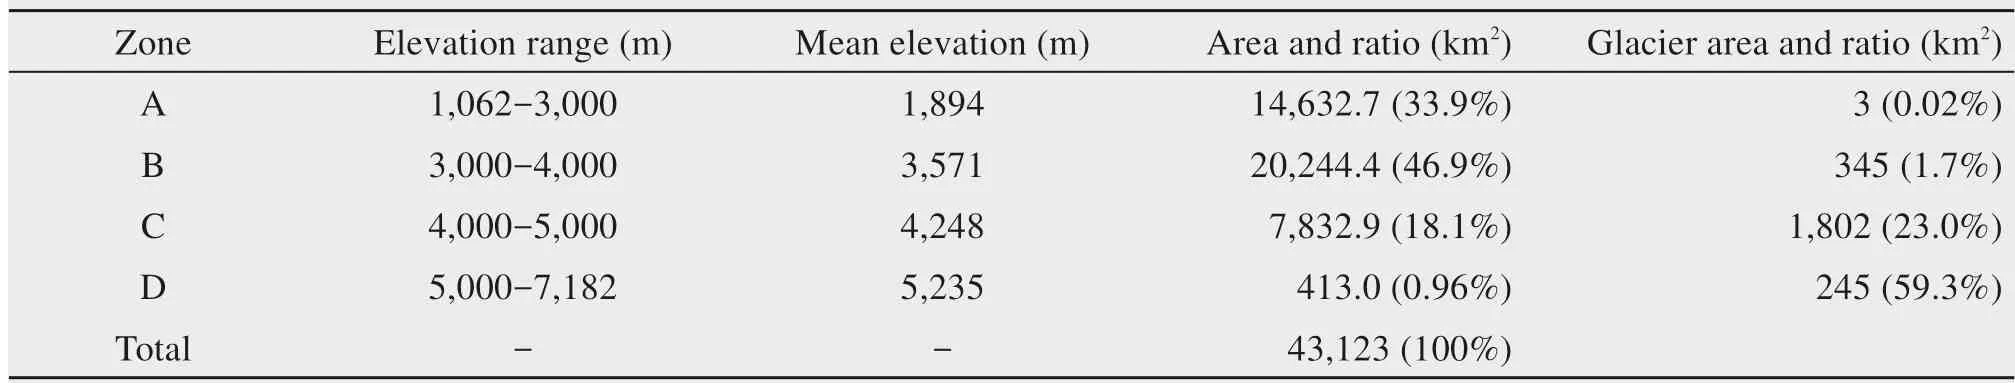
Tab le 2 Characteristicsof four elevation zonesextracted from SRTM of the ARB
4 Results
4.1 Temporal variation of snow cover
On average,the intra-annual cycle of snow cover has been presented monthly and seasonally(Figure 4).Highest snow cover fraction(SCF)appears in January with a value of 53.4%monthly,and after that SCF starts to decrease until it reached the lowest value of 18.4%in July(Figure 4a),and then SCF begins to increase.On seasonality,the temporal distribution of snow is conventional.Winter SCF(%)is larger than in summer(Figure 4b).SCF reaches its highest value in w inter which exceeds 50%and reaches the lowestvalue of 16.4%in summer.

Figure 4 The ARB annualsnow cover distribution onmonthly(a)and seasonally(b)acquired from MODIS 8-day composite snow data over the period of 2000-2012
The strong variation of snow cover in ARB is clearly shown in Figure 5 which presents themaximum and m inimum SCF over the period of 2000-2012.By plotting the pointof 8-day composite SCF(%)over the period,a strong variation is clearly evident(Figure 5).Themaximum value of SCF appears in w inter with a value of 87.8%which is also the highest value for the period.Them inimum SCF value in w inter is 12.6%.
The difference between the maximum and m inimum SCF in w inter can exceed 70%.SCF differences in summer aremuch smaller than in w interwith value of 45%,but this value is relatively large compared to the m inimum SCF of 5%in summer.The highestvalue of SCF in summer is near 50%which is smaller than its value in w inter.The lowestvalue of SCF can decrease to around 5%in summer.

Figure 5 The average,maximum andm inimum cycle of 8-day composite snow cover fraction(%)in the ARB over the period of 2000-2012
4.2 Spatial distribution of snow cover
Figure 6 shows the annual cycle of SCF averaged over the areas in differentelevation zones as calculated from MODIS snow data over the period from February of 2000 to December of 2012.The value difference of SCF between the elevation zones below and beyond 3,000m is distinct.The averaged SCFmostly exceed 50%for elevation zones beyond 3,000m(Figures 6b,6c,6d),and exceeded 60%for the elevation zone beyond 4,000m,but for the elevation zones below 3,000m,the SCF never exceeded 40%(Figure 6a).It is clear that the elevation zones beyond 3,000m feature larger snow cover.The process of snow accumulation and ablation in the ARB is also affected by the elevation.In the elevation zones below 3,000 m(Figure 6a),snow decreases sharply and fast,and is essentially depleted by the end of March,but in the elevation zone of 3,000-4,000m,snow starts tomeltsignificantly in April,with most of the snow gone by the end of May.In the elevation zone of 4,000-5,000m,because of its high elevation(above 4,000 m),themelting of snow starts in May,and snow begins to accumulate in August.
According to the area distribution of elevation zones(Table 2),zone A(below 3,000m)and zone B(3,000-4,000m)occupy more than 80%of the basin area.Considering the short duration of snow in zone A(Figure 6a),zone B is the primary snow cover zone in the ARB.

Figure 6 The annual cycle of snow cover fraction(%)averaged over the period of 2000-2012 based on the 8-day MODIS snow covermap for fourelevation zones.(a)Below 2,000m;(b)3,000-4,000m;(c)4,000-5,000m;(d)beyond 5,000m
4.3 Inter-annual variation of snow cover
Inter-annual variation of snow cover is from the direct impactof climate change.Spring snow cover in the ARB is affected by the accumulated w inter snow cover and snowmelt due to warmer spring temperatures.Mean spring SCF varied between 24.8%and 47.2%over 2000-2012(Figure 7).W inter snow cover can effectively affect the spring snow cover.In 2005 and 2007,the high and low mean spring SCFwas the result of high and low meanw inter SCF in 2004 and 2007,respectively(Figure 7).In summer,most snow cover has disappeared because ofmelting,butcan exist in high elevation areas of the ARB.Mean summer SCF in the ARB exceeds 10%over 2000-2012 and it reached the highest value of 26.8%in 2005.When the season shifts to autumn,snow cover starts to accumulate.Allmean autumn SCF over 2000-2012 are above 30%except in 2002 with a value of 28.1%.The highest value ofmean autumn SCF is53.9%which appeared in 2009.
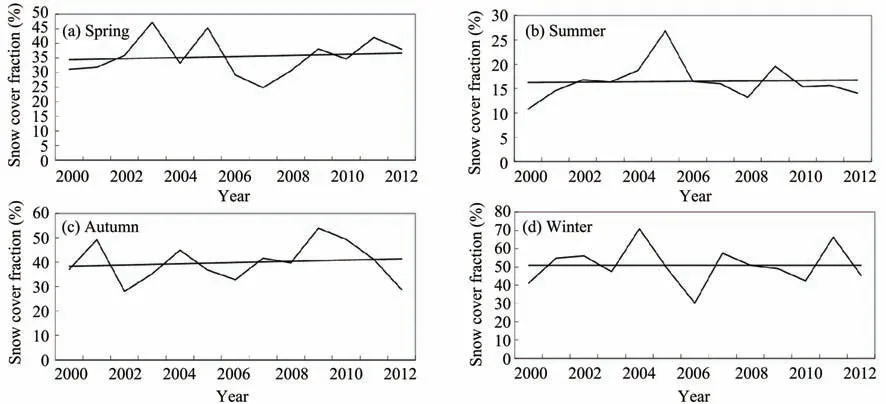
Figure 7 Variation and changing trend of seasonalmean SCFover the period of 2000-2012
Snow cover can reflect the impact of climate change on mountainous area.Analysis shows the increasing trend of snow cover in the ARB during 2000-2012.The increasing trend of autumn and spring snow cover is more significant.Winter snow cover show a low increasing trend and no clear changing trend for summer snow cover.
5 Discussion
Then increasing trend of spring snow cover needs to be analyzed considering its great impact on spring runoff,flood and water resources.Firstly,it is necessary to figure out the relationship of snow cover with temperature and precipitation.Figure 8 shows the close correlation between temperature and snow cover.The correlation coefficient is as high as-0.72.There is no clear relationship between precipitation and spring snow cover.This phenomenon suggests that spring snow cover ismostly under the control of temperature in spring.This is quite reasonable because the form of precipitation and snowmelt are greatly controlled by temperature,where low temperature benefits the snow cover formation and high temperature leads tomelting.
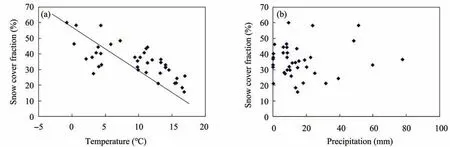
Figure 8 The relationship between SCFand temperature(a),precipitation(b)in the spring time of 2000-2012
Snowmelt runoff is a very preciouswater resource in the ARB.Thus,it is important to analyze the monthly variation of snow cover in spring.The increasing trend of snow cover is obvious in spring and March for the period of 2000-2012(Figure 9).Nevertheless,snow cover in April and May had an inverse tendency with spring,presenting a decreasing trend(Figure 9).The increasing trend of spring snow cover is controlled by the increasing trend of March snow cover.
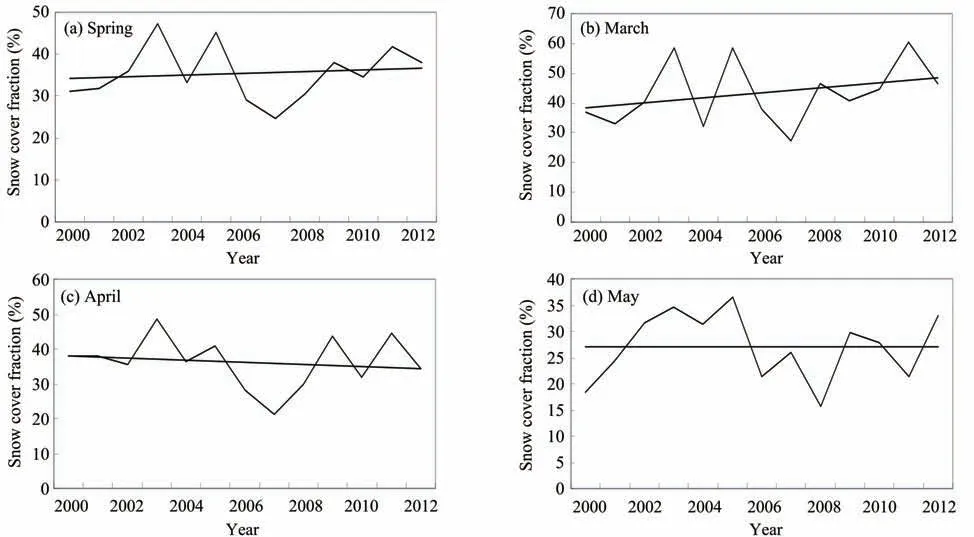
Figure 9 The changing trend of snow cover for spring(March,Apriland May)in ARB during 2000-2012
In order to analyze the reason of snow cover change,the change trend of temperature and precipitation in each month of spring over the period of 2000-2012 is presented in Figure 10.In spring the temperature decreased,causing an increase of snow cover,which is sim ilar for March snow cover.The increasing M arch snow cover is caused by significant decreasing of temperature(Figure 10),but in April snow cover decreases significantly due to increasing temperatures.For the basin,April is the date that snow cover began to melt.Increasing temperatures in April could strongly cause more snowmelt and the decrease of snow cover.In May,snow cover show s a very low increasing trend and the temperature in that time presents a slight decreasing trend.
6 Conclusions
The MODIS snow data has be successfully used for monitoring snow cover extent in the ARB.The variation of SCF is very large in the basin.Between the periods of 2000-2012,the difference of themaximum andm inimum SCF in w inter exceeded 50%.On average for annual cycle,the SCF reaches its highest value of 53.2%in January,and lowest value of 14.7%in July.Elevation affects the obvious difference of values for Snow Cover Fraction between the range of 3,000m below and 3,000m above.The fluctuation of yearly average snow cover is also strong,where snow cover has a good relationship with spring runoff.The spring snow cover shows an increasing trend because of decreasing temperatures for the period of 2000-2012.Temperatures in April increased significantly which led to more snowmelt and decreasing of snow cover.Thus,increased attention is needed for flooding in this region due to strong snow melt.
Acknow ledgments:
This research was supported by the National Natural Science Foundation(Grant Nos.41301067,41671057,41671075).
 Sciences in Cold and Arid Regions2019年3期
- Sciences in Cold and Arid Regions的其它文章
- Vice p resident Zhang visited Cryosphere Research Station in A laska,Northwest Institute of Eco-Environment and Resource,Chinese Academ y of Sciences
- Risk prevention and controlstrategies for the severely affected areasof snow disaster in the Three Rivers Source Region(TRSR),China
- A landscapem anagementanalysis framework and its prelim inary app lication in Ejina Oasis,Northwest China
- Stem radialgrow th indicate the optionsof species,topography and stand management for artificial forests in thewestern Loess Plateau,China
- Assessing the im pactsof ecological-living-productive land changeson eco-environm entalquality in Xining City on Qinghai-Tibet Plateau,China
- Variation and relationship between soilm oisture and environm ental factors in the source region of the Yangtze River from 2005 to 2016