
Assessing the im pactsof ecological-living-productive land changeson eco-environm entalquality in Xining City on Qinghai-Tibet Plateau,China
2019-07-10 09:53:18ZiYiGaoHaiFengZhangXiaoNanYangZhiYuanSong
ZiYiGao,HaiFeng Zhang*,XiaoNan Yang,ZhiYuan Song
1.SchoolofGeographical Science,QinghaiNormalUniversity,Xining,Qinghai810008,China
2.Institute of Soil and Water Conservation,Northwest Agriculture and Forestry University,Yangling,Shaanxi 712100,China
3.DepartmentofComputer Science and Technology,Lvliang University,Lvliang,Shanxi033000,China
ABSTRACT The Ecological-living-productive land(ELPL)classification system was proposed in an effort to steer China's land pattern to an ecological-centered path,with the developmentmodel shifting from a single function into more integrated multifunction land use.The focus is coordinating theman-land contradictionsand developing an intensive,efficientand sustainable land use policy in an increasingly tense relationship between humans and nature.Driven by socioeconom ic change and rapid population grow th,many cities are undergoing urban spraw l,which involves the consumption of cropland and ecological land and threatens the ecologicalbalance.This paper aims to quantitatively analyze the criticaleffects of ELPL changeson eco-environmentalquality according to land use classification based on leading function of ecology,living and production from 1990 to 2015 with a case study of Xining City.A lso,four future land use scenarioswere simulated for 2030 using the Future Land Use Simulation(FLUS)model that couples human and naturaleffects.Our results show a decrease in productive land(PL)and an increase in ecological land(EL)and living land(LL)in Xining City.Forestry ecological land(FEL)covered the top largest proportion;agriculture productive land(APL)showed the greatest reduction and urban and rural living land(U-RLL)presented a dramatic increase.The eco-environmentalquality improved in 1990-2010,mainly affected by the conversion of APL to FEL and GEL.However,the encroachmentof U-RLL into APL,other ecological land(OEL)and FEL was themain contributor to the decline in eco-environmental quality in 2010-2015 as wellas the primary reason for the increase area of lower-quality.The Harmonious Development(HD)-Scenario,characterized by a rationalallocation of LL and PL and a better eco-environment,would have implications for planning andmonitoring futuremanagementof ELPL,andmay representa valuable reference for localpolicy-makers.
Keywords:land use;productive-living-ecological land changes;eco-environmentalquality;FLUSmodel;Xining City
1 Introduction
A land use system is a comprehensive and complex system comprised of econom ic,social and ecosystem sub-systems that generate productive,living and ecological functions(Verstegen etal.,2016).Productive function is the foundation that provides agricultural and industrial products for physical supplies,aswell as outputof other production and business operation activities.Living function refers to the ultimate purpose that provides carrying space for housing,employment,transportation,storage,and recreation.Ecological function is the support that provides a safeguard for production and living,which refers to important natural resources such as soil,hydrology,climate,vegetation,and topography(Zhou et al.,2017).A healthy land use system not only depends on the rationality of the structure,but also is closely related to the continuity and diversity of land functions(Schluessel et al.,2008).Land usemulti-functionality refers to functions with the ability to provide products and services through different types of land use(Zhang,2005).Based on the ecological-living-productive functions,land can be classified into ecological-living-production land(ELPL).The ELPL classification system places a greater emphasis on the ecological function of land,reduces the competition among various lands within a limited space,and promotes intensive,efficient and sustainable land use in the increasingly tense relationship between humansand nature.
Sim ilar to western developed countries,China is facing crises and challenges related to urban expansion,rapid population grow th and ecosystem degradation in the process of economic development.The conflict and competition between inadequate land supply and unlim ited land demand is becom ing fierce(Cai et al.,2018).A large amountof farm land,which once occupied forest,wetlands,waterways,and grass lands,has been converted to construction land,with unused land being allocated to construction land to meet land resource supply needs(Liu and Liu 2007;Xu et al.,2007;Pradhan et al.,2014).This disorderly and fierce competition among land use and arbitrary allocations neglects the synergy and trade-offs between landmultifunctionality,restricts econom ic development,destroys ecologicalbalance and violates the principle of sustainable development(Tan etal.,2016).To this end,China attaches great importance in coordinating the relationship between econom ic development and eco-environment and have implemented a serious of major decisions on arrangements to alleviate the contradiction among different land use types.The 18th NationalCongress of the Communist Party of China put forward a goaland principle of space optim ization on the basis of ELPL:the space for production should be used intensively and efficiently,the living space should be sustainable and adequate in size,and the ecological space should remain unspoiled and beautiful.The National Land Planning Outline(2016-2030)issued by the State Council in January 2017 divided land space into three categories:agricultural space,urban space and ecological space and requires that land development should be matched with the resource and environmental carrying capacity,and balanced with the population,resources and environment.The scale,structure and layout of land use should be based on resource endowments,ecological conditions and environmental capacity,and scientifically and rationally delineate the boundariesof urban,agricultural and ecological space development.Governance associated with ELPL has become an importantpartof China's landmanagement theory(Zhang et al.,2015)that has drawn attention from policymakers and scholars.Related research has focused on theoretical concepts and framework(Dang et al.,2014;Liu etal.,2017a),drivingmechanism and evolutionary trend(Zhang and Fang,2002),spatialoptim ization layout and the classification criteria for major functions(Gu et al.,2013;Dang et al.,2014;Pan et al.,2014;Fan,2015;Yu etal.,2015;Li etal.,2016).
This study focuses on critical effects of ELPL changes on the eco-environmental quality of Xining City,Qinghai-Tibet Plateau.The Qinghai-Tibet Plateau is called"The Third Pole",with the highestglobalaverage elevation and rich natural resources;and is highly sensitive to disturbances of external factors.In recent years,human activity in terms of production and living have markedly altered the Earth's surface process,which causes changes in the eco-environment,including drying and warming,overgrazing,tourism development and engineering construction(Han etal.,2016).Several studies have been published considering the response of land use change to the eco-environment.For example,Zhang et al.(2000)analyzed the serious contradiction between urban land use change and the eco-environment in Lhasa City from 1995 to 1999.Chu et al.(2006)systematically discussed temporal and spatial characteristics of land use change in Lhasa area from 1990 to 2000,and used the Markov model to simulate changes in land use under different scenarios over the next20 years(Chu etal.,2005).Fu etal.(2009)studied the land use change in Xining City using the combination of RS and GIS technology from 1995 to 2005,and found that areas of rivers,lakes,wetlands,grasslands and woodlands had changed significantly,and the ecoenvironmenthasgreatly improved,and predicted that increase of woodlands,grassland,rivers,lakes aswell as wetlandswasbeneficial to the eco-environmentover the next ten years.However,few studies focused on the effectsof land use change on the eco-environmentaccording to a land use classification system based on leading functionsofecology,living and production.
Xining City is a typical valley-basin city on the Qinghai-Tibet Plateau and considered as themost livable city with lower altitude and better climate.Under the influence of population increase and urban expansion,Xining City has become the largest city on the plateau,and the feedback effect of land resources and eco-environment is becoming increasingly significant.Themain goal of our research is to assess the impacts of ELPL changes on the eco-environmental quality and provide guidance for future land optim ization.This study focuses on threemain points:(1)explore the spatio-temporal patterns of ELPL according to leading functions of ecology,living and production from 1990 to 2015;(2)estimate the influence of ELPL changeson eco-environmental quality in this period using 5,159 hexagonalgrid cells;and(3)simulate changes in ELPL in 2030 under different scenario demands on Xining City using the Future Land Use Simulation(FLUS)model.Thiswork can provide insights for building an ecological friendly and livable city that promotes harmony between humans and nature and proposes ideas for formulating and implementing urban planning.
2 M aterial and methods
2.1 Study area
Xining City(101°26'-101°54'E;36°26'-36°45'N)which is called"the Eastern Gate"of Qinghai-Tibet Plateau,is located in the northeast region of Qinghai Province,China.The city covers an area of 7,660 km2with average altitude of 2,295m above sea level.The average annual temperature isabout7.6°C and the annual rainfall is 370 mm.The study area in this paper refers to the four districts of Chengxi,Chengbei,Chengzhong and Chengdong,and the area is as large as 476.5 km2(Figure 1),with a population density as high as 2,635 person/km2in 2015.The area encompasses only 0.067%of the entire Qinghai Province but is home to 22%of the population.The GDP per capita amounted to 48,970 Yuan in 2015,which was 7.8 times the GDP per capita in 1990.Xining City is experiencing high-speed population agglomeration and urban expansion under the implementation of the Western Development and the Belt and Road Initiative,which has led to significant changes of ELPL.The Outline of the 13th Five-Year Plan for National Econom ic and Social Development of Xining City pointed out thatproblems such as the smallecological space,land and water shortages,and local trends of ecological deterioration,have not been fundamentally reversed.Exam ining the impacts of ELPL changes on the eco-environmental quality w ill help in decisionmaking andmaintain ecologicalbalance.
2.2 Data sources
The raster data of land use change in 1990,2000,2010,and 2015 were interpreted using cloud-free 30m×30m resolution Landsat TM(Thematic Mapper)remote sensing images downloaded from the China Geospatial Data Cloud.A series of remote sensing images underwent preprocessing,including remote sensing image radiometric correction,geometric correction,image cropping and enhancement to guarantee consistency and accuracy of the classification before these Landsat TM datawere analyzed.The terrain data of DEM was collected from the Geospatial Data Cloud for China.Climatic data(e.g.,rainfall,temperature)were derived from the China Meteorological Data Network.Vector data of highways,urban trunk roads,railways,provincial roads and streets of the administrative center were obtained by vectorizing the adm inistrativemap of the study area.GDP and population datawere sourced from statistical yearbooks,census data and city archivesof Xining from 1990-2015.

Figure 1 Study area location of Xining City
2.3 Quantitative analysis of ELPL changes(land use transition)
A land use transition matrix not only indicates the dynam ic trend and quantities of land use,butalso demonstrates changes in land use function and structure during the process of land transformation(Zhu and Li,2003).Thismatrix can be used to reveal details on land internal conversion in the form of amatrix for a period of time;which clearly shows land use structure characteristics and changes in land function type.The formula for thismatrix ispresented in Equation(1):
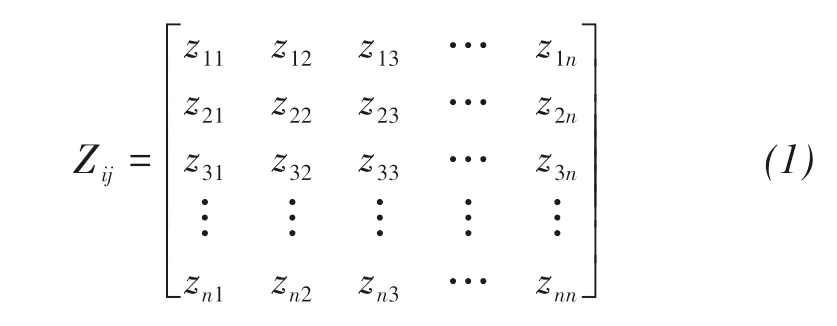
where Z is land area,n is number of land use types,i and j represent land types at the beginning and end of the study period,respectively.
2.4 Regional ecological quality analysis
To show changes in regional eco-environmental quality during the process of land use change in more detail,we installed the PATCH plugin in ESRIArc-GIS 10.2 software to create a grid system that consisted of 5,159 hexagons.Every cell in this grid system is a squarewith a side length of 0.198 km and an area of 9.994 hm2.Then,the 5,159 hexagonal grid cellswith the same coordinateswere placed over land usemaps to accurately calculate the statistics.
The regionaleco-environmental qualitymodel can quantitatively analyze the quality of the ecologicalenvironment in every grid cell.The eco-environmental qualitymodel isas follows:
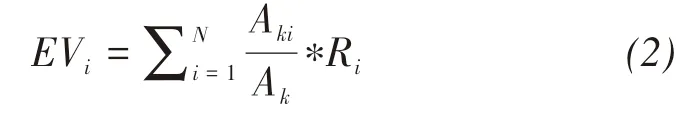
where EViis the eco-environmental quality index in the i-th cell,Akiis area of land type i in the k-th grid cell,Akis area of the k-th grid cell,and N is the number of land use types,Riis the eco-environmental quality index of the land use type i(Table 1).
Based on the ecological quality index,we divided the eco-environmentalquality grades into five categories:lower-quality area(EV≤0.2),low-quality area(0.2
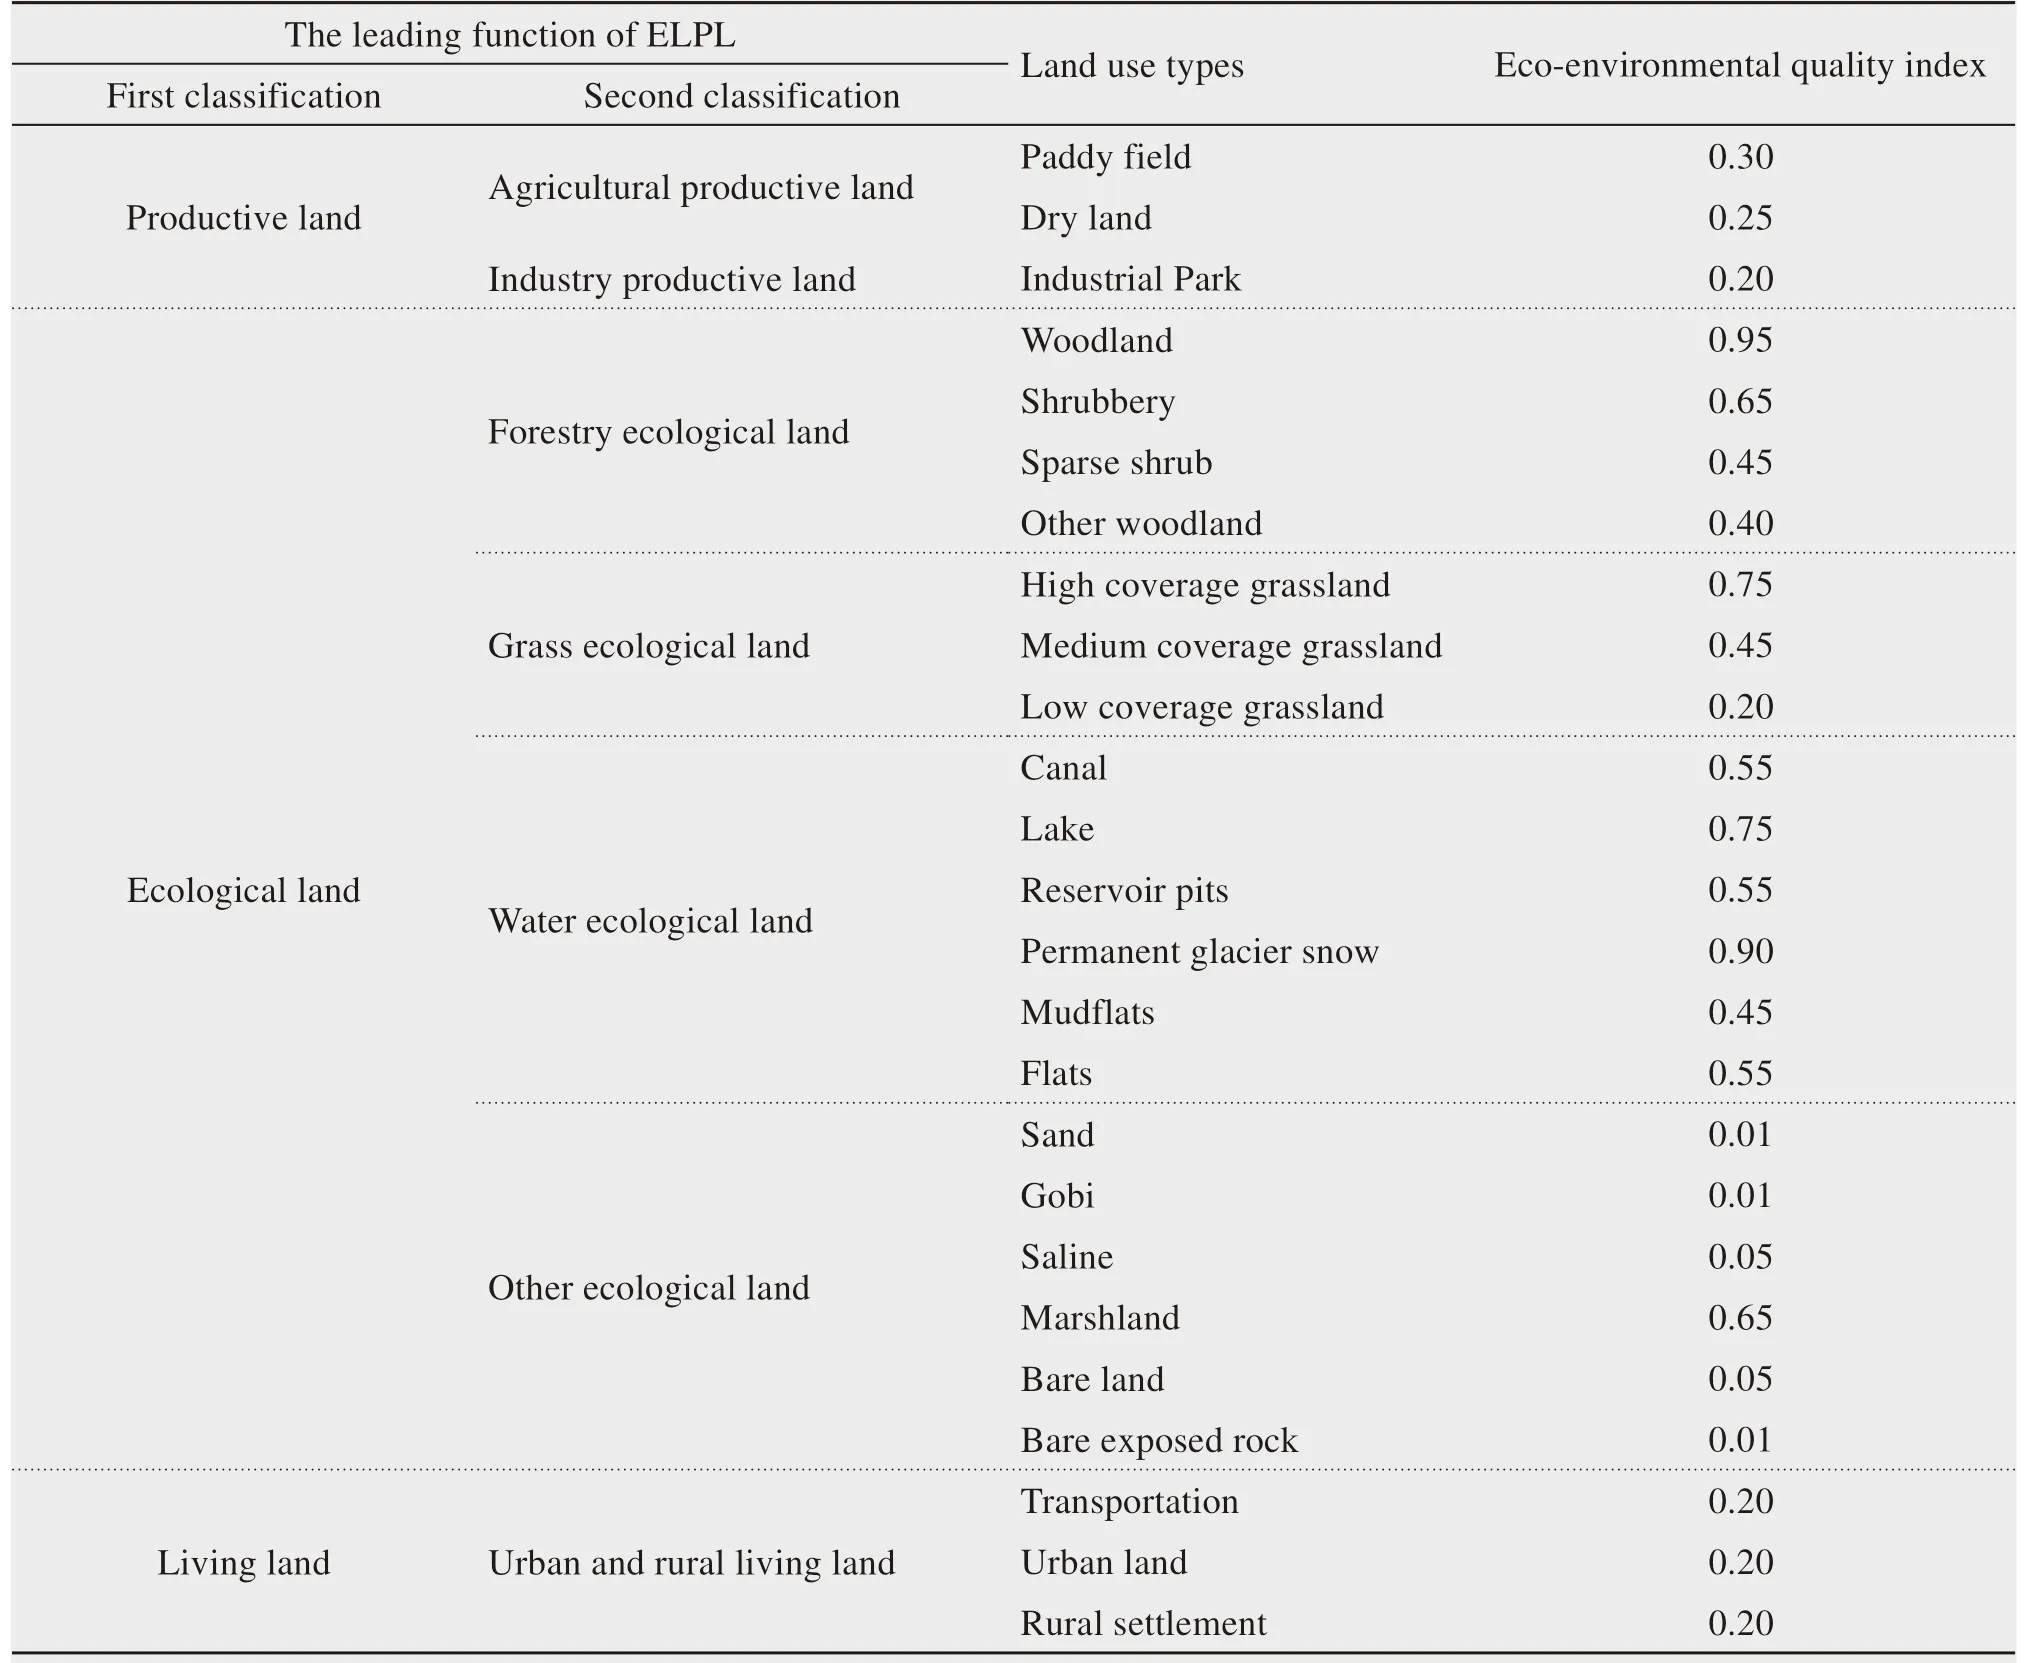
Table 1 The Ecological-living-productive land(ELPL)classification and eco-environmentalquality index
2.5 Ecological contribution ratio
The ecological contribution ratio shows the influence of the circulation of different land use types on the regional eco-environment.The ration reflects trends changes in the ecological environment and reveals dom inant factors that cause changes in the regional eco-environmental quality.The ecological contribution ratiomodel is formed as:
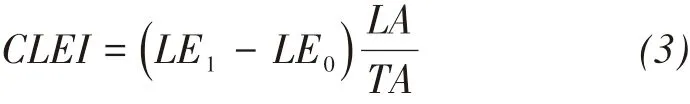
where CLEI is the land use transformation ecological contribution ratio;LE1is the ecological quality index of a certain type of land at the beginning of the change,and LE0is the index at the end of the change.LA is area of changed land type.TA is total land area of the region.
2.6 Ecological-living-productive land classification system
The conventional land use classification system pays too much attention to land with productive and living function and pose a great threat to the ecological function(Yue and Zhang,2003;Zhang et al.,2017),which creates an obstacle to coordinate and integrate multi-function land.Various types of land boundaries are unclear and badly managed ow ing to weak monitoring and poor enforcement so that unused land with ecological functions is arbitrarily allocated to other production land and living land(Xu et al.,2007).In northeastern China,large areas of wetlandswere allocated as unused land,causing ecological function to be lost(Li etal.,2006).The novelty of ELPL classification approach aims to achieve spatial optim ization and delineate ecological redlines,which promotes harmony between humans and nature.The same type of land w ill producemultiple functions due to differentways of use,we define themain intention based on the behavioral subjectas the dom inant function of a certain type of land(Yang et al.,2017).For example,cultivated land not only has the function of producing grain,but also has the ecological function of purifying the environment and the living function of entertainment and education.However,in general,the main intention of cultivated land is to produce food,therefore,it is classified as productive land.According to the leading function of ELPL classification system and the criterion of the ecological function of land use types(Yang et al.,2017;Cai et al.,2018),the first classification of land use types includes three categories:productive land(PL),ecological land(EL)and living land(LL);the second classification of land use types includes seven categories:agriculture productive land(APL),industry productive land(IPL),forestry ecological land(FEL),grass ecological land(GEL),water ecological land(WEL),other ecological land(OEL),and urban and rural living land(U-RLL).Ecological quality index values are referenced from Li etal.(2003),and Cuiand Zhang(2013)(Table 1).
2.7 FLUS model
Current simulationmodels over emphasize the impact of human activity on land use change,and rarely consider the role of natural climate.In fact,climate change has a significant impact on land use(Mendelsohn and Dinar et al.,1999;Bakker et al.,2005).The future land use simulation(FLUS)model is a comprehensivemodel formultitype land use scenario simulations that couples human and natural effects,and it represents an integration of a top-down System Dynam ics(SD)model and a bottom-up multiple Cellular Automata(CA)model(Liu et al.,2017b;Liang et al.,2018).The SD model predicts dynam ic land use demands under different scenario by taking natural environmental factors(DEM,slope,aspect,rainfall and temperature)and human activity(e.g.,GDP,population,highways,railways,urban trunk roads,provincial roads,streets of the adm inistrative center)into account.The multiple CA model is a great improvement over the traditional CA model,and is used to analyze the pattern of the latest period of land use instead of the change in two land use terms,which effectively avoids errors caused by inconsistencies between two land use data terms.An ANN model(artificial neural network)was performed to learn and fit the complicated relationships between the probabilityof-occurrence for each land use type and given spatial factors.An elaborate self-adaptive inertia and competition mechanism is implemented with the multiple CA model to address the competition and interactions in seven land use types.The FLUSmodel is a powerful tool formaking land use change simulation more realistic,convenient and efficient(Liu et al.,2017b;Yan etal.,2017;Liang etal.,2018).
In the first step,we use ANN-based Suitability Probability Estimationmodule to address the complex relationship between historical land use and various driving factors.To calculate the probability-of-occurrence for future land use types,a number of driving factors can be considered,such as terrain,climate and human activity.These driving factorsmustbe normalized to the range of[0,1],and the same line numbers and column numbersmust be selected.In the second step,through the CA module,the competition and interactions in seven land use types can be better adjusted and adapted.According to differences between future land use demand and current land use areas,a self-adaptive inertia coefficient w ill automatically increase or decrease the inheritance of this land use type on each grid cell.The inertia coefficient is formed as(Liu etal.,2017b;Liang etal.,2018):
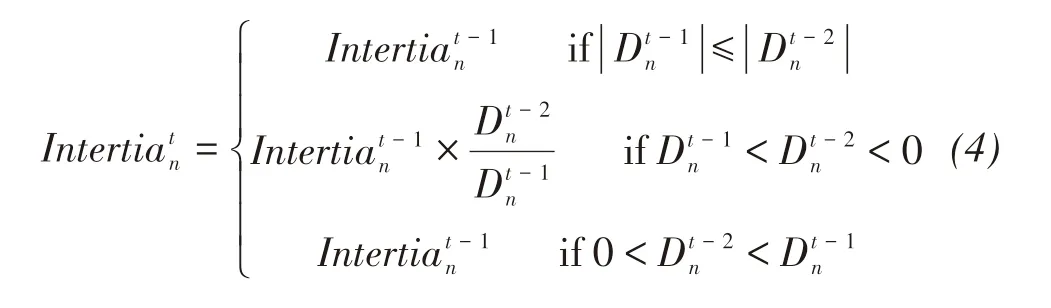
where n is the number of land use types,which denotes seven land use types that are trained in the process of simulation.Intertiatnrepresents the inertia coefficient for land use type n at iteration time t,Dt-1ndenotes the difference between the land use demand and the allocated amount of land use type n at iteration time t.The inertia coefficient is only defined for the current land use type occupying the grid cell.If the future land use type n is different from the current land use type o,the inertia coefficient for land use type n w illbe sent to 1,itw illnot change the total probability of land use type n for thisgrid cell.
Based on the probability-of-occurrence,the inertia coefficient,the neighborhood weightand the conversion cost(Liu et al.,2017b),the combined probability in each specific grid cell can be calculated by the formula:

where TPtm,nrepresents the combined probability in the grid cell m to transform from the initial land use types to the target type n at iteration time t,Pm,nis the probability-of-occurrence of land use type n,Wtm,nis the neighborhood weight,Intertiatnrepresents the inertia coefficient for land use type n at iteration time t,SOo→nrepresents the conversion cost from the initial land use type o to the target type n(a value of 0 indicates that grid cellswith one land use type can be used for another type;1 indicates that land use change isnotallowed).
In the third step,themodule of precision validation was used to access accuracy and applicability.In this study,we compared the predicted land use in 2015 based on the land use change occurring during 2000-2010 with the actual land use in 2015 for validation.The formula is formed as(Jia etal.,2018):
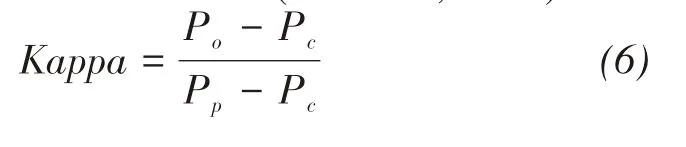
where Pois the proportion of correct simulation pixels,Pcis the expected correct ratio,Ppis the real accuracy proportion.The kappa coefficient ranges from 0 to 1.
The FLUS model is used to simulate changes in land use types in 2030 under different scenario demands,including the Baseline Development(BD)-Scenario,the Fast Development(FD)-Scenario,the Slow Development(SD)-Scenario and the Harmonious Development(HD)-Scenario.The various parameters determ ine natural and socioeconom ic factors(Table 2),the conversion cost and neighborhood weights in the region of the Qinghai-Tibet Plateau are provided in detail in Liu et al.(2017b).The BD-Scenario is designed based on current trends of econom ic,population,temperature and precipitation rates.The FD-Scenario assumes an economy and population increase at a very high rate,the temperature and precipitation change dramatically due to large-scale greenhouse gas em issions.The SD-Scenario is developed where economy and population increase at a low speed and climate change is smaller.The HD-Scenario is performed to project land use under the sustainable developmentmodelwith steady grow th of population and economy,and amoderate climate change.The structure flow chart for the FLUSmodel ispresented in Figure2.
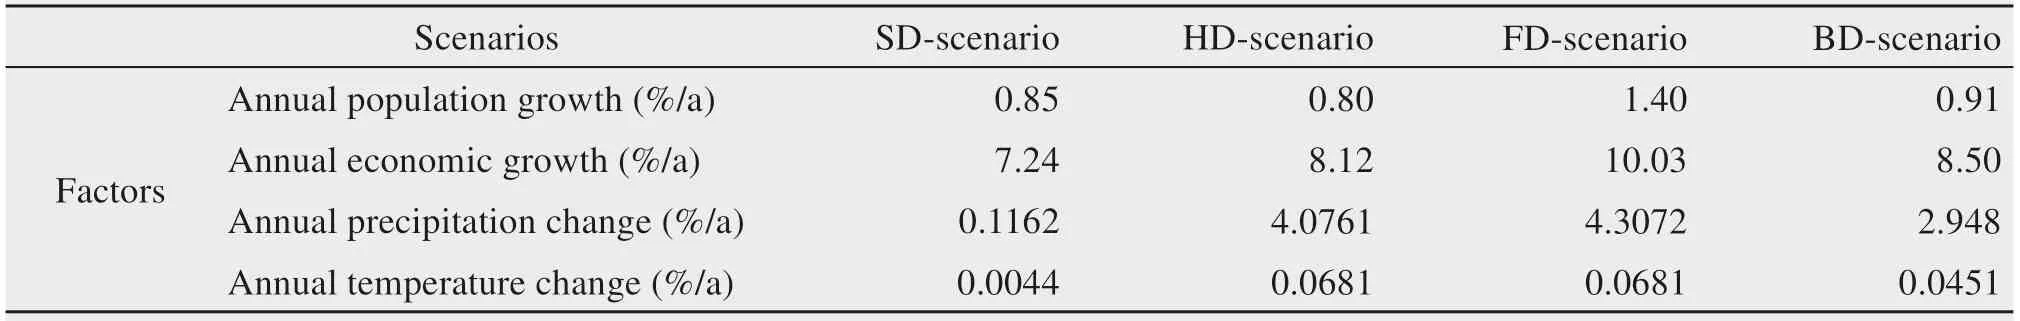
Table 2 Parameters determ ination for the four scenarios in Qinghai-TibetPlateau(Liu etal.(2017b))
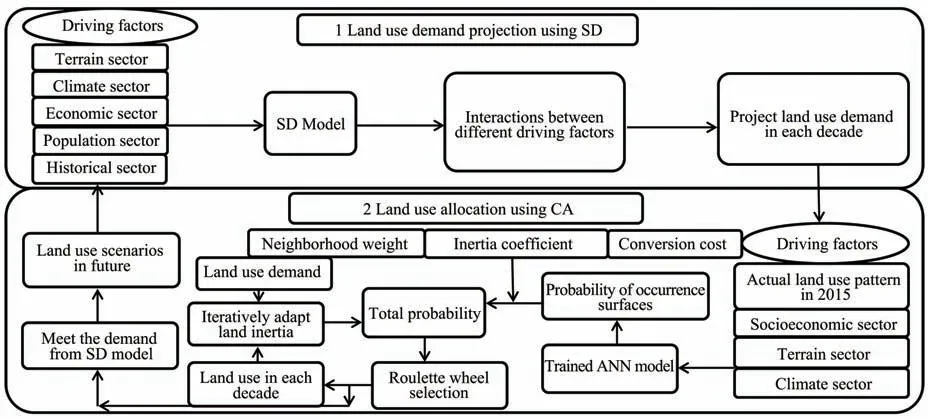
Figure 2 Flow chartof the FLUSmodel
3 Results
3.1 Spatio-temporal patterns of ELPL
Figure 3 presents spatio-temporal patterns related to ELPL changes.Obvious differences were observed in ELPL thatare characterized by a decrease in PL and an increase in EL and LL.PL dim inished considerably,from 19,762 hm2in 1990 to 9,724 hm2in 2015,with a decrease proportion of 20.79%.The EL area increased from 21,749 hm2in 1990 to 26,634 hm2in 2010,but therewas a slightdecline in 2015.The U-RLL area expanded sharply with an increase of 5,647 hm2,reaching 12,397 hm2in 2015,up from 13.98%to 25.69%.The APL area was greatly reduced by 10,632 hm2in 25 years,and the proportion decreased from 40.53%to 18.51%.FEL covered the top largest land area with 21,136 hm2and 20,924 hm2in 2010 and 2015,respectively,accounting for43.8%and 43.36%of the totalarea of Xining City.The GEL,WPL and IPL areas increased,and the OEL areawas the smallest,accounting for0.63%in 2015(Figure 4a).
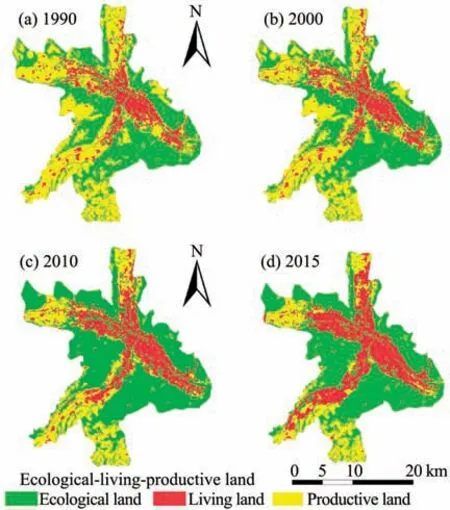
Figure 3 Firstclassification of ecological-living-productive land in Xining City
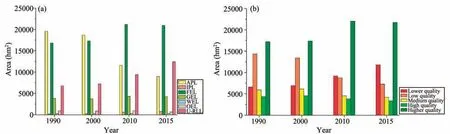
Figure 4 A reasof ecological-living-productive land(a)and eco-environmentalquality grade(b)from 1990-2015.APL:agriculture productive land;IPL:industry productive land;FEL:forestry ecological land;GEL:grassecological land;WEL:waterecological land;OEL:otherecological land;U-RLL:urban and rural living land
Comparison of the land use change trend occurring in the transfermatrix is displayed in Tables 3,4,5.From 1990 to 2000,590.77 hm2and 530.57 hm2of changes in APL involved conversion to FEL and URLL with transformation ratios at 3%and 2.7%,respectively.During this time,portions of FEL,GEL and U-RLL weremainly converted to APL,with conversion areas of 104.21 hm2,167.42 hm2and 129.04 hm2,respectively.Other types of land transformations were notobvious(Table 3).
During 2000-2010,the largest conversion of APL to FEL,GEL and U-RLL occurred,with 4,099 hm2,696 hm2and 2,277 hm2,respectively.The area of APL was greatly reduced,with a decrease of 7,091 hm2,or 14.69%.Despite the proportion of IPL in ELPL was small,the area of IPL increased so as to meet the needs of econom ic development.Many industrial parks have been established,such as Beichuan,Dongchuan and Nanchuan.During the same period,areas of FEL were increased greatly,which implied that EL isbeing protected and getting stronger(Table 4).
The largest increase involved conversion of APL to U-RLL with 2,540 hm2in 2010-2015(Table 5).URLL also encroached OEL and the occupied areas were greater than that observed in previous years.When the city reached a certain size,the U-RLL was so lim ited that it could notmeet the needs of socialeconom ic development,promoting competition between different land types,resulting in reductions of EL and PL.
3.2 Regional ecological quality analysis
Figures 5 and 6 illustrate the spatial pattern involved for sevenmain types of land use and eco-environmentalquality.APL and FEL werew idely distributed on the outskirts of the city,while U-RLL was concentrated downtown,which is closely related to topographical factors(i.e.,elevation,slope).Correspondingly,the eco-environmental quality in the suburbs was better than in the city center.Based on Equation(2),the eco-environmental quality index was 0.5206 in 1990,increased to 0.5733 in 2010,and declined to 0.5652 in 2015.The increased area of EL land(FEL,GEL and WEL)caused an increase in the eco-environmental quality index,whereas the expansion of U-RLL encroached on APL,FEL and GEL,which lead to a decline in the ecologicalquality index in 2015.
Figure 4b shows that areas of eco-environmental quality grade from 1990 to 2015 were:lower-quality and higher-quality areas continuously increased,while low-quality,medium-quality and high-quality areas gradually decreased.The lower-quality area increased from 6,551 hm2in 1990 to 11,798 hm2in 2015,and the proportion increased from 13.58%to 24.45%.The higher-quality area,expanded very quickly,representing an increase of 4,543 hm2and 10.87%of the total land area.
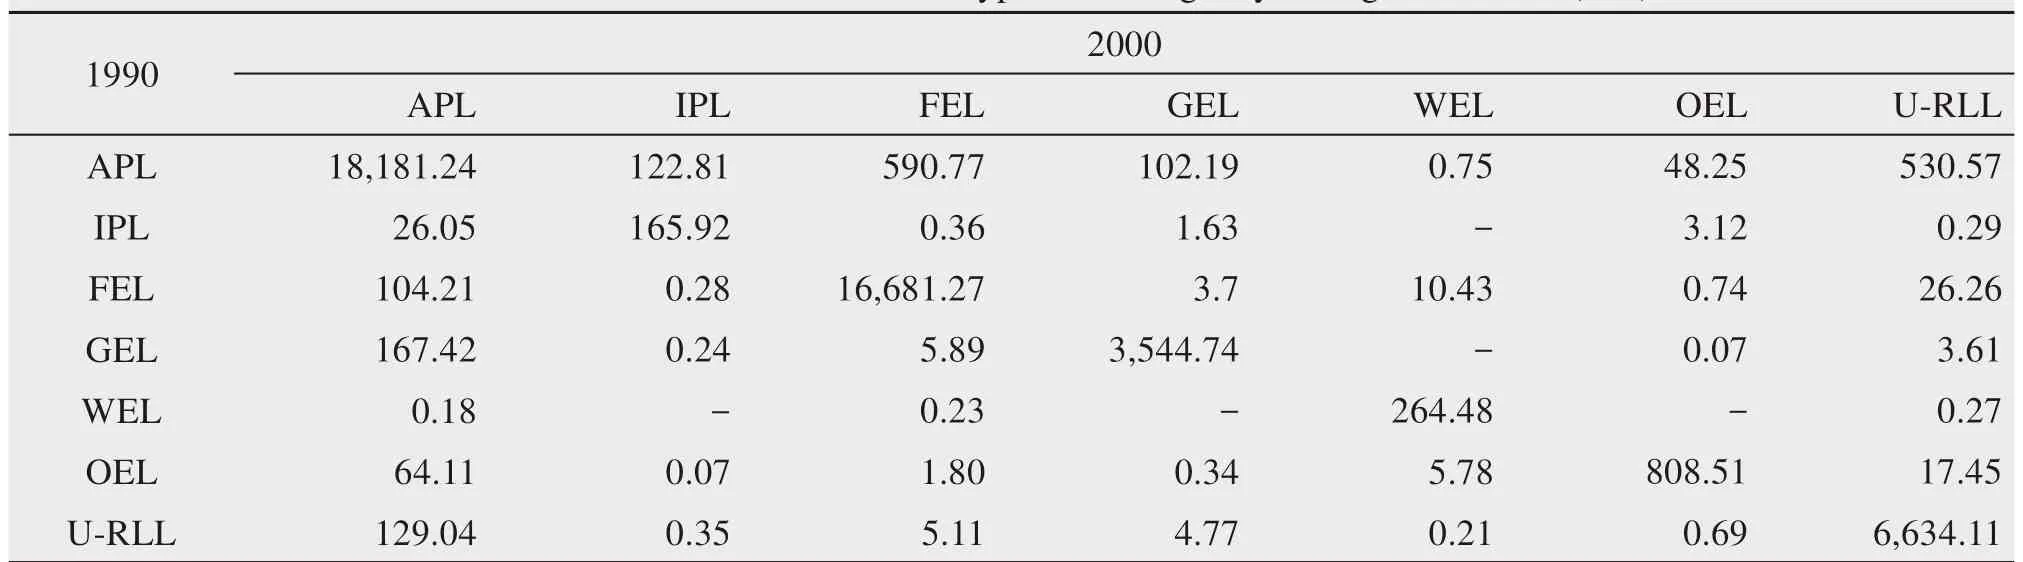
Table 3 Transitionmatrix of land use types in Xining City during 1990-2000(hm2)

Table 4 Transitionmatrix of land use types in Xining City during 2000-2010(hm2)
3.3 Ecological environment contribution ratio
From 1990 to 2015,a large amount of APL was transformed into FEL,which was themain factor underlying the improvement in eco-environmental quality,and the contribution ratio was 53.5%(1990-2000),80.1%(2000-2010)and 33.1%(2010-2015)(Table 6).In addition,the transformation of OEL into WEL also played a significant role in promoting the eco-environmental quality from 1990-2000,with a proportion of 23.7%.Moreover,the conversion of APL to GEL was crucial for improving the eco-environmental quality and accounted for a proportion of 11.6%from 2000-2010.
It was also observed that U-RLL devours a large amount of APL,which was themajor reason for the destruction of the eco-environmental quality.The proportion of destroying eco-environmental quality was 40.1%(1990-2000),77.6%(2000-2010)and 51.7%(2010-2015)(Table 6).In addition,FEL and GEL were transformed into APL,and their contribution to the destruction of the eco-environment was 16.4%and 22.6%from 1990-2000,respectively.The conversion of FEL to U-RLL was also an important reason for the deterioration of the eco-environment from 2010-2015.
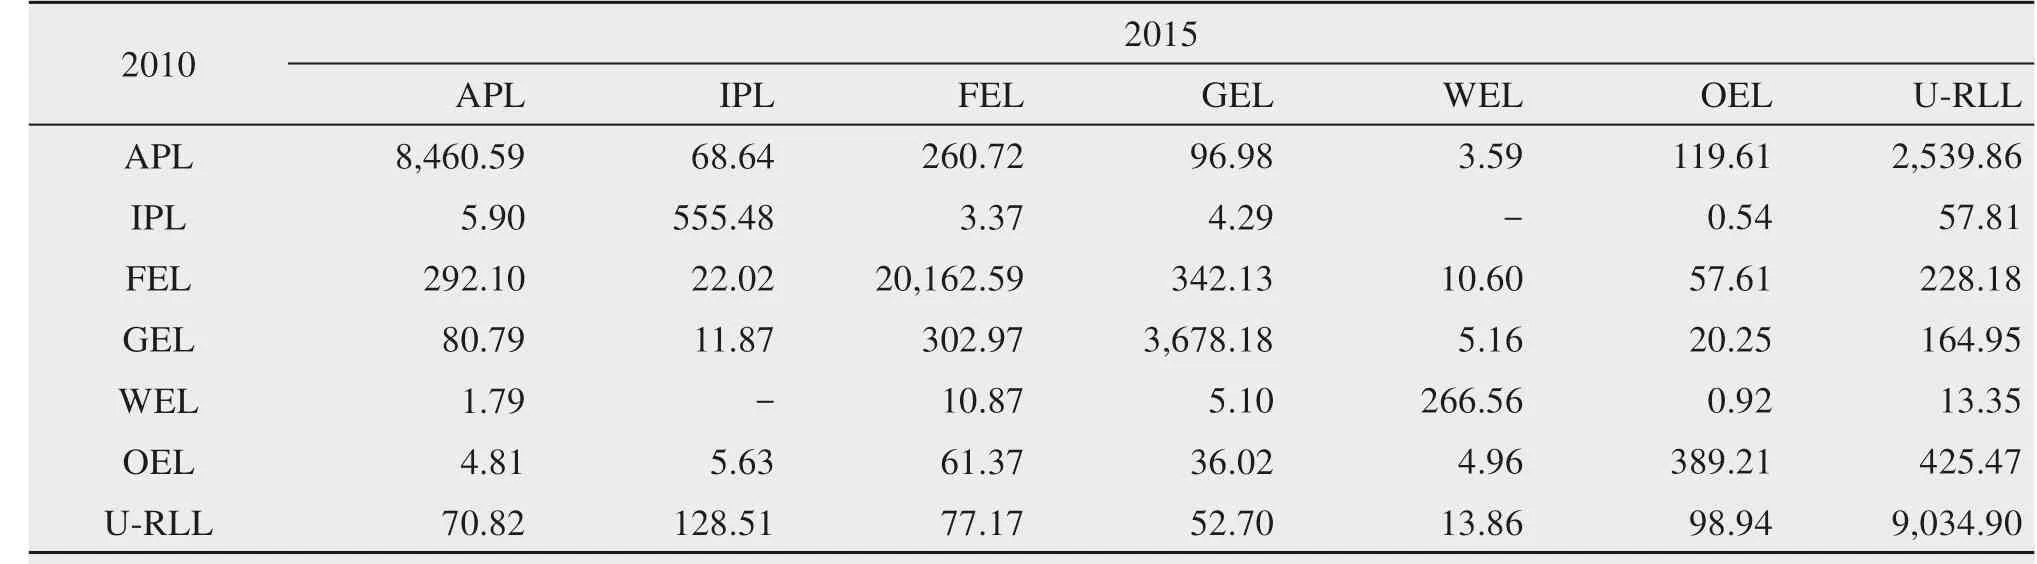
Table 5 Transitionmatrix of land use types in Xining City during 2010-2015(hm2)
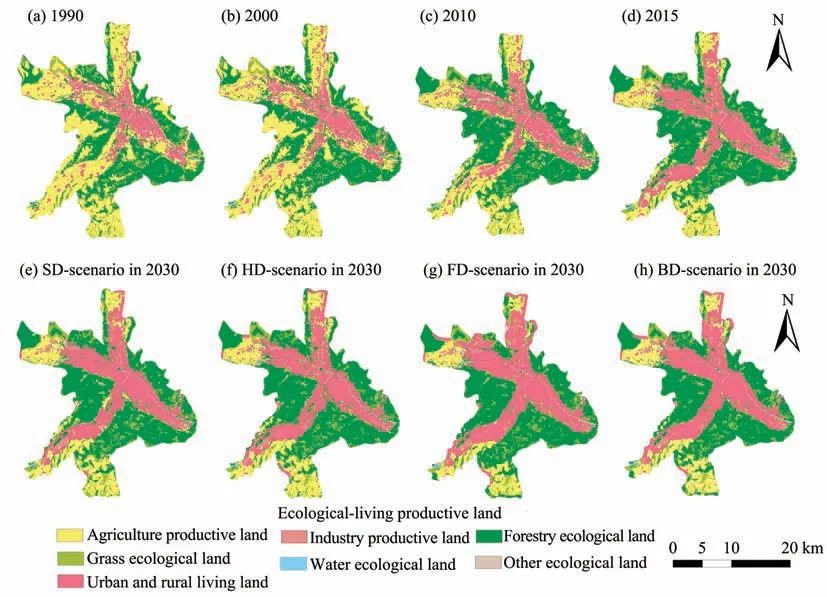
Figure 5 Second classification of ecological-living-productive land in Xining City.BD:baseline development;FD:fast development;SD:slow development;HD:harmonious development
3.4 FLUS model results
The actual ELPL of 2015 and the spatial ELPL simulation in 2015 based on the ground truth land use change for 2000 and 2010 are presented in Figure 7.Results of the kappa coefficient is 0.827 and the overall accuracy is 0.877 indicating that the FLUSmodel and its prediction are highly accurate.
As presented in Figures 5 and 8a,the eco-environmental quality index under the scenarios of SD,HD,FD and BD are estimated at 0.5599,0.5700,0.5503 and 0.5522,respectively.As expected,the rapid increase of LL comes at the expense of PL and EL from 2015 to 2030 for the four scenarios due to population grow th and econom ic increase.Of all the land types,APL presents the largest reduction and indicates basic farm land needs to be delineated and wellprotected.URLL shows a sharp increase to the area of 16,440 hm2in the FD-Scenario and the lowest increase to 13,387 hm2in the SD-Scenario.The area of FEL increased by an average of 0.33%each year under the HD-Scenario,with a downward trend in the other three scenarios.The amount of GEL is basically stable in the HDScenario,with the smallestarea under the BD-Scenario.The OEL area show s different degrees of decline in the four scenarios.The areas of eco-environmental quality grades for four scenarios are presented in Figure 8b:the area of lower-quality and higher-quality represent the top two largest proportions,followed by low-quality area,areas of medium-quality and highquality.For a comprehensive consideration in the HDScenario,the higher-quality area accounts for the largest proportion and lower-quality area is lowest and changes in areaswith different land use types are the most reasonable and follow an optimal land use type scheme.
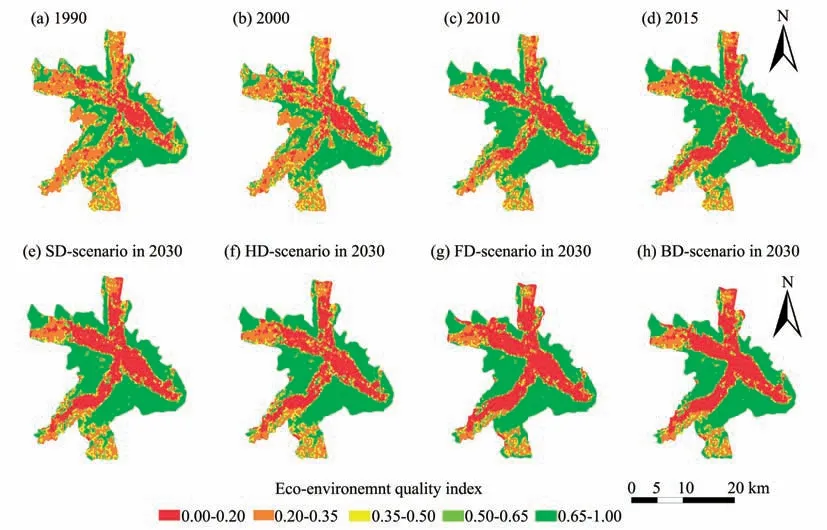
Figure 6 Distribution ofeco-environmentalquality in Xining City.BD:baseline development;FD:fastdevelopment;SD:slow development;HD:harmonious development
4 Discussion
The Chinese government macro policy plays a regulatory role in land use change.Overall,the land use change in Xining City was conducive to improving the quality of the eco-environment.To better protect EL in China,ambitious strategies of returning farm land to forests and grasslands aswell as draw ing ecological conservation redlines(Jiang et al.,2019)and eco-environmental engineering have been under implementation since 2000.Likew ise,Qinghai Province has executed a variety of protection plans such as the Grain-for-Green Project,the Three-North Shelterbelt Project and the Natural Forest Protection Project(Han etal.,2016).A considerable increase in FEL and GEL has been observed bearing in m ind that EL has been proved to have the potential to ameliorate human welfare(Barrett et al.,2011),correspondingly,the eco-environmental quality has greatly improved between 2000 and 2010 compared with 1990.However,from 2010-2015,the encroachment of U-RLL into APL,OEL and FEL led to a slightdecrease in the ecoenvironmental quality,which jeopardizes ecological security.To alleviate this problem,and ensure the rational use of land resources and protect the eco-environment,effective measures need to be taken to reduce the ecological damage.These measures include implementing ecological function zones,building a basic support system for the development of"circulation,green and low-carbon"zones,constructing scientific and reasonable urban development patterns and agricultural development patterns and executing ecological security.This also includes protection measures for various typesof nature reserves,forestparks,geoparks,wetland parks,scenic spots,water conservation areas,and historic cultural relic protection units.

Table 6 Main land use transformation types improving and reducing the regionaleco-environment
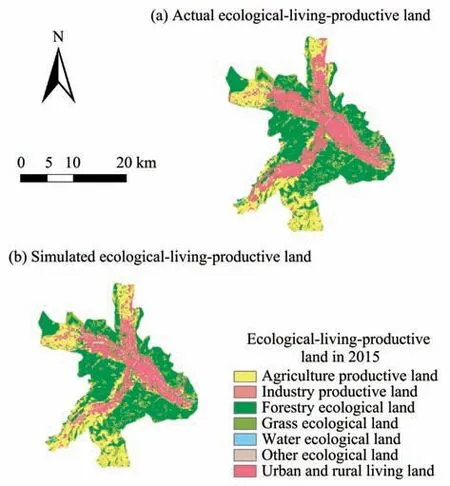
Figure 7 Simulated ecological-living-productive land and the actualecological-living-productive land in 2015
As a provincial capital and imm igrant city,Xining attractsmany people from inside and outside of Qinghai Province due to the relatively perfect infrastructure and better social service facilities,while the expansion of industrial parks and development of tertiary industries has provided more job opportunities.Pressure originating from ongoing population grow th has led to extensive urban expansion in relation to the demand of production and living.In spite of establishing new development zones such as Chengnan and Haihu in an effort to relieve the contradiction between land supply and demand,the lower-quality area increased by 5,247 hm2(Figure 4b),which is in conflict with the goal of sustainable development and should receive sufficient attention.If the lower-quality area remains unchanged,itw ill pose a serious threat to the regional eco-environmental quality.Xining City is located on the Tibetan Plateau,where the eco-environment is extremely fragile,and once destroyed,w ill be very difficult to recover in a short time period.
The FLUSmodel is used here to simulate changes in ELPL in 2030,and includes the BD,HD,FD and SD scenarios(Figure 8).Taking all four scenarios into consideration,under the SD-Scenario,U-RLL slow ly increaseswhich inhibits the expansion of U-RLL area to a certain extentand has an adverse impacton econom ic development.In the FD-Scenario,large-scale U-RLL areas expand substantially and the area of APL and FEL decline drastically,whichmay pose amajor threat to arable land and eco-environmental protection.In the BD-Scenario,the EL area is the lowest among the four scenarios,which is against the goalof constructing ecological civilization cities.The HD-Scenario,however,not only meets the demands for U-RLL for socioeconom ic development but also protects the regional ecoenvironment,optim izes the ELPL patterns in Xining City and promotes the rationalexpansion of LL.Above all,in the process of urbanization development,we should consider the coordinated balance between urban spraw l and ecological benefits and set the grow th boundaries of various land use types based on reasonable planning prem ises.This w ill ensure that the ecoenvironment is protected,along with continued advancements in econom ic development.
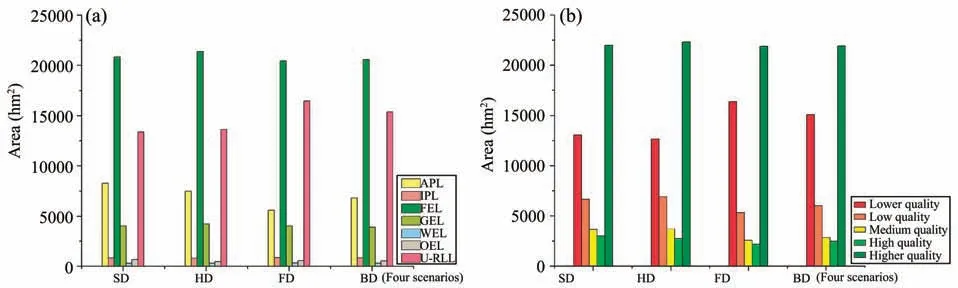
Figure 8 A reasof ecological-living-productive land(a)and eco-environmentalquality grade(b)for four scenarios in 2030.APL:agriculture productive land;IPL:industry productive land;FEL:forestry ecological land;GEL:grassecological land;WEL:waterecological land;OEL:otherecological land;U-RLL:urban and rural living land;BD:baseline development;FD:fastdevelopment;SD:slow development;HD:harmonious development
There are some limitations in our research.First,the ELPL classification system only considered the dominant functions of the land,and other functionsand information affecting spatial optimization should also be considered(Cai et al.,2018);Second,the FLUS model isused to simulate future land use change.Amajor lim itation of thismodel are transition rules,including conversion cost and the well-trained ANN model(Liu etal.,2017b),whichmay change over a long time period;however,they remained unchanged during the simulation process.Third,land use change is influenced by a variety of driving factors,such as the complexity and diversity of the economy,society,environment,policies,analyzing and simulating all these activities is difficult(Hoyos et al.,2018;Jia et al.,2018).Elaborate parametersmay affect the credibility of simulation results;we only briefly considered four scenarios in this article.In future studies,we w ill investmore time to address these problems.
5 Conclusions
The ELPL classification system emphasizes the harmonious development between human activity and sustainable land use.A FLUSmodel is used to predict future land use in 2030 by coupling human and natural effects.This paper analyses the influence of ELPL changes on eco-environmental quality in Xining based on leading function of production,ecology and living and the FLUSmodel.
(1)During the research period,ELPL of Xining City changed significantly,characterized by the reduction in the PL area and an increase in EL and LL areas.FEL took up the top largest proportion of land,APL had the largest reduction in area,and U-RLL experienced a dramatic increase.
(2)On the one hand,the conversion of APL to FEL and GEL led to an increase in the eco-environmental quality index.On the other hand,it is worth noting that the largest conversion of APL to U-RLL dilapidated land with ecological function resulting in an ongoing increase in the lower-quality area.
(3)In the HD-Scenario,changes in ELPL are the most reasonable and follow an optimal land use type scheme.This scenario not only meets the socioeconom ic development demand for urban spraw l butalso redoubles the land with ecological functions and ensures ecological security.These results can provide a valuable reference for local policy-makers.
Acknow ledgments:
The authors are grateful for the support of the National Natural Science Foundation of China(No.41661038)and Soft Science Research Project of Science and Technology Departmentof Qinghaiprovince(No.2015-ZJ-602).
 Sciences in Cold and Arid Regions2019年3期
- Sciences in Cold and Arid Regions的其它文章
- Vice p resident Zhang visited Cryosphere Research Station in A laska,Northwest Institute of Eco-Environment and Resource,Chinese Academ y of Sciences
- Risk prevention and controlstrategies for the severely affected areasof snow disaster in the Three Rivers Source Region(TRSR),China
- A landscapem anagementanalysis framework and its prelim inary app lication in Ejina Oasis,Northwest China
- Stem radialgrow th indicate the optionsof species,topography and stand management for artificial forests in thewestern Loess Plateau,China
- MODISobserved snow cover variations in theAksu River Basin,Northwest China
- Variation and relationship between soilm oisture and environm ental factors in the source region of the Yangtze River from 2005 to 2016