
Variation and relationship between soilm oisture and environm ental factors in the source region of the Yangtze River from 2005 to 2016
2019-07-10 09:53:16LingLingSongZongJieLiQingTianLieFuWangJingHeRuiFengYuanJuanGuiBaiJuanZhangYueMinLv
LingLing Song,ZongJie Li,Qing Tian*,LieFuWang,Jing He,RuiFeng Yuan,Juan Gui,BaiJuan Zhang,YueM in Lv
1.College ofForestry,Gansu AgriculturalUniversity,Lanzhou,Gansu 730070,China
2.Key Laboratory ofWestern China's Environmental Systems(Ministry of Education),College of Earth Environmental Science,Lanzhou University,Lanzhou,Gansu 730000,China
3.Key Laboratory ofEcohydrology of Inland River Basin Gansu/Hydrology and Water Resources Engineering Research Center,Cold and Arid Region Environmentand Engineering Research Institute,Chinese Academy of Sciences,Lanzhou,Gansu 730000,China
4.Tuotuohe Meteorological Station,Geermu,Qinghai816099,China
ABSTRACT This study analyzed soilmoisture,soil erosion,and vegetation in the source region of the Yangtze River from 2005 to 2016.We found that soilmoisture showed an increasing trend from 2005 to 2009 but decreased from 2009 to 2016.The surface soilmoisturewas severely affected by seasonal changes in the source region of the Yangtze River,especially in the soil from 0 to 40 cm.However,seasonal variation of soilmoisture deeper than 40 cm was different from that in the upper layer.Soilmoisture below 40 cm wasn'taffected by the seasonal variation.Soilmoisture from 0 to 50 cm and the average thicknessofw ind deposition showed a positive correlation in the study area from 2005 to 2016.Forenvironmental protection in the source region of the Yangtze River,w ind deposition played a role in water retention.Sim ilarly,a positive correlation also existed between the average thickness ofw ind erosion and soilmoisture.Deep-soilmoisturewas the key factor for vegetation structure on the Qinghai-Tibet Plateau.The results are also helpful for further understanding the variation of soilmoisture on the Tibetan Plateau and providing a scientific basis for effectively protecting and controlling the ecologicalenvironment in the future.
Keywords:soilmoisture;soilerosion;vegetation;source region of the Yangtze River
1 Introduction
Climate change hasmade a significant impact on ecosystems throughout theworld.Glaciers,frozen soil,and alpine-grassland ecosystems closely related to frozen soil,have changed significantly(Bubier et al.,1999;M cGuire etal.,2002;Walker etal.,2003;Wang et al.,2005;Zeng et al.,2015).These weak environmental components are very sensitive to global change and also accelerate the change(Wen and Su,2003).Soilmoisture is one of the important parameters of hydrology and ecology.Soilmoisture influences the exchange of energy and water in the earth-atmosphere system through the influence of the infiltration of rainwater and sub-evaporation(Chen etal.,2013;Li etal.,2013;Su etal.,2013).Additionally,soilmoisture is an important component of the globalwater cycle.And it is also necessary to understand and research the global water cycle(Yang etal.,2011;Liu etal.,2013).
Grassland on the Qinghai-Tibet Plateau is one of the largest grassland systems in the world(Fu et al.,2012).Soilmoisture is one of the key factors that affect the ecological process,the ecological carrying capacity for alpine grassland,and the restoration and reconstruction of degraded grassland on the Qinghai-Tibet Plateau(Fu et al.,2012;Hu et al.,2015;Li etal.,2015).In the alpine-meadow region of the Qinghai-Tibet Plateau,soilmoisture is notonly themain lim iting factor for plant grow th and vegetation restoration but also one of themain factors affecting the stability of the ecological environment and the engineering of frozen soil(Yu etal.,2014;Zhao et al.,2014;Hayashi et al.,2015).At the same time,soil moisture is closely related to the freeze-thaw erosion process.In the alpine-meadow region of the Qinghai-Tibet Plateau,a specialecologicalhydrological structure different from that of other regions has formed due to the intense,long-term freeze-thaw action and the existence of ground ice(Cheng and Zhao,2000;Wu et al.,2003).Soil moisture is an important water resource in frozen-soil regions,and it is of great significance in the evolution and reconstruction of frozensoil ecosystems.Due to the increase of soil-water loss caused by climate warm ing and the expansion of human activities,the grassland ecosystem has shown a trend of accelerated degradation since the 1980s.Therefore,the problem of soilmoisture and itsecological effects to the Tibetan Plateau has become one of the hot spots in current research(Cheng and Zhao,2000;M cGuire et al.,2002;Cui et al.,2016;Sun et al.,2016;Zhu etal.,2016).
This study analyzed the variation of soilmoisture,the relationship between soilmoisture and w ind erosion,and the relationship between soilmoisture and vegetation in the source region of the Yangtze River from 2005 to 2016.The main purposes of this paper are(1)to analyze the variation of soilmoisture in the source area of the Yangtze River from 2005 to 2016;(2)to investigate the change rules for annual and seasonal variation of soil moisture against the background of global environmental change in the source region of the Yangtze River;and(3)to evaluate the relationship between soil moisture and w ind erosion and vegetation in the study area.The results are also helpful for providing further reference data for analyzing the change rule of soilmoisture and providing a scientific basis for ecological environment protection for the whole Sanjiang-source protection area and the whole Qinghai-Tibet Plateau,as well as providing a scientific basis for further research.
2 M aterials and m ethods
2.1 Study area
The source region of the Yangtze River is located in the hinterland of the Qinghai-Tibet Plateau at 90°43′E-96°45′E,32°30′N-35°35′N(Figure 1).The region—which includes Zhiduo County,Qumalai County,the town of Tanggula in the city of Geermu,Yushu County,and Chenduo County—controls a drainage area of about 1.38×10⁵km2(Fang et al.,2011).The basin has fivemajor rivers:the Chumaer,Tuotuo,Gaerqu,Buqu,and Dangqu(Yu et al.,2014;Hayashi et al.,2015).The source region of the Yangtze River is one of themain distribution areas of the plateau wetland on the Qinghai-Tibet Plateau and is also themost concentrated area of glacier distribution in the study region.The glacier area accounted for more than 89%of the entire Sanjiang-source region(Li et al.,2012;Qi et al.,2015).The climate in the source region of the Yangtze River is that of a typical plateau of a cold climate.The climate are characterized by low heat and strong radiation(Hayashi et al.,2015).From the southeast to the northwest,the difference in the temperature and precipitation gradientwas significant.The annual average temperature was only 3.0-5.5°C.Thewarmestmonth was July,with an average temperature of 3.0-17.3°C.Some areas did not even reach an accumulated temperature higher than 10°C.Therewas no absolute frost-free period;the annual precipitation was 221.5-515.0 mm(Fang et al.,2011;Li et al.,2012;Yu et al.,2014;Hayashi et al.,2015;Qi etal.,2015).
2.2 Observation
With the Tuotuohe Meteorological Station as the observation point,soil moisture,w ind erosion,and vegetation situations in the study areawere systematically observed from 2005 to 2016.The altitude of the observation site(92.26°N,34.13°E)was4,533.1m.Four sample sites(20m×5m)were selected random ly in the observation field at themeteorological station.The sampling time was from April to October each year.During the samp ling month,samp ling happened at day 10,day 20,and the end of themonth.The depth of soil sampling was 0-10 cm,>10-20 cm,>20-30 cm,>30-40 cm,and>40-50 cm.Soilmoisturewasmeasuredmainly by a soil tube profilemoisture meter,an instrument that can directly measure soilmoisture.It can simultaneously measure soil parametersatdifferentdepthsand upload them to the data center through the GPRS(GSM)network.The sampling method was used to investigate vegetation status,including forage height,vegetation coverage,and grassland yield.This study selected a natural observation field(20m×5m),and five plots(1m×1m)were observed.Vegetation coverage wasmainly measured by the vegetation-coverage observation system.The surface vegetation-coverage photogrammetry system included a portable vegetation-coverage photogrammeter and an automatic calculation system of surfacevegetation coverage.Hardware is one part of the system.Even with the portable vegetation-coverage photogrammeter,its function is to take vertical photographs to obtain vegetation-coverage images.Another part of the system is the PCOVER software.Its function is to process the acquired image and calculate the vegetation coverage automatically.The height of a plant was measured by a steel tape.Desertification wasmainly monitored by the w ind-erosion observation system.The sampling period of each collection pointwas 15 or 30 seconds.Usually,the sampling period was from 15 seconds to 2 hours.Observations weremade once a day from September to May of the nextyear,and once amonth from June to August.

Figure 1 Map show ing the source region of the Yangtze River
3 Results
3.1 Annual variation of soil moisture
As shown in Figure 2,the annual variation showed a significant change from 2005 to 2016 in the source region of the Yangtze River.Soil moisture showed an increasing trend from 2005 to 2009 but decreased from 2009 to 2016.From the trend of the line in Figure 2a,it can be seen that the soil moisture in 2009 was the highest of any year from 2005 to 2016;the lowest was in 2016.This change may be related to climate factors in the study area.For soil layers from 0 to 10 cm,the average soil moisturewas 11.58%.The highest value appeared in 2009 and the lowest in 2006.As with the 0-10 cm layer,the highest value of soilmoisture for layers at 10-20 cm,20-30 cm,30-40 cm,and 40-50 cm all happened in 2009.However,the lowest values of soilmoisture for 10-20 cm,20-30 cm,30-40 cm,and 40-50 cm allappeared in 2016.The order of soilmoisture for the layers 0-10 cm,10-20 cm,20-30 cm,30-40 cm,and 40-50 cm was 40-50 cm>30-40 cm>20-30 cm>10-20 cm>0-10 cm,with the means being 13.26%,12.90%,12.78%,12.06%,and 11.58%,respectively(Figure 2b).Soilmoisture increased with increasing soil depth.The average soilmoisturewas 12.86%in 2005,10.78%in 2006,11.75%in 2007,13.35%in 2008,17.40%in 2009,13.02%in 2010,12.89%in 2011,12.76%in 2012,11.63%in 2013,13.23%in 2014,10.76%in 2015,and 9.74%in 2016,which indicated therewas a new low in 2016.The new low in soilmoisture suggested that the vegetation grow th in the study area faced unprecedented challenges.At the same time,protection of the ecological environment in the study area w ill face new challenges.

Figure 2 Annualvariation of soilmoisture in the study area
3.2 Seasonal variation of soil moisture
The seasonal variation of soilmoisture is shown in Figure 3.The order of soilmoisture for the layer from 0 to 10 cm in the source region of the Yangtze River was summer>autumn>spring,with themean values being 12.89%,11.92%,and 8.97%,respectively(Figure 3a).Aswith the layer from 0 to 10 cm,the order of soilmoisture from 10 to 20 cm(Figure 3b),from 20 to 30 cm(Figure 3c),and from 30 to 40 cm(Figure 3d)in study area was summer>autumn>spring.This pattern indicates that the surface soilmoisturewas severely affected by seasonal changes in the source region of the Yangtze River,especially the soil from 0 to 40 cm.The soil moisture from 0 to 40 cm in summer was higher than in spring and autumn,as summer was the season in the study area.Spring was the start time for the ablation period,and autumn was the end of the ablation period(Li etal.,2006;Zhang etal.,2016).However,the order of soilmoisture from 40 to 50 cm in the source region of the Yangtze River was summer>spring>autumn,with themean values being 13.78%,13.47%,and 12.52%,respectively(Figure 3e).It showed that the soilmoisture from 0 to 40 cm had the same seasonal variation,but the seasonal variation of soilmoisture below 40 cm was different from that in the upper layer.This finding indicated that the soil moisture below 40 cm wasn'taffected by seasonalvariation.The soilmoisture from 40 to 50 cm in summer was greater than in spring and autumn aswell.But the soil moisture in spring was greater than in autumn,which suggests that the seasonal frozen soil began to melt,and the forage grasswas justbeginning to sprout in spring(Gao et al.,2016).Forage grass grow th required less water.Under the action of gravity,soil moisture concentrated in the deep soil;so the deep soil contained a lotofwater in spring.However,the transpiration of forage grass took part of the soil moisture;and evaporation from the land consumed part of the soilmoisture in the autumn;so soilmoisture in autumn was less than in spring.
4 Discussions
4.1 The relationship between soil moisture and wind erosion
In order to discuss the relationship between soil moisture and w ind deposition in the source region of the Yangtze River,this study analyzed the correlation between soil moisture and the average thickness of w ind deposition.As shown in Figure 4,there was a positive correlation between the average thickness of w ind deposition and soilmoisture from 0 to 10 cm(R2=0.040).The higher the average thickness of w ind deposition was,the greater the soil moisture from 0 to 10 cm(Figure 4a).This pattern suggests that a greater average thickness of w ind deposition should prevent the evaporation of soilmoisture.As with soilmoisture from 0 to 10 cm,there was also a positive correlation between the average thickness of w ind deposition and soilmoisture from 10 to 20 cm(Figure 4b),from 20 to 30 cm(Figure 4c),from 30 to 40 cm(Figure 4d),and from 40 to 50 cm(Figure 4e).These findings further support the above analysis and indicate that the average thickness of w ind deposition could protect soilmoisture in the source region of the Yangtze River.However,the saliency of the positive correlation for soilmoisture from 40 to 50 cm(R2=0.10)was higher than for soilmoisture in the other soil horizons.The saliency of the positive correlation for soil moisture from 0 to 10 cm came second;third was the soilmoisture from 20 to 30 cm(R2=0.036).This pattern suggests that the protective effect of the average thickness of w ind deposition on soil moisture from 40 to 50 cm was the greatest,and the influence of soilmoisture from 0 to 10 cm came next.In aword,soilmoisture and the average thickness of w ind deposition showed a positive correlation in the study area from 2005 to 2016.For environmental protection in the source region of the Yangtze River,w ind deposition played a role in water retention.

Figure 3 Seasonal variation of soilmoisture in the study area

Figure 4 The relationship between soilmoisture and the average thicknessofw ind deposition
Figure 5 shows the relationship between soilmoisture and the average thickness of w ind erosion.As with the average thickness ofw ind deposition,a positive correlation also existed between the average thickness of w ind erosion and soilmoisture.But the increasing trend of soilmoisturewith the increase for the average thickness of w ind erosion showed amore significant trend than that for w ind deposition.As shown in Figure 5a,there is a positive correlation between the average thickness of w ind erosion and soil moisture from 0 to 10 cm(R2=0.13),which indicates that the average thicknessofw ind erosion notonly reduced soilmoisture but also increased soilmoisture.The average thickness of w ind erosion and soilmoisture from 10 cm to 20 cm shows a positive correlation(R2=0.12),too.And there is a positive correlation between the average thickness of w ind erosion and soil moisture from 20 to 30 cm(R2=0.13),from 30 to 40 cm(R2=0.084),and from 40 to 50 cm(R2=0.18).This relationship further suggests that soil erosion also protected soil moisture in the study area.In general,the evaporation of soilmoisture increased with the increase of w ind-erosion thickness(Ma et al.,2014).However,soilmoisture in the study area increased with the increase of w ind-erosion thickness.To resolve this question,we can continue to research the subject.
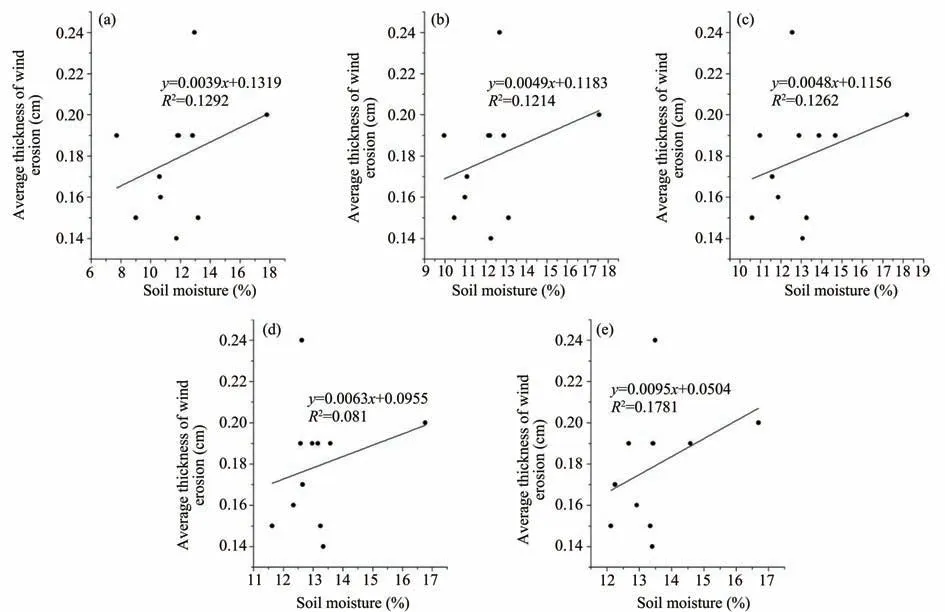
Figure 5 The relationship between soilmoisture and the average thicknessofw ind erosion
4.2 The relationship between soil moisture and vegetation
The relationship between soilmoisture and forage grass height is shown in Figure 6.Whether in soilmoisture from 0 to 10 cm(Figure 6a),from 10 to 20 cm(Figure 6b),from 20 to 30 cm(Figure 6c),from 30 to 40 cm(Figure 6d),or from 40 to 50 cm(Figure 6e),there was a significantly negative correlation between soilmoisture and forage grass height in the source region of the Yangtze River from 2005 to 2016.This pattern suggests that the height of forage grass decreased with the increase of soilmoisture from 0 to 50 cm.This finding may indicate that forage grass heightwasmainly controlled by deeper soilmoisture.As shown in Figure 7,the relationship between soilmoisture from 0 to 50 cm and vegetation coverage was not significant in the study area from 2005 to 2016.It shows that the vegetation in this area had adapted to the habitat through a long evolution.And the vegetation had special physiological and ecological characteristics to deal with the changes of soil-moisture content.The relationship between soilmoisture and the yield of forage grass is show n in Figure 8.The relationship between soil moisture from 0 to 30 cm(Figures 8a,8b)and the yield of forage grasswas not significant in the study area from 2005 to 2016.However,there was a positive correlation between soilmoisture from 30 to 50 cm(Figures 8c,8d,8e)and the yield of forage grass in the source region of the Yangtze River.Soilmoisture from 30 cm to 50 cm and maybe from the deeper soil layer could increase the yield of forage grass in the study area.

Figure 6 The relationship between soilmoisture and forage grassheight

Figure 7 The relationship between soilmoisture and vegetation coverage
Based on analysisof the relationship between vegetation and soilmoisture,therewas a significantly negative correlation between soilmoisture from 0 to 50 cm and forage grass height in the source region of the Yangtze River from 2005 to 2016.The relationship between soilmoisture from 0 to 50 cm and vegetation coveragewas not significant in the study area.And the relationship between soilmoisture from 0 to 30 cm and the yield of forage grasswas not significant.But there was a positive correlation between soilmoisture from 30 to 50 cm and the yield of forage grass in the source region of the Yangtze River.On the one hand,deep soil moisture was the key factor for vegetation structure;and this results related to the specialhabitatand vegetation composition.On the other hand,alpine-meadow vegetation on the Qinghai Tibet-Plateau wasmainly dominated by deeply rooted plants.The area of highest water-use efficiency was the distribution area of the rootsystem(Walker etal.,2003).As the observation of soil moisture in this paper was lim ited to soil layers from 0 to 50 cm,the study of deep soilmoisture should be pursued in the future.
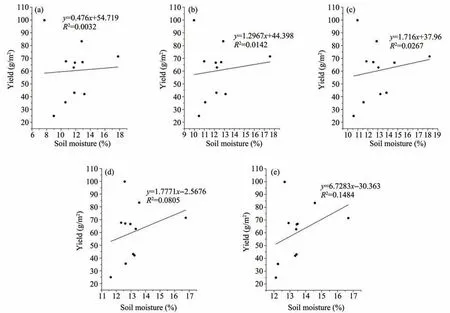
Figure 8 The relationship between soilmoisture and the yield of forage grass
5 Conclusions
Soil moisture showed an increasing trend from 2005 to 2009 but decreased from 2009 to 2016.Meanwhile,the surface soil moisture severely was affected by seasonal changes in the source region of the Yangtze River,especially the soil from 0 to 40 cm.Soilmoisture from 0 to 40 cm had the same seasonal variation;but the seasonal variation of soil moisture below 40 cm was different from that in the upper layer.Soilmoisture below 40 cm wasn'taffected by seasonal variation.Soilmoisture from 0 to 50 cm and the average thickness of w ind deposition showed a positive correlation in the study area from 2005 to 2016.For environmental protection in the source region of the Yangtze River,w ind deposition played a role in water retention.As with the average thickness ofw ind deposition,a positive correlation also existed between the average thickness of w ind erosion and soilmoisture;but the increasing trend of soil moisture with the increase in the average thickness of w ind erosion showed amore significant trend than for w ind deposition.There was a significantly negative correlation between soilmoisture from 0 to 50 cm and forage grass height.The relationship between soil moisture from 0 to 50 cm and vegetation coverage was not significant in the study area;and the relationship between soilmoisture from 0 to 30 cm and the yield of forage grass was not significant.But therewas a positive correlation between soilmoisture from 30 to 50 cm and the yield of forage grass in the study area.Deep-soilmoisturewas the key factor for vegetation structure.Due to lim iting the observation of soil moisture to soil layers from 0 to 50 cm in this study,the study of deep soilmoisture should be pursued in the future.
Acknow ledgments:
This study was supported b y the Discipline Construction Fund Project of Gansu Agricultural University(GSAU-XKJS-2018-109),the Open Foundation of MOE Key Laboratory of Western China's Environmental System,Lanzhou University and the Fundamental Research Funds for the Central Universities(lzujbky-2018-kb01),National"Plan of Ten Thousand People"Youth Top Talent Project,the Youth Innovation Promotion Association,CAS(2013274),Open funding from the Key Laboratory of Mountain Hazards and Earth Surface Process the open funding from State Key Laboratory of Loess and Quaternary Geology(SKLLQG1814),National Key R&D Program of China(2017YFC0404305).
 Sciences in Cold and Arid Regions2019年3期
- Sciences in Cold and Arid Regions的其它文章
- Vice p resident Zhang visited Cryosphere Research Station in A laska,Northwest Institute of Eco-Environment and Resource,Chinese Academ y of Sciences
- Risk prevention and controlstrategies for the severely affected areasof snow disaster in the Three Rivers Source Region(TRSR),China
- A landscapem anagementanalysis framework and its prelim inary app lication in Ejina Oasis,Northwest China
- Stem radialgrow th indicate the optionsof species,topography and stand management for artificial forests in thewestern Loess Plateau,China
- MODISobserved snow cover variations in theAksu River Basin,Northwest China
- Assessing the im pactsof ecological-living-productive land changeson eco-environm entalquality in Xining City on Qinghai-Tibet Plateau,China