基于美拉德反应产物作为荧光和共振瑞利散射的传感平台快速检测阿斯巴甜
赵艳梅,张小林,周 尚,杨季冬,,4*,高 佩
(1.重庆三峡学院 环境与化学工程学院,重庆 404100;2.东肯塔基大学化学系,美国 肯塔基州里士满 40475;3.长江师范学院 化学化工学院,重庆 408100;4.西南大学 化学化工学院,重庆 400715;5.佐治亚州佩恩学院 数学、科学与技术系,美国,佐治亚州奥古斯塔 30901)
阿斯巴甜(Aspartame,APM)是一种合成的有机氨基酸衍生物[1],是被广泛使用的低能量和非碳水化合物甜味剂的食品添加剂[2],其结构见图1。近年来,APM与其他添加剂一起使用,如在食物或化妆品中与防腐剂、抗氧化剂产生协同作用[3]。而APM在低pH和高温下迅速降解为环境污染物。在环境中APM 可降解为氨、酸、醇、醛等有害物,在活体内APM 可在胃肠道代谢为苯丙氨酸、天冬氨酸和甲酸3种成分[4]。此外,过量使用APM 会导致许多健康问题,诸如神经紊乱、听力丧失、记忆力减弱,甚至癌症等疾病[5-7]。因此,APM的分析具有挑战性和实用性。
美拉德反应,又称非酶褐变反应[8-9],涉及羰基化合物(还原糖类)和氨基酸化合物(氨基酸和蛋白质类)之间的缩合[10],形成具有浓郁香味的类黑精大分子化合物及其相关的复杂混合物。美拉德反应主要应用于食品工业和香精领域[11]。
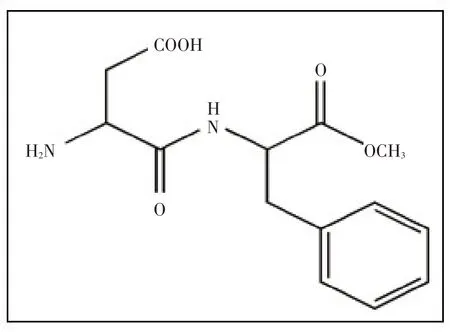
图1 APM的结构图(L-天门冬氨酰-L-苯基丙氨酸甲酯)Fig.1 The structure of APM (L-aspartyl-L-phenylalanine methyl ester)
近年研究表明,荧光检测因在许多环境和生物过程中的敏感性、选择性、简洁性和无损成像特性而备受关注[12-15]。此外,共振瑞利散射(resonance rayleigh scattering,RRS)作为一种新颖快捷的分析技术,已应用于许多领域包括生物大分子药物及其环境等[16-18]。已有报道荧光、RRS探针或传感器[19-20],可同时用作荧光和共振瑞利散射的传感平台则很少见,特别是基于荧光和RRS 的同时变化检测APM的传感平台还少见报道。
本研究利用葡萄糖和L-精氨酸(glucose and L-Arginine,GLA)对Cu2+的螯合能力,以GLACu2+作为荧光和RRS 传感平台检测APM。当APM被引入体系时,荧光形成先猝灭后恢复的“关-开”模式,而RRS 处于先增强后降低的“开-关”状态。另外,荧光恢复程度和RRS 减弱程度都与APM 浓度呈线性关系,因此,在后续的研究中,通过两个线性正相关方程可以很容易地得到APM的检测结果。这说明利用GLA-Cu2+的光谱特征变化作为检测APM 的传感平台是有效和可靠的。因此,本研究提出了一种用于检测APM 的传感平台GLA-Cu2+。实验结果还表明,该平台具有良好的光学性质,对APM 的测定具有较高的灵敏度和选择性。传感平台的设计运用将有利于进行实时环境分析和生物分析。
1 实验
1.1 仪器
采用日立F-4500荧光分光光度计(日本日立公司)记录荧光光谱,狭缝为10 nm。采用英国爱丁堡仪器有限公司的近红外荧光光谱仪FS5 记录了RRS 光谱,狭缝为5 nm。紫外可见UV 2700 分光光度计(日本岛津仪器设备有限公司)被用于记录吸收光谱。采用pHS-3C-02(上海三信仪器设备有限公司,中国上海)测定溶液的pH。所有测量都在正常的实验环境条件下进行。
1.2 试剂
购置的化学品和试剂都为分析纯级。实验用水是双蒸馏水。主要化学试剂为:D-葡萄糖(C6H12O6·H2O,西隆化工有限公司,中国广州),L-精氨酸(C6H14N4O2,阿拉丁实业有限公司,中国上海),三水合硝酸铜(II)[Cu(NO3)2·3H2O,国药控股有限公司,中国上海],氢氧化钠(NaOH,西隆化工有限公司,中国四川),阿斯巴甜(C14H18N2O5,阿拉丁实业有限公司,中国上海),以及羟乙基哌嗪乙硫磺酸HEPES(C8H18N2O4S,百灵威科技有限公司,中国北京)。
制备0.01 mol/L Cu2+和0.01 mol/L APM 的储备液。不同pH 的羟乙基哌嗪乙硫磺酸缓冲液制备:将0.2 mol/L NaOH 与0.4 mol/L HEPES 储备液按不同比例混合配制不同pH 的HEPES 缓冲液,用pH计校准。
1.3 具有光学活性的水溶性GLA探针的制备
美拉德反应产物合成:先将葡萄糖(Glu,0.168 4 g)、L-精氨酸粉末(L-Arg,0.087 2 g)、9.5 mL 超纯水加入三颈烧瓶至满,搅拌1 min。加入0.5 mL 1 mol/L NaOH 溶液再搅拌1 min 形成均匀的溶液。随后,在95 ℃下加热搅拌1 h。最终的溶液经过滤后作为传感平台的活性物质。该活性溶液的浓度为0.05 mol/L,标名为“GLA”,存放在-4 ℃的冰箱中备用。
1.4 荧光和共振瑞利散射实验
首先,将GLA 溶液稀释10 倍用于整个荧光和RRS 实验。将0.8 mL HEPES 缓冲液(pH=7.4)和0.2 mL 稀释的GLA 溶液依次加入10 mL 校准的试管中。随后,在混合溶液中加入1.0 mL 0.01 mol/L Cu2+溶液并分别加入系列浓度的APM溶液。然后稀释至刻度、混合、静置10 min,设置激发波长为334 nm,扫描采集溶液在300~600 nm 波段内的荧光光谱。结果分析以相对荧光强度ΔF=F1-F0记录(F0、F1分别为GLA-Cu2+体系中没有和有APM时的荧光强度),当λex=λem,记录体系的RRS 光谱,ΔIRRS=IRRS-I0RRS,IRRS为反应产物的散射强度,I0RRS为空白的散射强度。
2 结果与讨论
2.1 GLA的光谱特征
为了进一步研究合成的GLA 的光学性质和配体的化学结构,记录了GLA 的UV-vis 吸收光谱和荧光光谱,如图2(a)所示。GLA 的特征吸收峰位于295 nm 处。当激发波长为334 nm,GLA 的荧光光谱在408 nm 处有发射峰,所以GLA 的激发波长与发射波长之间的斯托克位移为74 nm,说明可以消除背景干扰。同时,我们还比较了美拉德反应前后的荧光光谱,如图2(b)所示。在相同的实验条件下,美拉德反应的反应物(Glu和L-Arg)的发射荧光较GLA产物弱,表明亮蓝色荧光来自GLA。
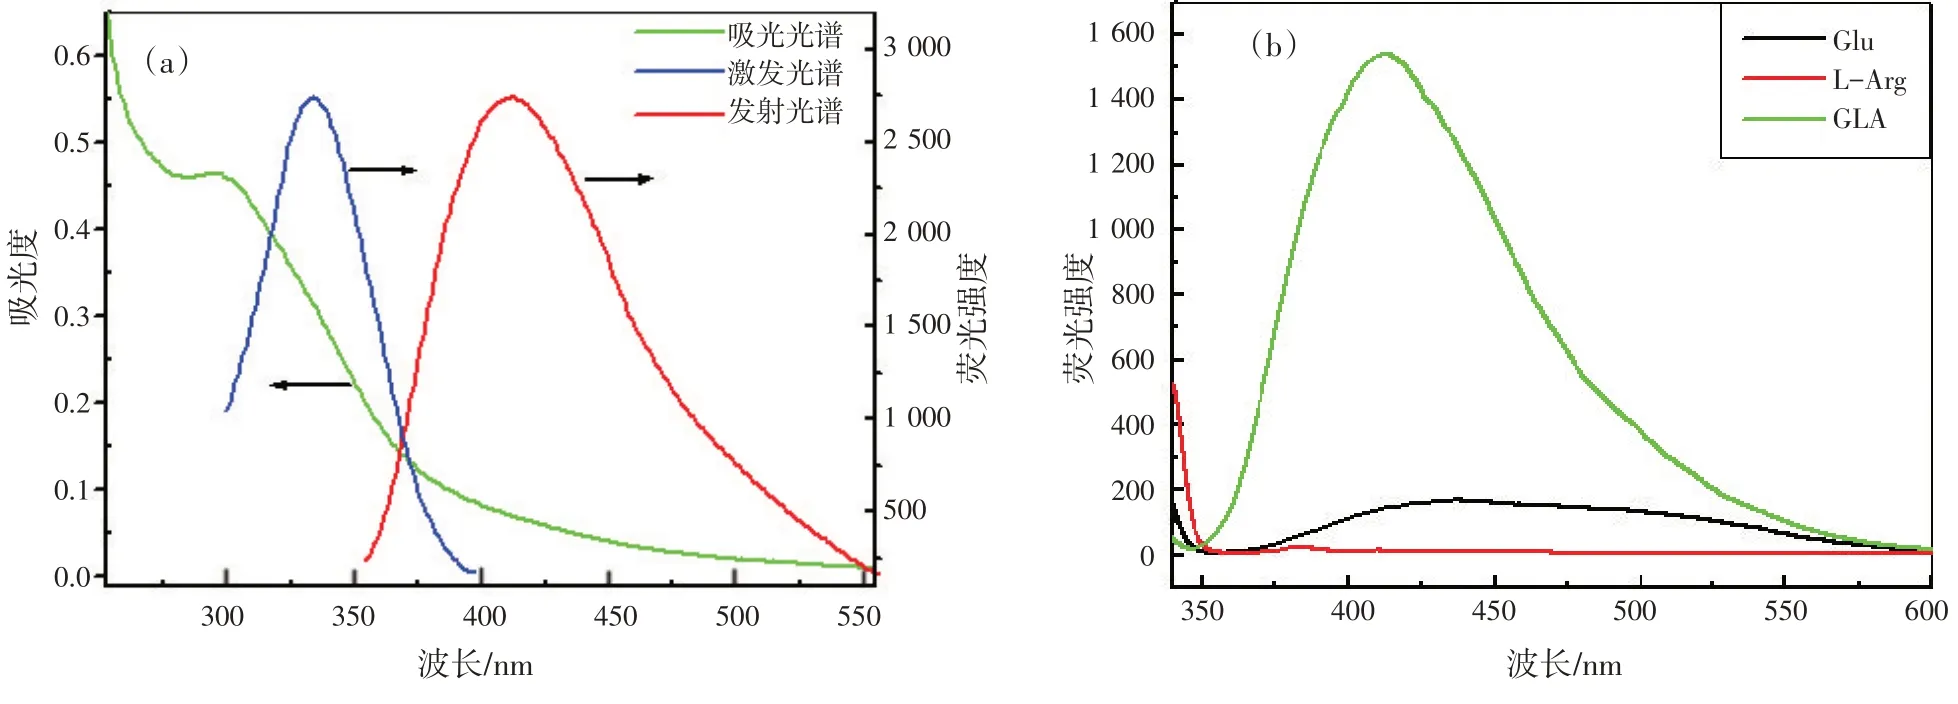
图2 GLA的UV-Vis吸收光谱和荧光光谱(a)以及Glu,L-Arg 和GLA的荧光光谱比较(b)(cL-Arg∶cGlu=1∶2,cGLA=1.0 mmol/L)Fig.2 (a)The UV-Vis absorption and fluorescence spectra of GLA; (b)Comparison of fluorescence spectra of Glu, L-Arg and GLA (cL-Arg∶cGlu =1∶2, cGLA=1.0 mmol/L)
2.2 荧光“关-开”模式检测APM的响应
制备的GLA为水溶性,具有突出的蓝色荧光。由图3 可知,GLA 的最大荧光发射波长为408 nm。在Cu2+存在下,GLA的荧光强度明显减弱,蓝色荧光消退为无色。然而,当将APM 加入体系中时,荧光强度呈线性恢复,再次出现蓝色荧光。因此,GLA-Cu2+可以作为检测APM 有效可靠的荧光检测平台。
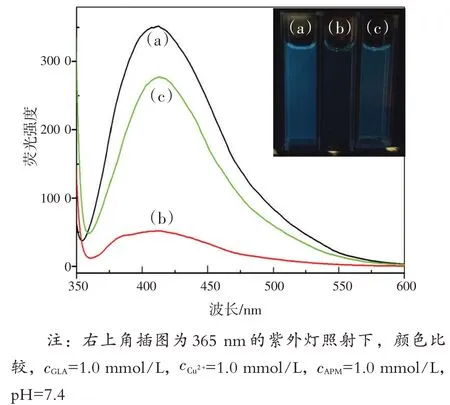
图3 GLA(a),GLA-Cu2+(b),GLA-Cu2+-APM(c)的荧光光谱Fig.3 The fluorescence spectra of GLA (a), GLA-Cu2+(b),and GLA-Cu2+-APM(c)
2.3 RRS“开-关”响应检测APM
为进一步研究GLA- Cu2+与APM 之间的反应,记录了GLA- Cu2+-APM 体系的RRS 光谱。如图4所示,GLA 的RRS 强度很弱,并且没有明显的RRS特征峰。在GLA溶液中加入Cu2+后,在328 nm处出现新的RRS 特征峰。然而,当加入APM 后,RRS 的强度呈线性降低。因此,基于RRS 强度在此不同情况下的简单变化,可用Cu2+结合GLA开发一种用于APM检测的有效的RRS传感平台。
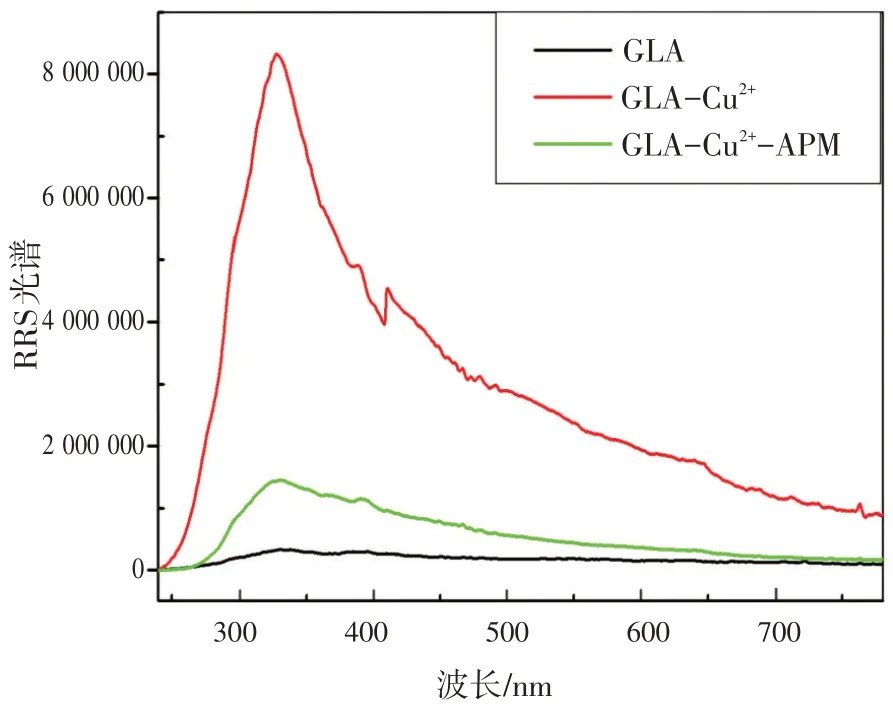
图4 GLA,GLA-Cu2+,GLA-Cu2+-APM的RRS光谱Fig.4 TheRRSspectraofGLA,GLA-Cu2+,andGLA-Cu2+-APM
2.4 条件优化
2.4.1 GLA合成条件的优化
为了获得GLA 最高的荧光强度,对GLA 的一系列合成条件进行了研究。首先,通过改变Glu的量,同时固定L-Arg 的量,研究了两种反应前体对GLA 荧光强度的影响。结果表明,最佳配比为1∶2[图5(a)],并选择该配比制备GLA作为传感平台;其次,温度对美拉德反应速率有重要影响,图5(b)表明了温度对反应速率的影响,95 ℃被选为合成温度;然后考察合成时间,如图5(c)所示,获得GLA 产物需要反应1 h;最后,研究了溶液pH对荧光强度的影响,从图5(d)可以看出,在pH 为11.25 时荧光强度达到最大,为美拉德反应的最佳pH。
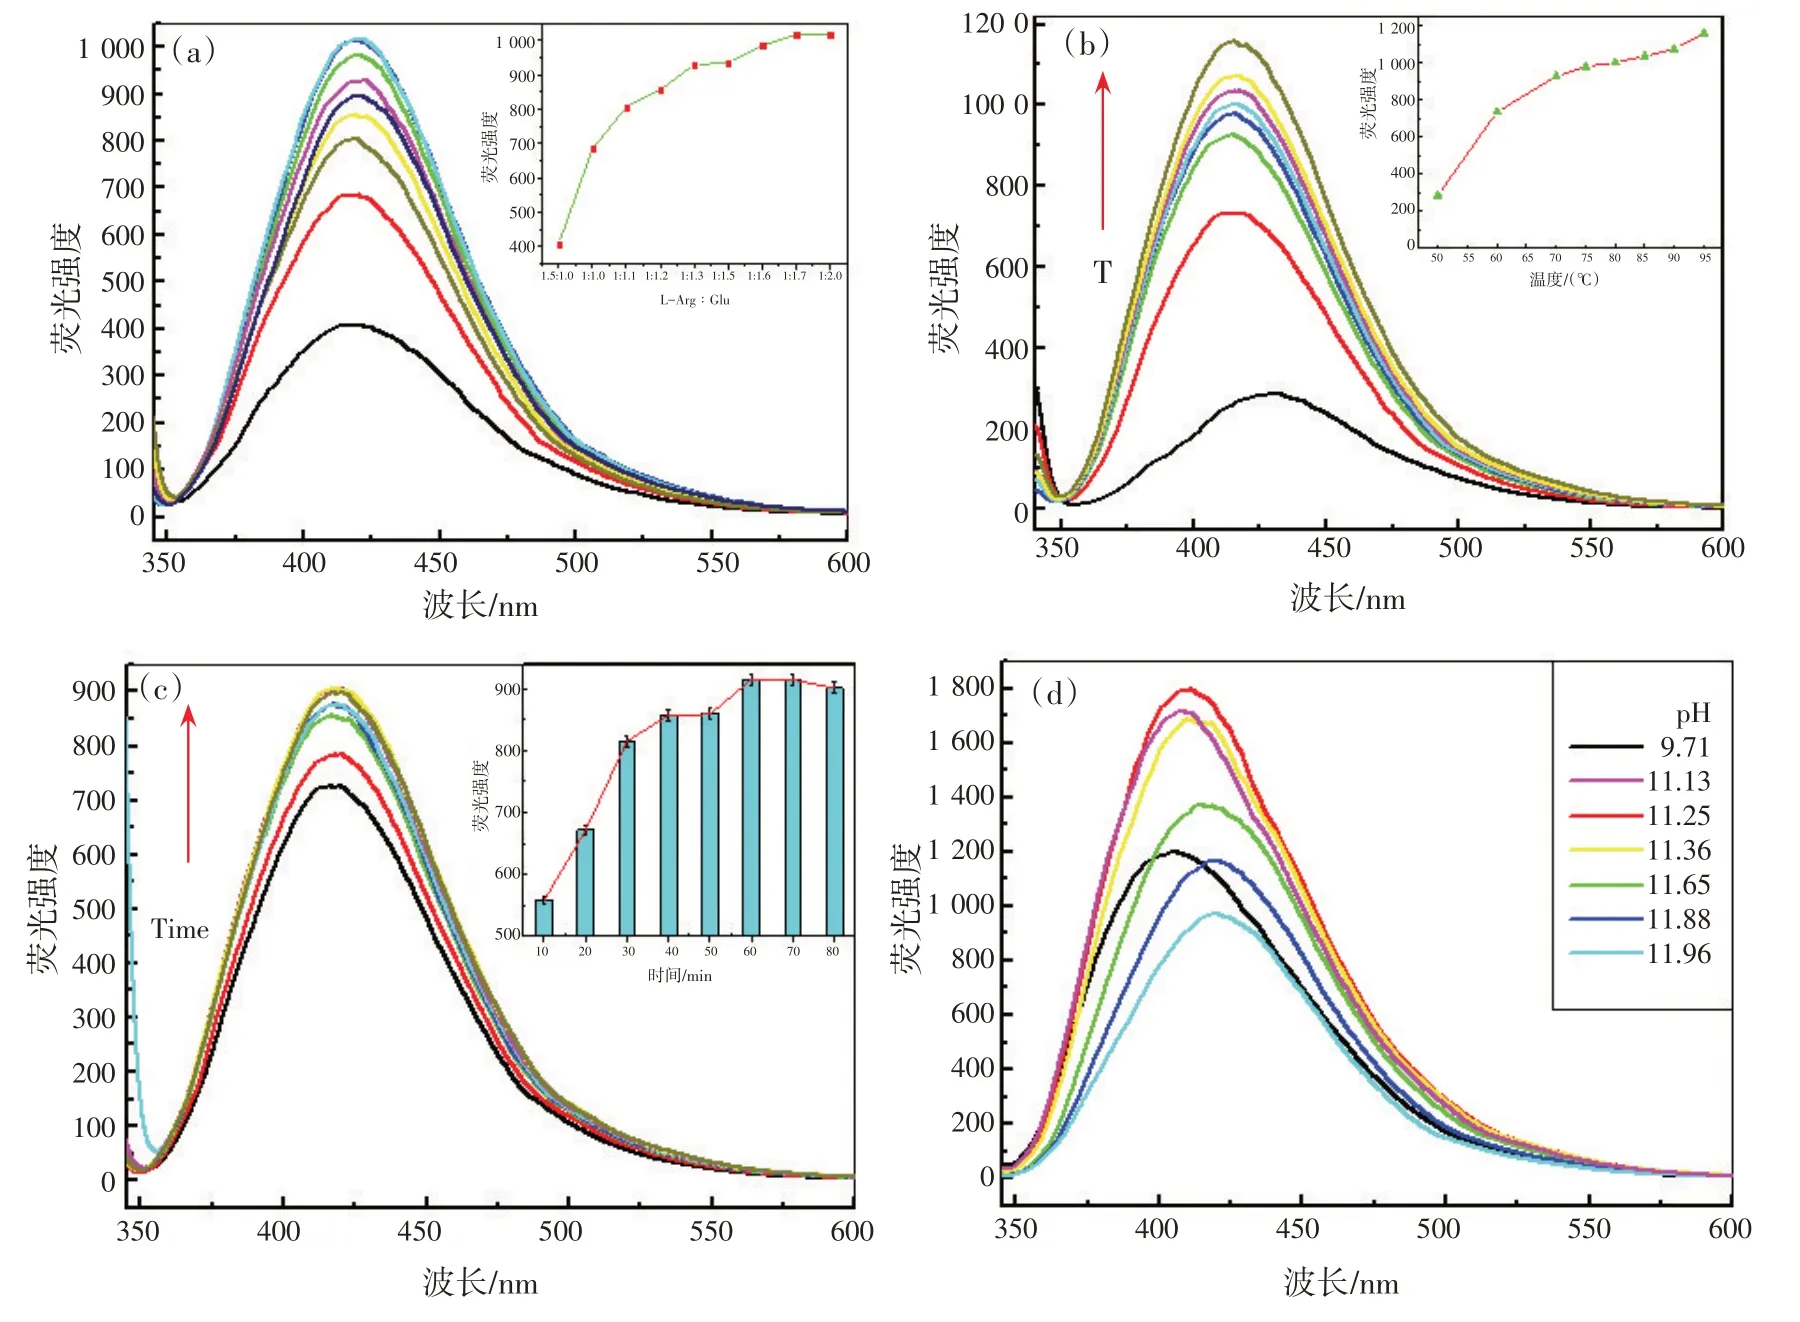
图5 GLA溶液制备的荧光优化条件:L-Arg/Glu比例(a),反应温度(b),反应时间(c), pH值(d)Fig.5 The fluorescence spectra optimization conditions of GLA solution preparation: concentration ratios of L-Arg /Glu(a),temperature(b), and reaction time(c), and pH values(d)
2.4.2 GLA-Cu2+检测平台分析APM的最佳条件
选择缓冲溶液是最主要也是最基本的步骤。本实验研究了pH 和浓度相同的6 种缓冲溶液(磷酸二氢钠-柠檬酸、PBS,Tris-HCl,HEPES,BR,NaH2PO4-Na2HPO4)对体系的影响。结果表明,HEPES 的用量很小且反应明显,说明HEPES 缓冲溶液比其他缓冲液好。如图6(a)所示,两种体系在pH 6.8~8.2条件下均稳定。此外,pH 7.4接近生理pH,表明此检测平台具有潜在的活体生物应用优势。因此,选择pH 为7.4 的HEPES 缓冲溶液作为最佳反应酸度条件。最后研究了缓冲容量的影响,实验结果表明选pH 7.4 的HEPES 缓冲液作为反应介质,取0.8 mL 为宜。本实验还讨论了反应时间对GLA-Cu2+-APM体系荧光强度的影响,如图6(b)所示,室温下,该体系反应很快,10 min即可完成。
2.5 检测传感平台的选择性
为研究检测传感平台的选择性,在相同的实验条件下,研究了GLA 在铈离子(Ce3+),铬离子(Cr3+),铁离子(Fe3+),铝离子(Al3+),铜离子(Cu2+),锌离子(Zn2+),钡离子(Ba2+),镍离子(Ni2+),镁离子(Mg2+),锰离子(Mn2+),钴离子(Co2+),钙离子(Ca2+),镉离子(Cd2+),铅离子(Pb2+),钯离子(Pd2+)15种常见金属离子存在下的荧光光谱。同时,在APM 存在的情况下,对含有上述所有金属离子的GLA进行了选择性实验。如图7 所示,有3种金属离子(Fe3+,Cu2+,Pd2+)在408 nm 处对GLA 有明显的响应。然而,只有在GLA-Cu2+体系中加入APM 后,才能最大程度恢复其猝灭荧光,因此,GLA-Cu2+作为检测传感平台分析APM是有效可靠的。
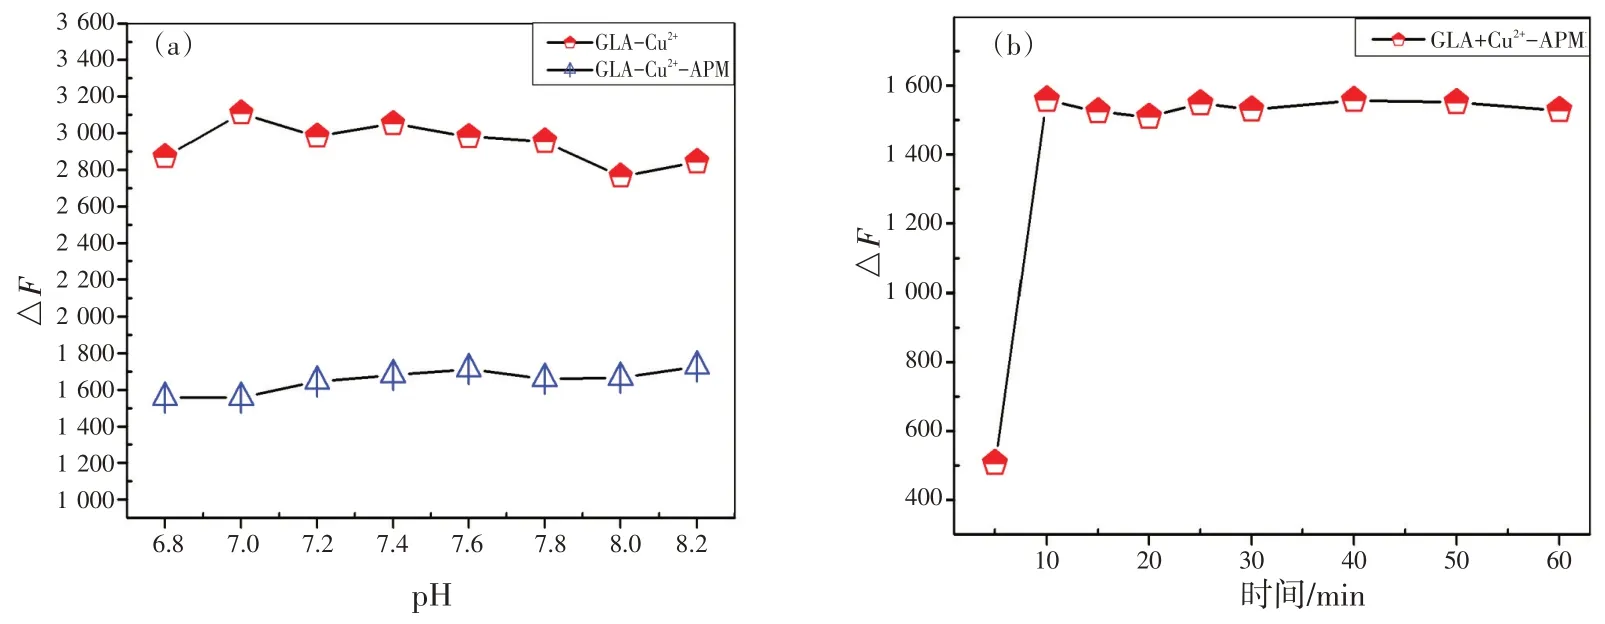
图6 缓冲溶液的pH分别对GLA-Cu2+和GLA-Cu2+-APM体系的影响(a);优化反应时间对GLA-Cu2+-APM体系的相对荧光强度的影响(b)(cGLA=1.0 mmol/L,c Cu2+=1.0 mmol/L,cAPM=1.0 mmol/L)Fig.6 (a) Effect of pH value of buffer solution on the fluorescence intensity of GLA-Cu2+ and GLA- Cu2+-APM system;(b) effect of optimization reaction time on the relative fluorescence intensity in GLA-Cu2+-APM system (cGLA=1.0 mmol/L,cCu2+=1.0 mmol/L, cAPM=1.0 mmol/L)
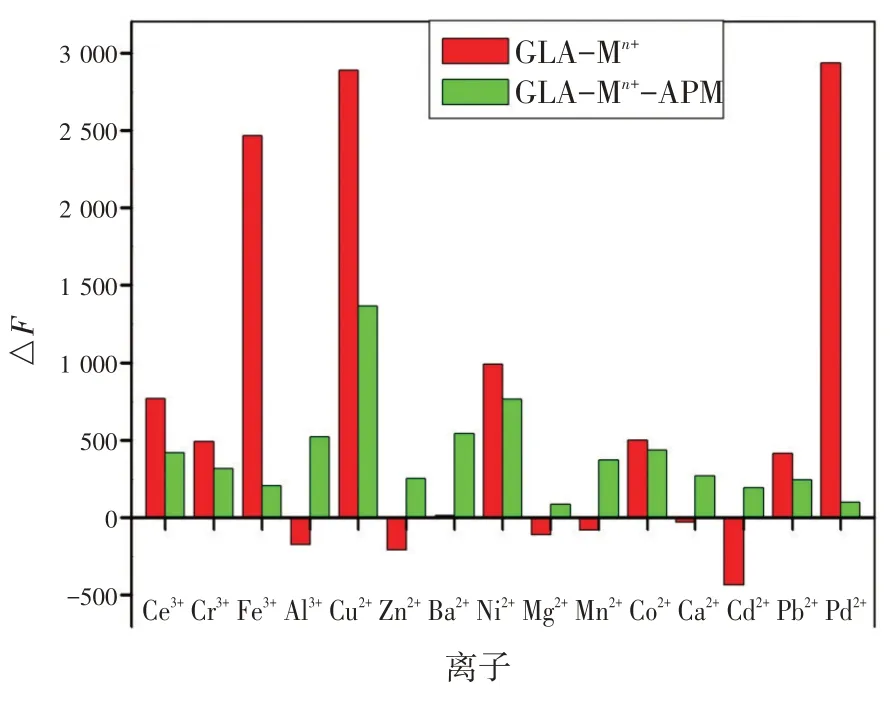
图7 0.5 mmol/L 的金属离子对GLA和GLA-APM的荧光相对强度的选择性影响Fig.7 The relative fluorescence intensities of GLA and GLAAPM in the presence of metal cations (Ce3+,Cr3+,Fe3+,Al3+,Cu2+,Zn2+,Ba2+,Ni2+,Mg2+,Mn2+,Co2+,Ca2+,Cd2+,Pb2+,Pd2+)with the concentrations of 0.5 mmol/L
2.6 共存物质的影响
实验研究了氨基酸、糖、金属离子等共存物质对分析测定APM 的影响,结果见表1。其中,Pd2+和Fe3+对实验结果有较大的干扰,但可以在样品预处理时通过添加EDTA消除干扰,其余的共存物质包括氨基酸、蛋白质、单糖、低聚糖、多糖以及其他金属离子和无机酸自由基对测定结果无干扰,因此,该平台有很强的选择性和抗干扰能力。
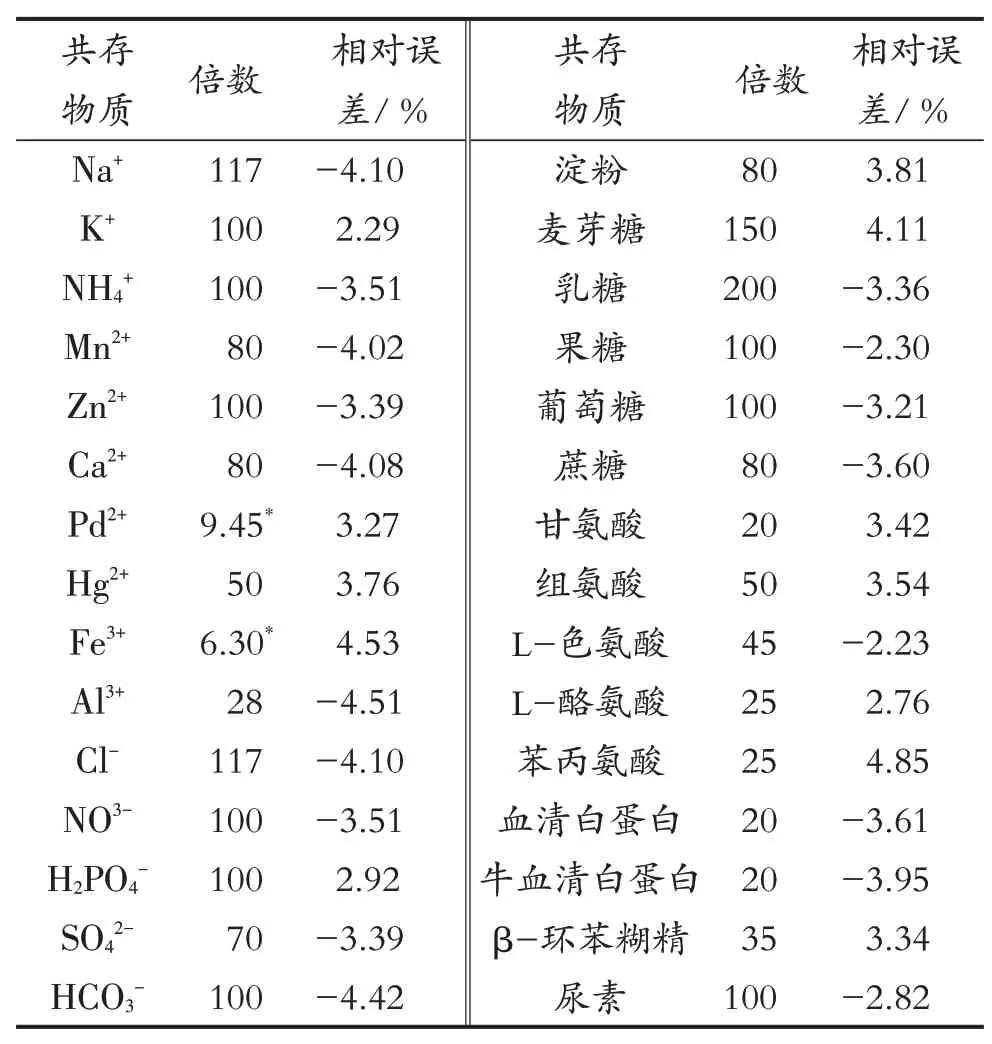
表1 共存物质对分析测定APM的影响(cAPM=10.0 mmol/L)Tab.1 Effects of coexistence substances on the analysis and determination of APM (cAPM=10.0 mmol/L)
2.7 体系的反应机制
研究涉及化合物结构和光谱信号的关系,对该传感器的机制进行了探讨和推测。通过FT-IR研究了GLA,Glu和L-Arg的结构,如图8(a)所示,在GLA 的红外光谱中,1 612 cm-1处的峰为C—N键,因为Glu 的羰基基团与L-Arg 的氨基发生反应。1 406 cm-1和1 344 cm-1左右的峰表明存在羰基和羟基。如图3 中曲线(b)所示,在最优条件下,随着Cu2+的加入,GLA 的荧光强度显著淬灭,颜色也逐渐变为淡绿色。但在图4中,将Cu2+加入GLA 溶液中时,RRS 强度显著增强,且在328 nm处出现新的RRS 特征峰。荧光强度的降低而RRS强度的增强可能是由于GLA-Cu2+复合物的形成,因此,荧光和RRS 光谱的变化可能是Cu2+与GLA中的羰基基团和羟基配位的结果[19-20]。为进一步验证,研究了GLA-Cu2+体系的傅里叶红外光谱(FT-IR)。如图8(b)所示,由于Cu2+与GLA发生反应,GLA在1 406 cm-1和1 344 cm-1处的原峰消失,在1 383 cm-1处出现新峰。
然而,当将APM 加入上述体系后,荧光强度随即恢复,发出颜色较浅的光,得到改善[图3 中曲线(c)]。荧光强度的恢复可能是由于APM 与Cu2+之间的结合作用,其结合力甚至强于Cu2+与GLA 之间的结合力[1]。另一方面,在GLA- Cu2+体系中加入APM 后,RRS 强度降低,如图4 所示。众所周知,RRS 的光谱特征和散射强度受分子大小、形状、构象和界面性质的强烈影响,这为研究生物分子间的相互作用提供了有利的新信息[21-22]。因此,RRS 强度的增加可能是加入Cu2+时,GLA- Cu2+的分子体积增大所致。尽管如此,因为APM 的体积小于GLA,当APM 在溶液中取代GLA 时,新的金属络合物APM- Cu2+的尺寸减小,体系的RRS强度最终减弱。
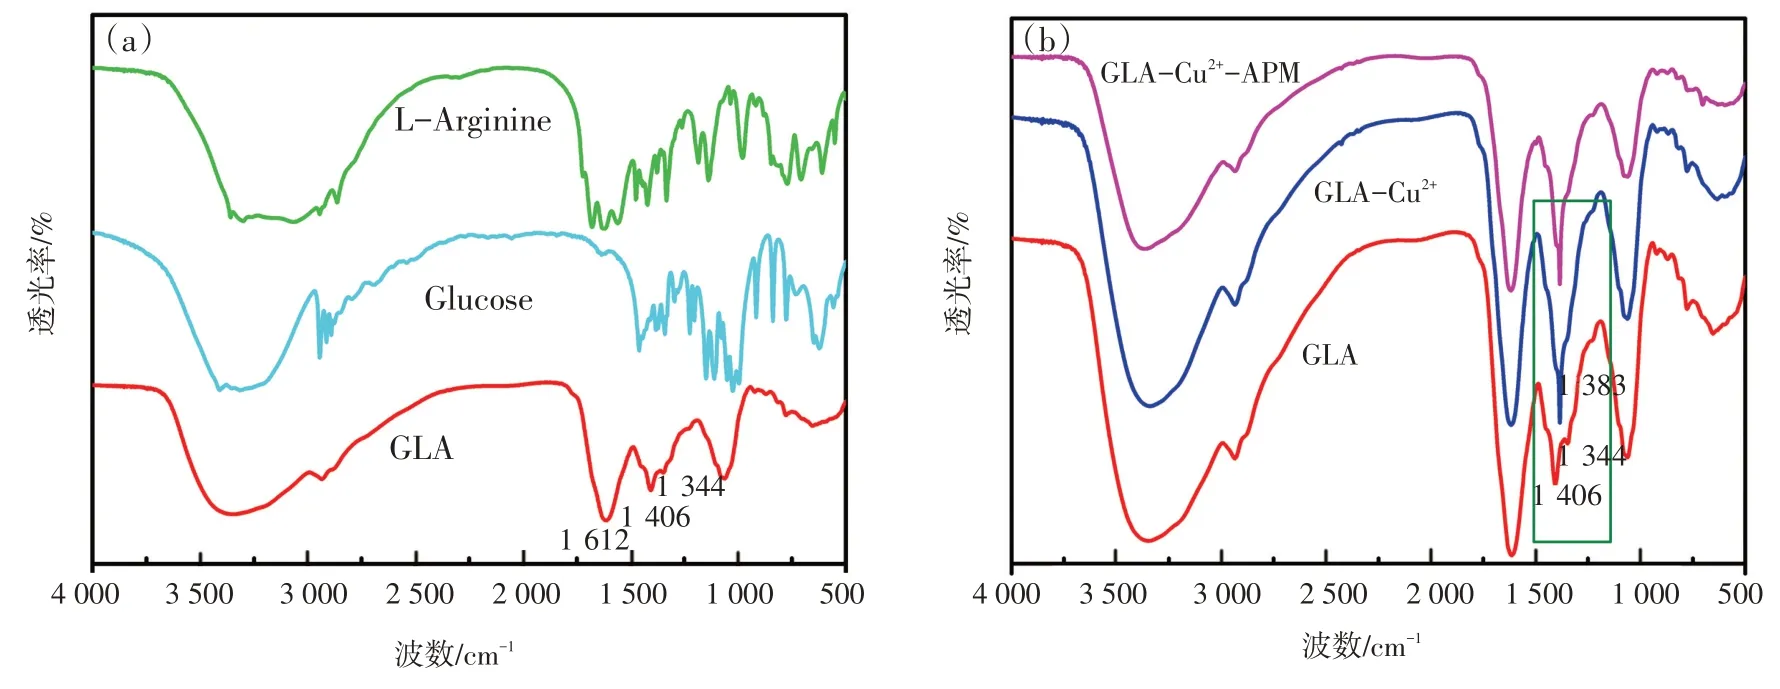
图8 单独的GLA, Glu ,L-Arg的傅里叶红外光谱(a)以及体系GLA- Cu2+和GLA- Cu2+-APM的傅里叶红外光谱(b)Fig.8 The Fourier transform infrared(FT-IR)spectrum of(a)single GLA,Glu,L-Arg and(b)the systems of GLA-Cu2+,GLA-Cu2+-APM
GLA在没有和有Cu2+存在时的紫外可见吸收光谱如图9 所示,根据UV-vis 吸收光谱可知,GLA在295 nm 处有一个吸收峰,但加入Cu2+后,在755 nm 处出现新的吸收峰且GLA 的初始吸收峰消失,说明GLA与Cu2+发生了反应,形成了新的复合物。但加入APM 后,由于GLA 与Cu2+的结合力较弱,APM与Cu2+的结合力相对较强,吸收峰发生蓝移,特征峰重新出现在655 nm处。因此,GLA-Cu2+体系的荧光恢复也是Cu2+与APM 相互作用的结果。APM中含有羧基和氨基,可以通过螯合作用与Cu2+发生反应,因此,其荧光恢复和RRS 降低可能是GLA与APM对Cu2+的竞争性置换所致。
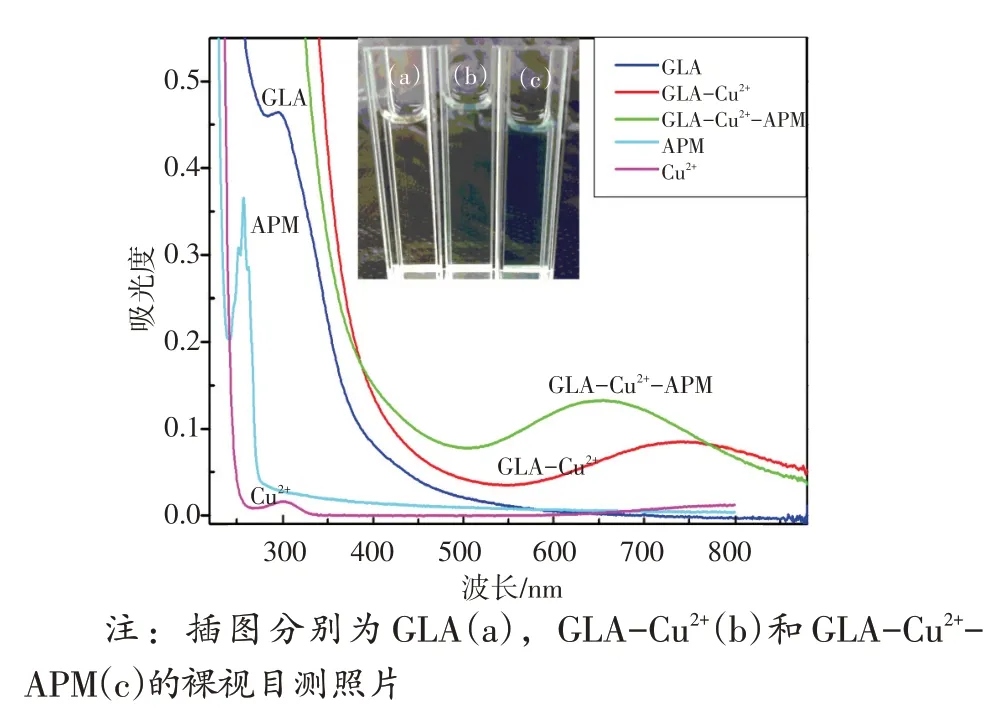
图9 GLA,GLA-Cu2+,GLA-Cu2+-APM以及Cu2+和APM的UV-Vis吸收光谱Fig.9 UV-Vis absorption spectra of GLA, GLA-Cu2+, GLACu2+-APM, APM, Cu2+
2.8 标准曲线
在最优条件下,不同浓度APM 的GLA-Cu2+体系的荧光光谱如图10 所示。根据结果分析,相对荧光恢复强度△F=F1-F0(F0,F1分别为GLA-Cu2+体系中没有和有APM 时的荧光强度)与浓度在0.3~300 μmol/L 范围的APM 呈线性关系,如图10中插图所示。基于3σ/S的标准偏差(其中σ为测定空白样品11 次的标准偏差,S为校准斜率),检出限为26 nmol/L,相关系数为0.999 5。线性回归方程为ΔF=56.69c+35.93(c为APM的浓度)。
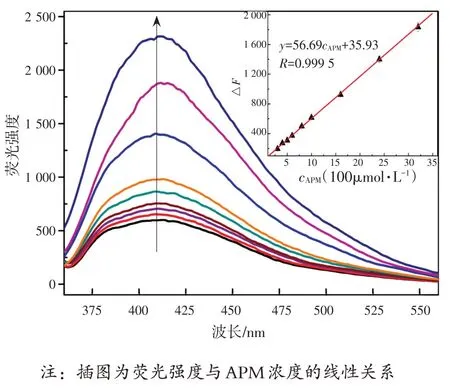
图10 不同浓度APM的GLA-Cu2+(cGLA=1.0 mmol/L,c Cu2+=0.5 mmol/L)体系的荧光光谱图Fig.10 Fluorescence sprectra of GLA-Cu2+ (cGLA=1.0 mmol/L,cCu2+=0.5 mmol/L)system with different concentrations of APM
图11 讨论不同浓度APM 的GLA-Cu2+体系的RRS 光谱。与荧光变化相比,随着APM 浓度的增加,GLA-Cu2+体系在328 nm 处的RRS 强度逐渐降低。APM 浓度在0.4~800 μmol/L 范围时,RRS 强度(IRRS)与APM浓度呈线性关系,检出限为39 nmol/L。线性回归方程为IRRS=-0.942c+7.941(其中c为APM浓度),相关系数为0.999 3。
3 本法对水样中APM的实际分析
为验证本方法的可靠性和实用性,进行了实际水样中APM 检测的标准回收试验。自来水样品中未检出APM,为净化处理水样,样品都用滤纸过滤。在测试中,每个样本被测试5 次取平均值。如表2 所示,APM 回收率在97.80%~101.67%之间波动,相对标准偏差小于3%。结果表明,该方法对自来水样品中APM 的检测可靠并具有较高的准确性。
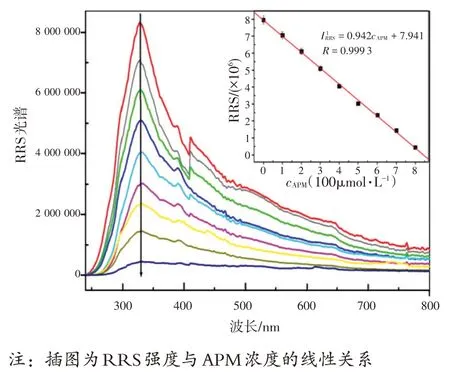
图11 不同浓度APM的GLA-Cu2+(cGLA=0.1 mmol/L,c Cu2+=0.5 mmol/L)体系的RRS光谱图Fig.11 The RRS spectra of of GLA-Cu2+ (cGLA=0.1 mmol/L,cCu2+=0.5 mmol/L)system with different concentrations of APM

表2 自来水样中APM检测的回收实验Tab.2 Recovery test of APM in tap water samples
4 结论
综上所述,利用Glu 和L-Arg 的美拉德反应合成了具有良好的光学活性和水溶性的GLA,并研究了GLA 的初始光学性质。GLA 是发蓝色荧光的产物与Cu2+螯合而成的复合物,加入APM 后对GLA-Cu2+的荧光具有“关-开”响应模式和对RRS的荧光具有“开-关”响应模式,为此可作为FL和RRS 法检测APM 的传感平台。结果表明,这种新型的快速检测APM 的传感平台是有效可靠的。因此,可以建立FL法和RRS法对痕量APM进行快速灵敏的检测。将该GLA-Cu2+传感平台应用于实际水样中APM的检测,取得了满意的效果。推测GLA-Cu2+可以通过美拉德反应作为低成本、光学性能优异的传感平台,扩展用于各种其他手性物质的检测。
Aspartame (APM) is a synthetic organic amino acid derivative[1].It is widely used as a kind of food additive with low-energy artificial and non-carbohydrates sweetener[2].Recently, APM is even mixed with other kinds of additives like preservatives, antioxidants to produce synergistic effects in food or cosmetics[3].However, APM rapidly degrades into environmental contaminants at low pH and high temperatures.In vivo, APM can be metabolized in the gastrointestinal tract into three components: phenylalanine,aspartic acid and methanol[4].Furthermore, the excessive use of aspartame may lead to a number of health problems including neurological disturbances, loss of hearing, memory diseases, and even cancer[5-7].Thus,the analysis of APM is still challenging and practical.
Maillard reaction, known as nonenzymatic browning reaction[8], involves the condensation between the carbonyl compound (reducing sugars) and amino compounds (amino acids and proteins)[10]and forms a complex mixture of the macromolecular compounds and their associated mixtures.Maillard reaction is mostly used in the food industry and essence fields[11].
Recent studies have indicated that fluorescencebased assay has attracted considerable attention inmany environmental and biological processes due to its sensitivity, selectivity, simplicity and nondestructive imaging properties[12-15].Additionally, Resonance Rayleigh scattering (RRS), a novel sensitive analytical technique with convenient performance, has been applied to many fields including biological macromolecules, pharmaceuticals and environment[17-18].In the past, some fluorescent and RRS probes or sensor had been reported[19-20], but the sensing platform that could be simultaneously used for fluorescence and resonance Rayleigh scattering is very few.Especially,the detection of APM based on the fluorescence and RRS changes have never been reported.
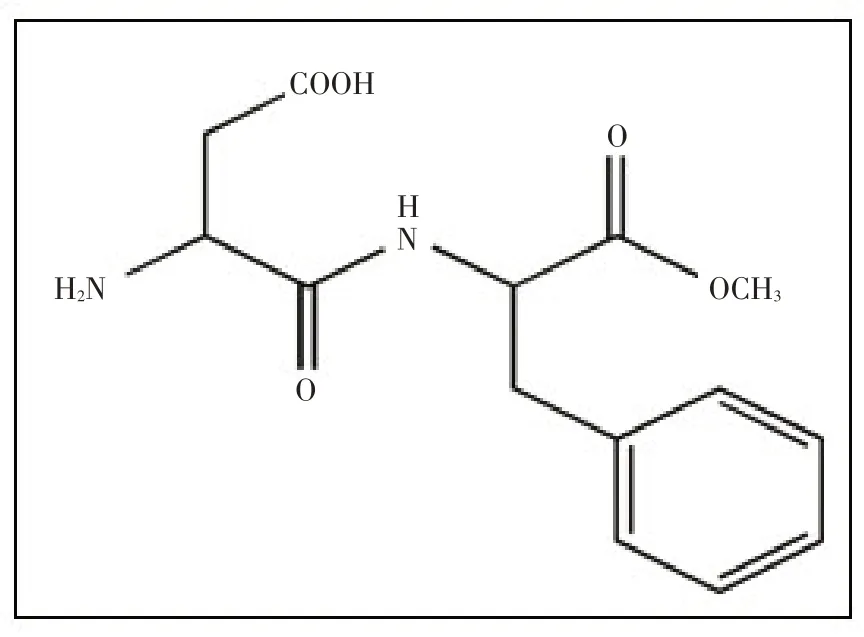
Fig.1 The structure of APM (L-aspartyl-L-phenylalanine methyl ester)
In this work, we used GLA-Cu2+as fluorescence and RRS sensing platform to determine APM owing to the chelating ability of GLA toward Cu2+.When introducing APM into the system, the fluorescence was quenched then restored to form the turn-off-on switch, while the RRS was able to be enhanced then reduced in a turn-on-off mode.T extents of both FL recovery and RRS reduction were linearly related to the concentration of APM in a wide range.Therefore, the detection of APM could be easily achieved through the linear relationship in an effective and reliable way.Thus, this paper proposes a sensing platform of GLA-Cu2+for APM detection, which shows excellent optical performance with high sensitivity and selectivity.The design and synthesis of the sensing platform would be beneficial for real-time analysis of environmental and biological problems.
1 Experimentation
1.1 Apparatus
A Hitachi F-4500 fluoro-spectrophotometer (Hitachi Company, Japan) with slits (EX/EM) of 10.0/10.0 nm was used to record the fluorescence spectra.A FS5 near infrared spectrofluorometer (Edinburgh Instruments Ltd, UK) with slits (EX/EM) of 5.0/5.0 nm was used to record resonance Rayleigh scattering spectra.A UV-2700 220V CH spectrophotometer(Shimadza Corporation, Kyoto, Japan)was applied to record the absorption spectra.A pHS-3C-02 meter(Shanghai San-Xin Instrumentation, Shanghai, China)was used to adjust the pH values of the aqueous solutions.All measures were carried out under the normal environmental condition.
1.2 Reagents
All chemicals and reagents of analytic grade were purchased without no additional purification.The doubly distilled water was used throughout the experiments.The main chemical reagents (and their sources) were: D-Glucose (C6H12O6·H2O, Xilong Chemical Co., Guangzhou, China), L-Arginine (C6H14N4O2,Aladdin Industrial Co., Shanghai, China), Copper(II)nitrate trihydrate (Cu(NO3)2·3H2O, Sinopharm Chemical Reagent Co., Shanghai, China), Sodium hydroxide(NaOH, Xilong Chemical Co., Sichuan, China), Aspartame (C14H18N2O5, Aladdin Industrial Co., Shanghai,China), and 2-[4-(2-Hydroxyethyl)-1- piperazine]ethane sulfonic acid HEPES (C8H18N2O4S, Lark technology Co., Beijing, China).
A stock solution of 0.01 mol/L Cu2+and a stock solution of 0.01 mol/L APM were prepared, and the HEPES buffer solutions with different pH values were prepared by mixing 0.2 mol/L NaOH with 0.4 mol/L HEPES stock solution in different proportions, and calibrated by pH meter.
1.3 Preparation of water-soluble GLA with optical activity
The Maillard reaction products were synthesized as follows: all glasswares and magnetic stirrer bars were thoroughly cleaned in aqua regia (HNO3/HCl=1:3,V/V), rinsed thoroughly in water, and then overdried prior to use.Firstly, glucose (Glu, 0.168 4 g)and L-Arginine powders (L-Arg, 0.087 2 g) were added to a three-necked flask filled with 9.5 mL ultra pure water under stirring for 1 min.Then 0.5 mL of 1 mol/L NaOH was added to the above solution(pH 11.25) and stirred for another 1 min to form a homogeneous solution.Subsequently, the mixtures were heated at 95 ℃with stirring for 1 h.The final solution was filtered before used as active substances of the sensing platform.The as-prepared active solution with concentration of 0.05 mol/L, labeled as“GLA”,was finally stored in the refrigerator (0~4 ℃) for the future reaction.
1.4 Fluorescence and Resonance Rayleigh scattering (RRS) assays
Firstly, the GLA solution was diluted 10 times for the entire fluorescence and RRS assays.0.8 mL of HEPES buffer solution (pH=7.4), and 0.2 mL freshly diluted GLA solution were added into 10 mL calibrated test tube in succession.Therewith, 1.0 mL 0.01 mol/L Cu2+solution and a series of APM solution at different concentrations were added into the mixture solution.Then the above solution was diluted, mixed and incubated for 10 min.The fluorescence spectra of the solutions were collected at the emission wavelengthλemfrom 300 nm to 600 nm by setting excitation wavelengthλexat 334 nm.The emission signals were collected for each addition, and the relative intensity of fluorescence recovery was recorded, i.e.ΔF=F1-F0, whereF0andF1were the fluorescence intensity of GLA-Cu2+system in the absence or presence of APM, respectively.The RRS spectra of the system were recorded using synchronous scanning atλex=λem.The scattering intensities,IRRSfor the reaction product andI0RRSfor the reagent blank, were measured at their maximum wavelengths:ΔIRRS=IRRS-I0RRS.
2 Results and discussion
2.1 The spectral characteristics of GLA
In order to further investigate the optical properties and ligand chemical structure of the synthesized GLA, the UV-vis absorption spectrum and fluorescence spectrum of GLA were recorded and shown in Fig.2 (a).The characteristic absorption peak of the prepared GLA was located at 295 nm.The fluorescence spectrum of GLA showed an emission peak at 408 nm under the excitation wavelength of 334 nm,so the stokes shift between the excitation and emission wavelengths of maximum fluorescence intensities of GLA was 74 nm which allows to eliminate the background interference.At the same time, we also compared the fluorescence spectrum before and after the Maillard reaction, as shown in Fig.2 (b).The results demonstrated that the emitting fluorescence of the reactants of Maillard reaction (Glu and L-Arg)was rather weak compared to the products labeld as GLA under the same test addition, indicating the bright blue fluorescence mainly from GLA.
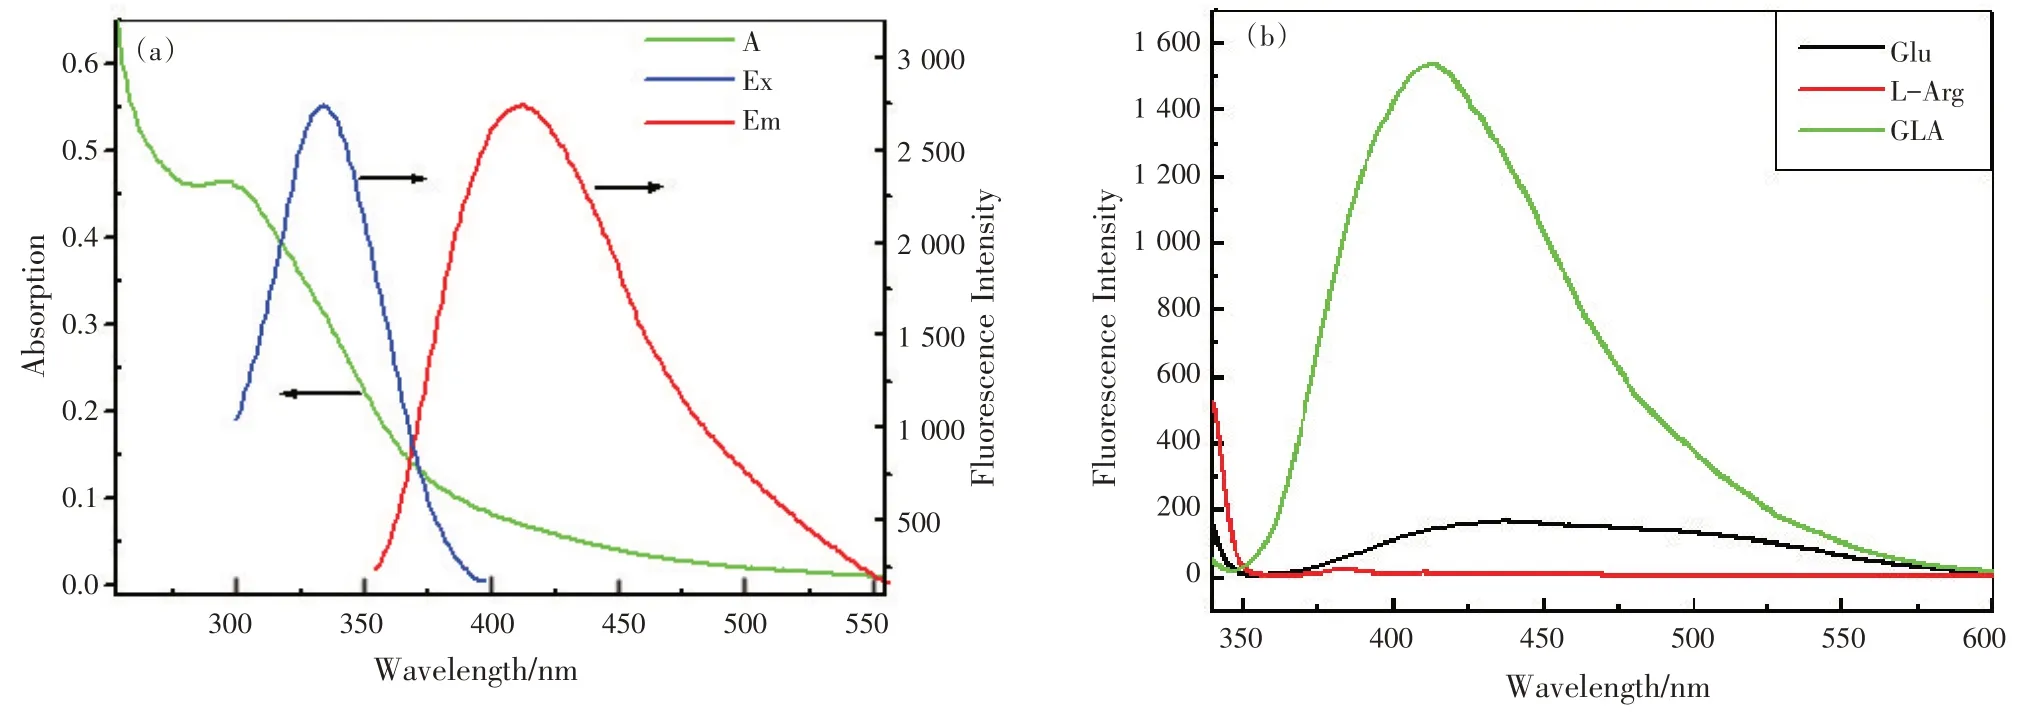
Fig.2 (a)The UV-Vis absorption and fluorescence spectra of GLA; (b)Comparison of fluorescence spectra of Glu, L-Arg and GLA (cL-Arg∶cGlu =1∶2, cGLA=1.0 mmol/L)
2.2 Turn-off-on response of fluorescence for APM detection
The prepared GLA product is water-soluble and has highlight blue-emitting efficiency.Fig.3 showed the maximum fluorescence emission wavelength of GLA at 408 nm.The fluorescence intensity of GLA was greatly quenched in the presence of Cu2+with the blue fluorescence fading into colorless.However, assoon as APM was added into the system, the fluorescence intensity could be recovered in a linear fashion with the added APM concentration, and the blueemitting light appeared again nearly instantly.So,GLA-Cu2+could act as an effective sensing platform of turn-on fluorescence for the determination of APM.
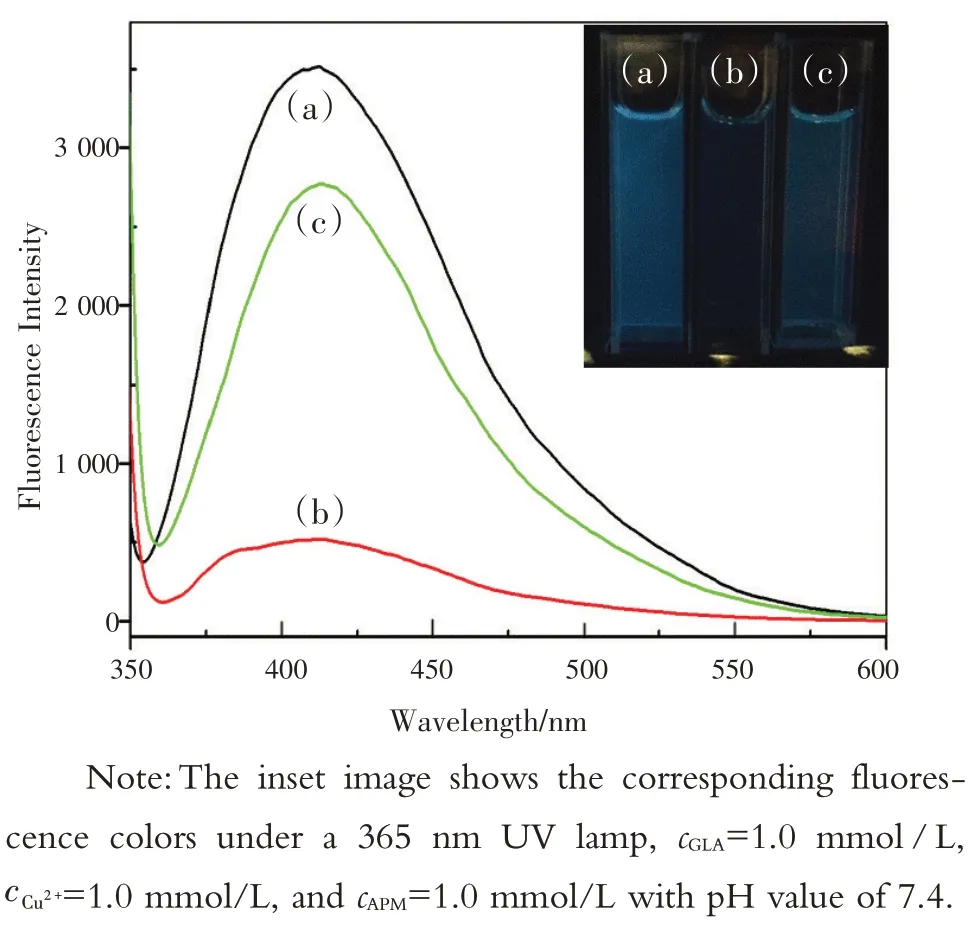
Fig.3 The fluorescence spectra of GLA (a), GLA-Cu2+ (b),and GLA- Cu2+ -APM (c)
2.3 “Turn-on-off”response of RRS for APM detection
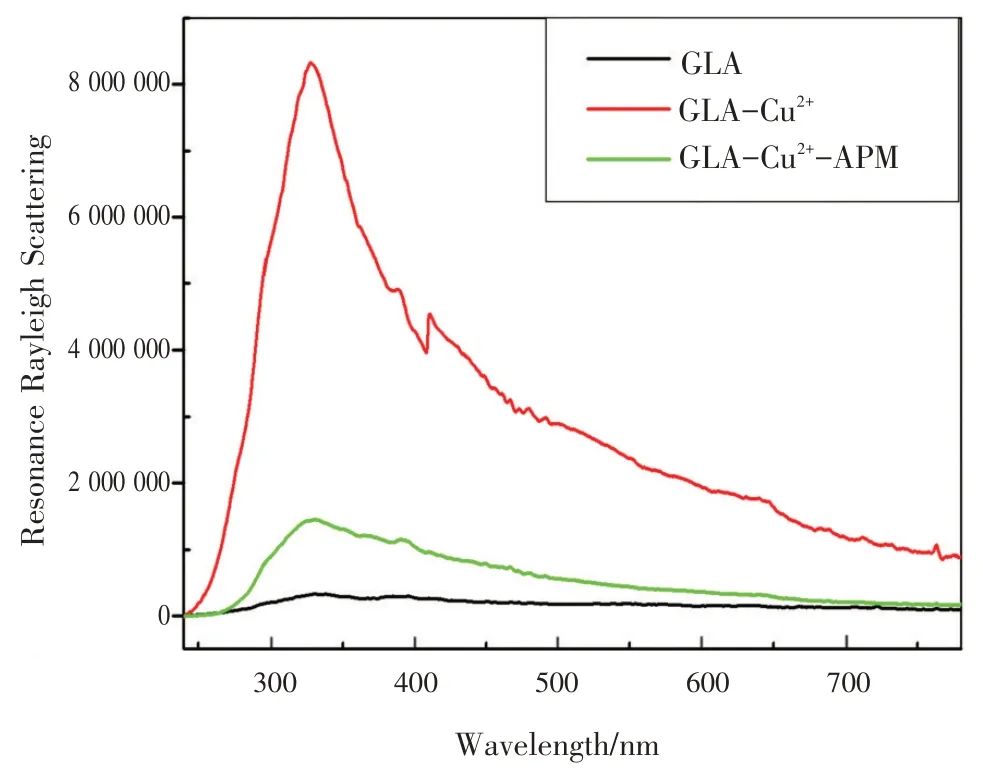
Fig.4 TheRRSspectraofGLA,GLA-Cu2+,andGLA-Cu2+-APM
In order to further investigate the interaction between GLA-Cu2+and APM, the RRS spectra in the GLA-Cu2+-APM system were recorded.As shown in Fig.4 , the RRS intensities of GLA was very low without no any obvious characteristic peak.After Cu2+was added to GLA solution, a new characteristic RRS peak appeared at 328 nm.Nevertheless, the RRS intensity could linearly decrease with the addition of APM.Therefore,based on the linear intensity change of RRS,an effective RRS sensing platform was developed from the combination of Cu2+-GLA to determine APM.
2.4 Optimum conditions for the reactions
2.4.1 The optimal synthesis condition of GLA
To achieve the highest fluorescence intensity of GLA, a series of synthesis conditions were investigated.Firstly, the effect of two reaction precursors on the fluorescence intensity was investigated via changing the amount of Glu while fixing the amount of L-Arg.The best mixing ratio was found to be 1∶2 [Fig.5 (a)]and selected to prepare GLA for the sensing platform.Secondly, temperature plays an important role in the reaction rate of Maillard reaction [Fig.5 (b)], and 95 ℃was selected as synthesis temperature.Thirdly, the synthesis time was investigated [Fig.5 (c)], and fiund that GLA product could be synthesized for 1 h.Finally,the effect of pH values of the mixture on the fluorescence intensity has been studied.Fig.5 (d) illustrated that the fluorescence intensity reached to a maximum at pH 11.25, which was selected as the optimum pH value for Maillard reaction.
2.4.2 The optimum conditions of GLA-Cu2+sensing platform for the determination of APM
It is the most fundamental and essential step to select buffer solution.In this work, the influence of six buffer solutions (NaH2PO4-citric acid, PBS, Tris-HCl, HEPES, BR, and NaH2PO4-Na2HPO4) on the system was investigated at the same pH value and concentration.The effect of HEPES was obvious even for a small amount of it, indicating that the HEPES buffer solution was better than the others.The influence of different pH values was also investigated[Fig.6 (a) ], and the two systems were found to be stable at pH values of 6.8~8.2.The pH range covers the physiological pH of 7.4, and suggests a potential advantage for this sensing platform to be applied to living body.Therefore, The HEPES buffer solution of pH 7.4 was chosen as the optimal reaction aciditycondition.Subsequently, the effect of buffer volume was also studied, and the appropriate amount was chosen as 0.8 mL.
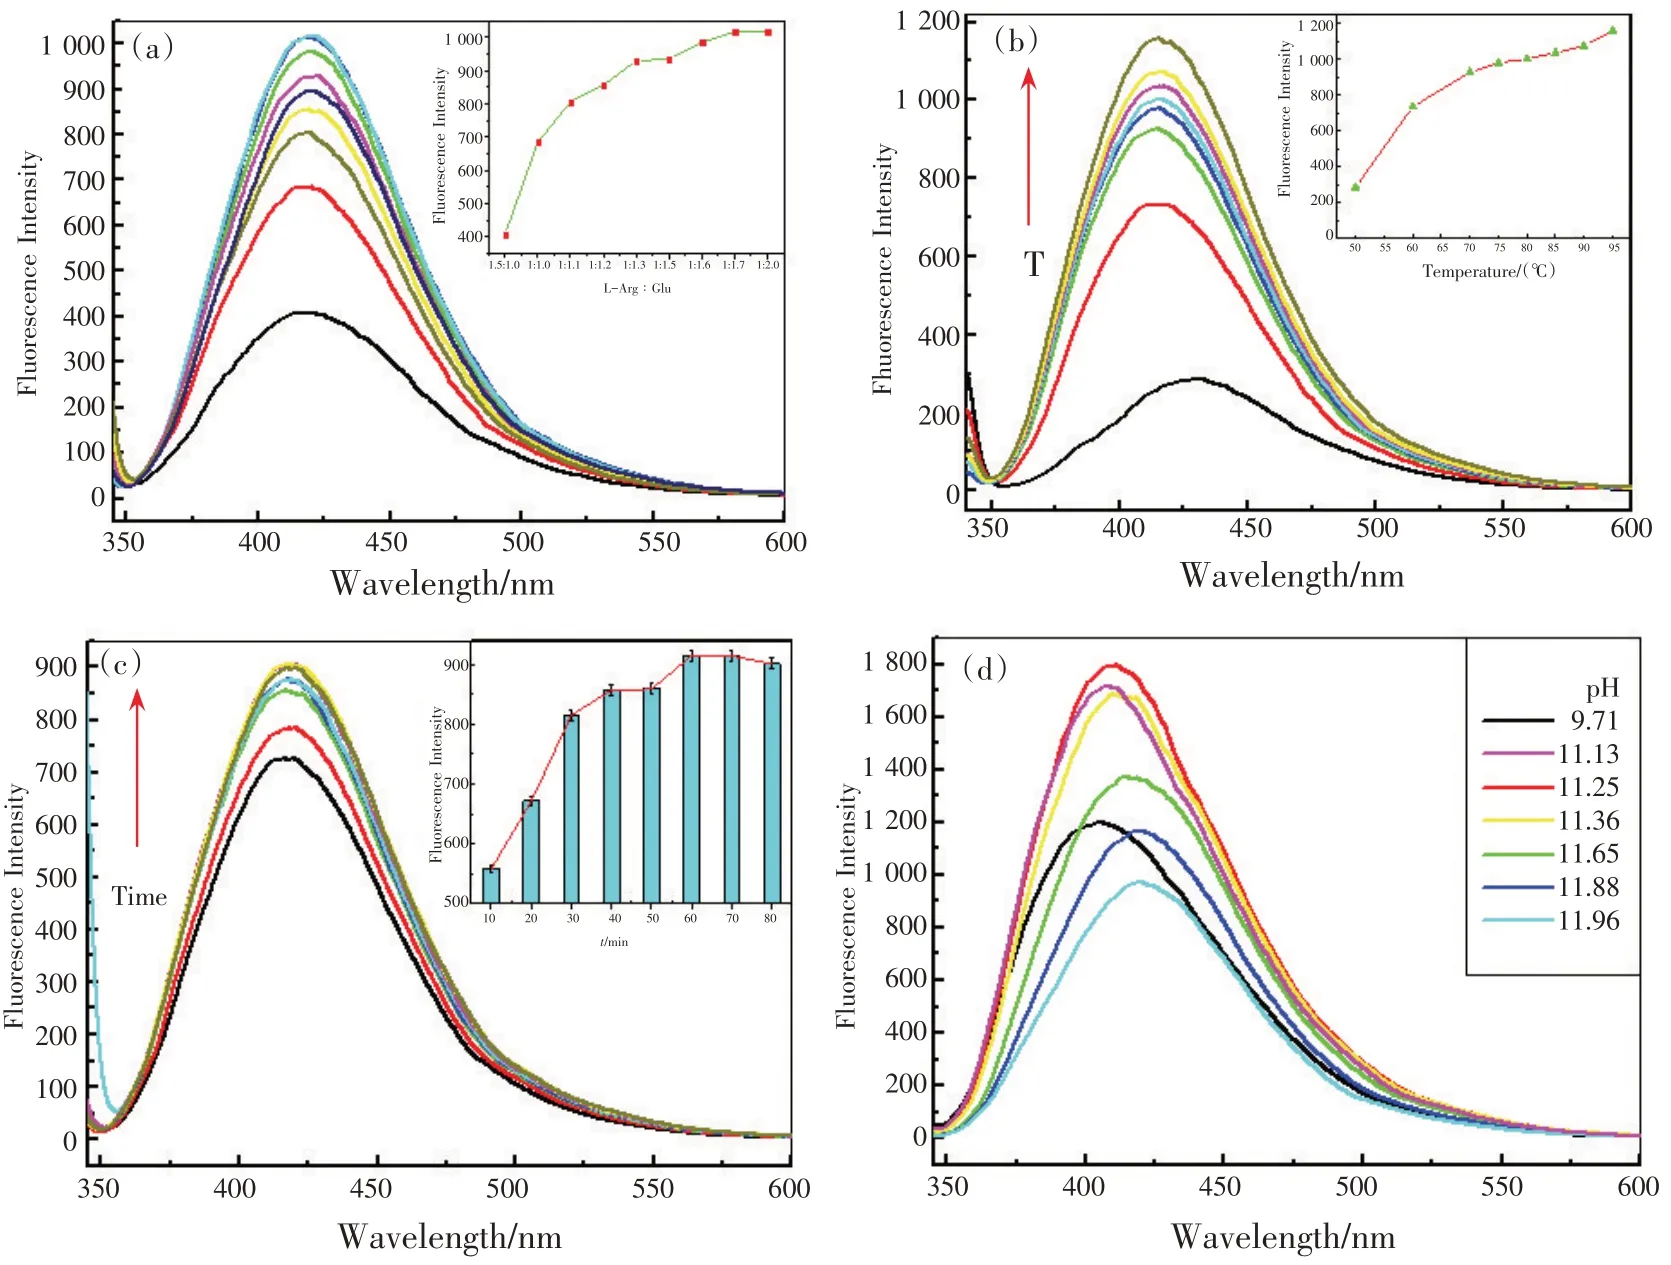
Fig.5 The fluorescence spectra optimization conditions of GLA solution preparation: concentration ratios of L-Arg /Glu(a),temperature(b), and reaction time(c), and pH values(d)
The influence of reaction time on the fluorescence intensity of GLA-Cu2+-APM system has been discussed [Fig.6 (b) ].The results demonstrated that the reaction was very quick and could be accomplished in 10 min at room temperature.
2.5 Selectivity test of the sensing platform
To investigate the selectivity of the sensing platform, the fluorescence spectrum of GLA was studied under the same experimental conditions in the pres-ence of 15 kinds of common metal ions, such as Ce3+, Cr3+, Fe3+, Al3+, Cu2+, Zn2+, Ba2+, Ni2+, Mg2+, Mn2+,Co2+, Ca2+, Cd2+, Pb2+, Pd2+.Meanwhile, the selectivity experiments were also carried out for GLA containing all above metal ions and in the presence of APM.As shown in Fig.7 , three kinds of metal ions (Fe3+, Cu2+,Pd2+) could obviously respond to GLA at 408 nm.However, only the GLA-Cu2+system could mostly recover its quenched fluorescence after the addition of APM.Thus, GLA-Cu2+system, working as a sensing platform for the determination of APM, was effective and reliable.
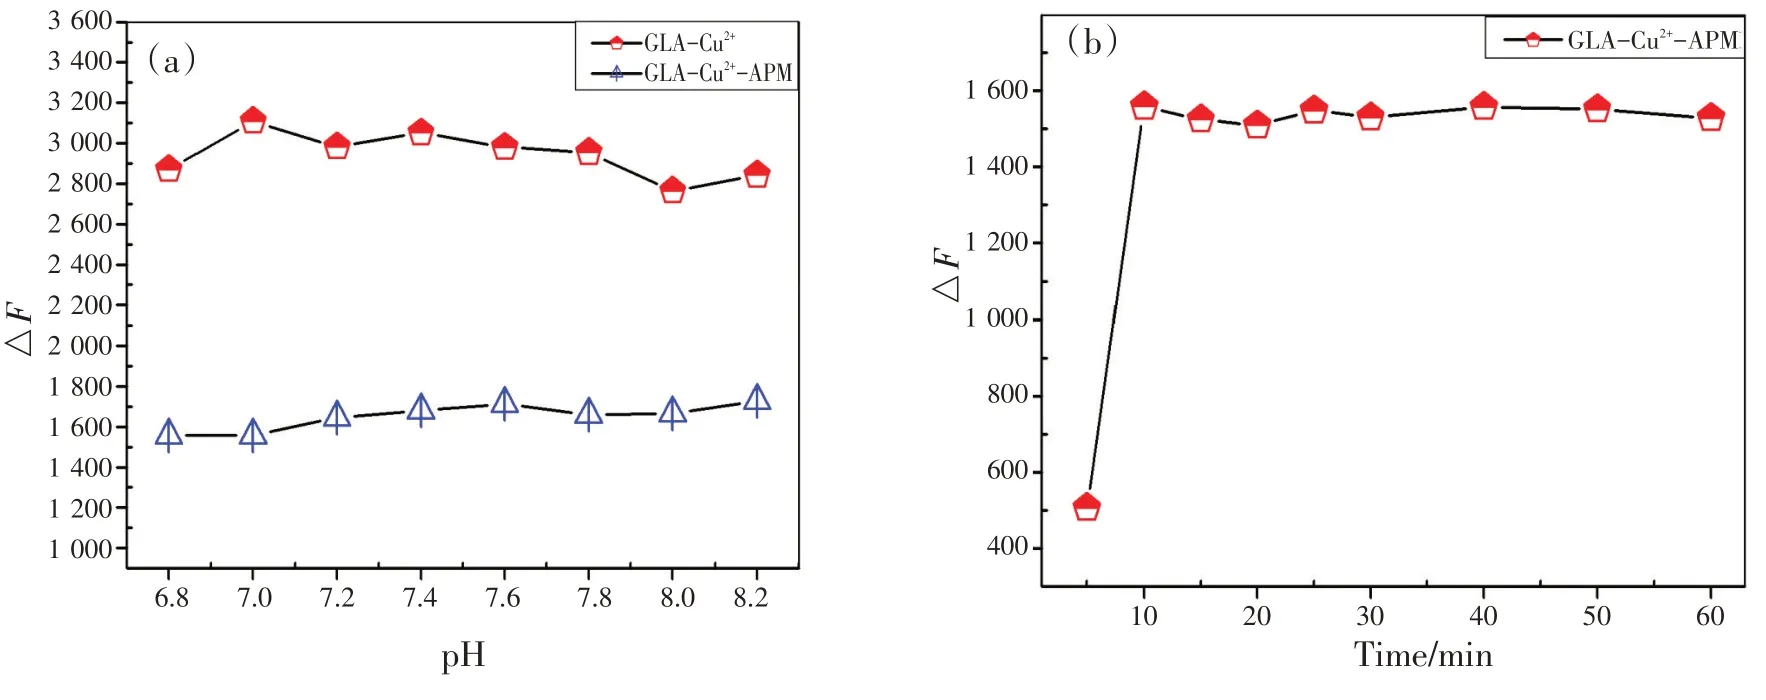
Fig.6 (a) Effect of pH value of buffer solution on the fluorescence intensity of GLA-Cu2+ and GLA- Cu2+-APM system;(b) effect of optimization reaction time on the relative fluorescence intensity in GLA-Cu2+-APM system (cGLA=1.0 mmol/L,cCu2+=1.0 mmol/L, cAPM=1.0 mmol/L)
2.6 The effect of coexisting substances
The effects of the coexistence with substances such as amino acids, sugars, and metal ions on the determination of APM were investigated here.All the results were listed in Tab.1 .Of all the analysis, Pd2+and Fe3+had larger disturbance on the results but could be easily removed by adding EDTA in sample pretreatment.The rest of coexisting substances had no interference for the determination purpose, including amino acids, proteins, simple sugars, oligosaccharides, polysaccharides, as well as other metal ions and inorganic acid radicals.So the platform has strong selectivity and anti-interference ability.
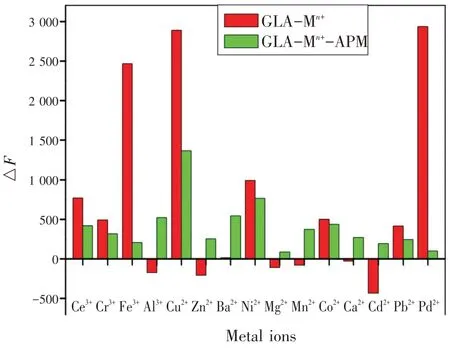
Fig.7 The relative fluorescence intensities of GLA and GLA-APM in the presence of metal cations (Ce3+,Cr3+,Fe3+,Al3+,Cu2+,Zn2+,Ba2+,Ni2+,Mg2+,Mn2+,Co2+,Ca2+,Cd2+,Pb2+,Pd2+) with the concentrations of 0.5 mmol/L
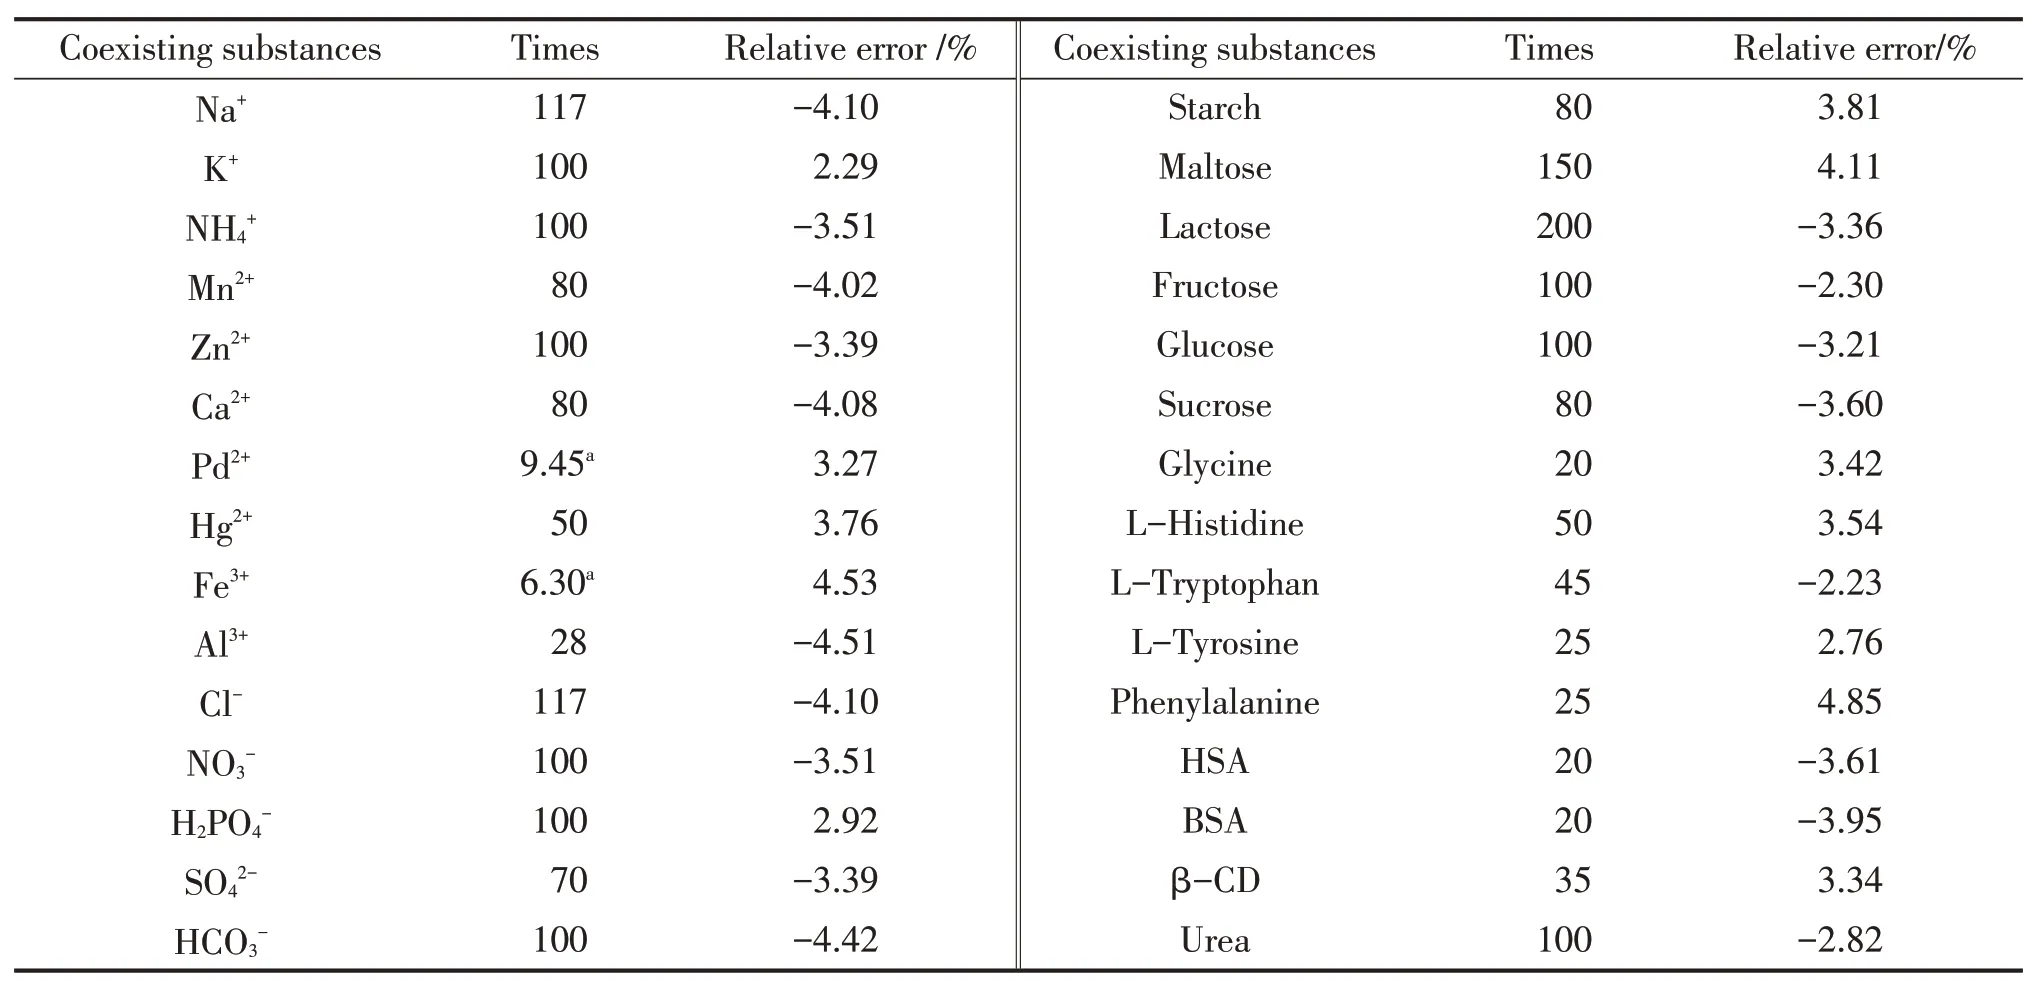
Tab.1 Effects of coexistence substances on the analysis and determination of APM (cAPM=10.0 mmol/L)
2.7 Mechanism of the reaction system
The working mechanism of this sensor was discussed and speculated as follows, based on the structure of all involved compounds and spectrum signals.The structures of GLA, Glu and L-Arg were studied through FT-IR as shown in Fig.8 (a).In the IR spectra of GLA, the peak at about 1 612 cm-1could be attributed to the C—N bond due to the reaction be-tween carbanyl group of Glu and amino group of LArg.The peaks at about 1 406 and 1 344 cm-1could indicate the existence of carbanyl group and hydroxyl group.As shown in Fig.3 ,under the optimal conditions,the fluorescence intensity of the GLA was quenched obviously with the addition of Cu2+[curve (b) ], and the color also changed to pale green gradually.However, in Fig.4 , the RRS intensity increased dramatically with a new characteristic RRS peak appearing at 328 nm when adding Cu2+into GLA solution[curve (b) ]The decrease of fluorescence intensity and the increase of RRS intensity may be due to the formation of a GLA-Cu2+complex.Hence, the change of fluorescence and RRS spectrum may result from the coordination of Cu2+to the carbanyl group and hydroxyl group on GLA[19-20].In order to prove our speculation, we further studied the FT-IR spectra of GLA-Cu2+system.As demonstrated in Fig.8 (b), the original peaks of GLA at 1 406 and 1 344 cm-1disappeared and a new peak at about 1 383 cm-1occurred because of the reaction between Cu2+and the GLA.
However, as soon as APM was added into the above system, the fluorescence intensity recovered instantly and the emission light improved with a more shallow color compared to the original GLA[Fig.3 (c)].The recuperation of fluorescence intensity may be caused by the coordinative effect between APM and Cu2+which was even stronger than that between Cu2+and GLA[1].On the other hand, it was found that the RRS intensity decreased after APM was added into the GLA-Cu2+system, as shown in Fig.4 .As we all know, the RRS spectral characteristics and RRS scattering intensity are strongly influenced by the molecular size, shape, conformation, and interfacial properties, which provide favorable new information for the study of the interaction of biological molecules.[21-22]So, the increase of RRS intensity may be due to the increase of the molecular scattering volume of GLACu2+when Cu2+was added.Nonetheless, because the volume of APM is smaller than GLA, the size of the new metal complex (Cu2+- APM) decreased when APM replaced GLA in the solution., Therefore, the RRS intensity of the system eventually quenched.
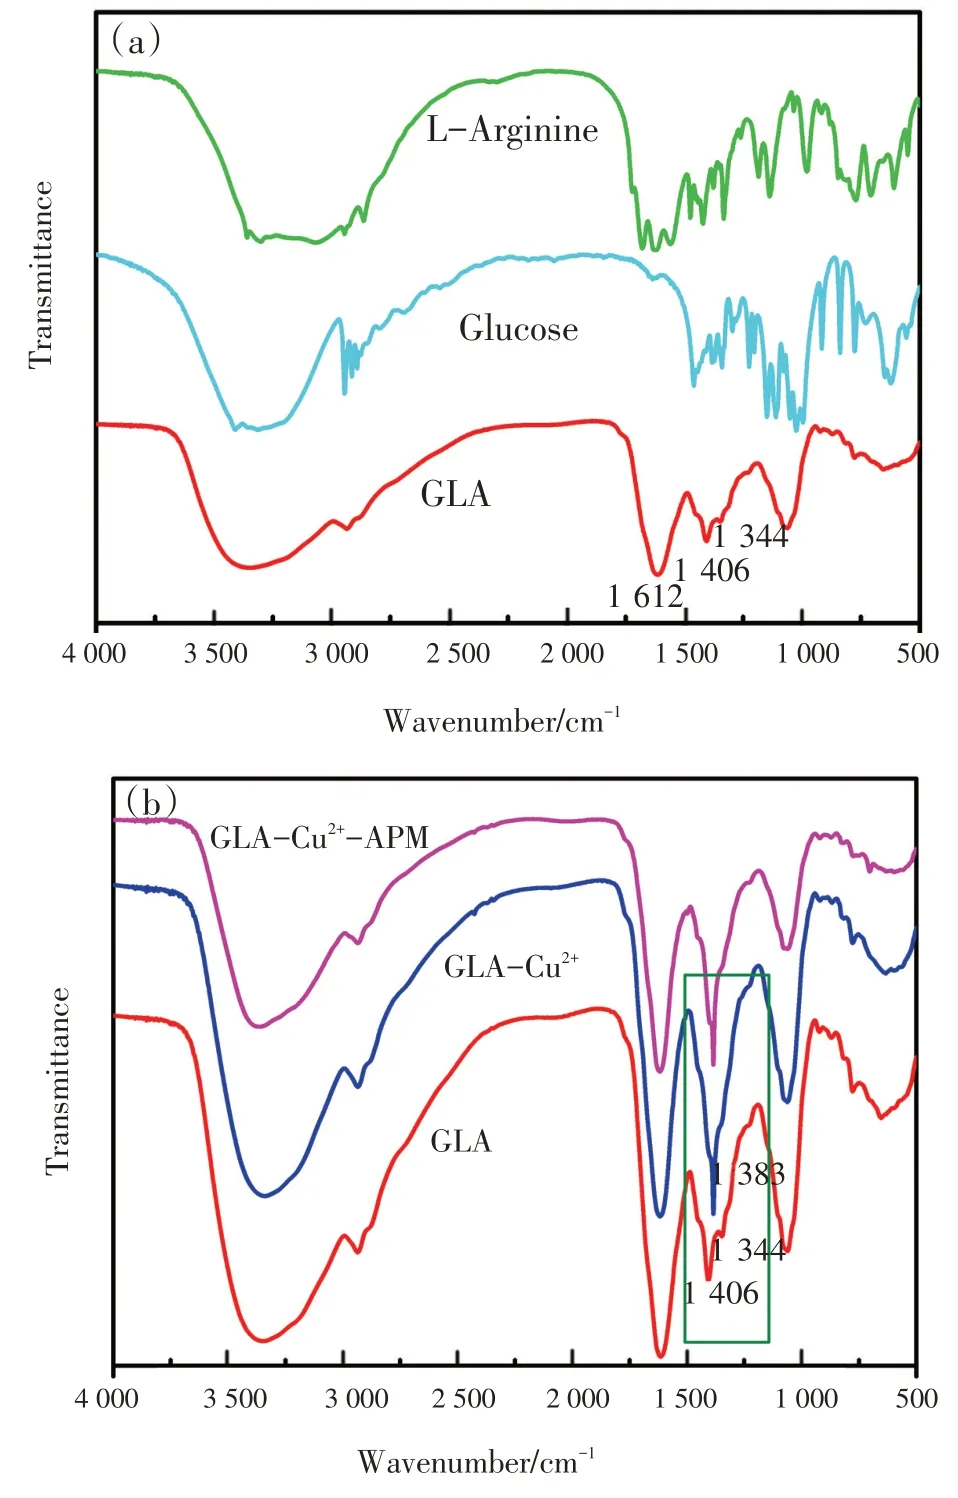
Fig.8 The Fourier Transform Infrared (FT-IR) spectrum of(a) single GLA, Glu ,L-Arg and (b) the systems of GLA-Cu2+,GLA-Cu2+-APM
Furthermore, the UV-vis absorption spectra of GLA in the absence and presence of Cu2+were recorded.As shown in Fig.9 , the absorption peak of GLA was located at 295 nm.By adding Cu2+, a new peak appeared at 755 nm but the initial peak of GLA disappeared, indicating that GLA reacted with Cu2+and formed a new complex.However, when APM was added, a blue shift of the absorption peak occurred and the characteristic peak was relocated at 655 nm because the binding force between GLA and Cu2+was weakand allowed to make a relative strong binding force between APM and Cu2+.Hence, the fluorescence recovery of GLA-Cu2+system was caused by the interaction of Cu2+with APM as well.APM contains carboxyl group and amino group that could react with Cu2+through chelation, so the fluorescencerecovery and RRS decrease could be attributed to the competitive-displacement between GLA and APM for Cu2+.
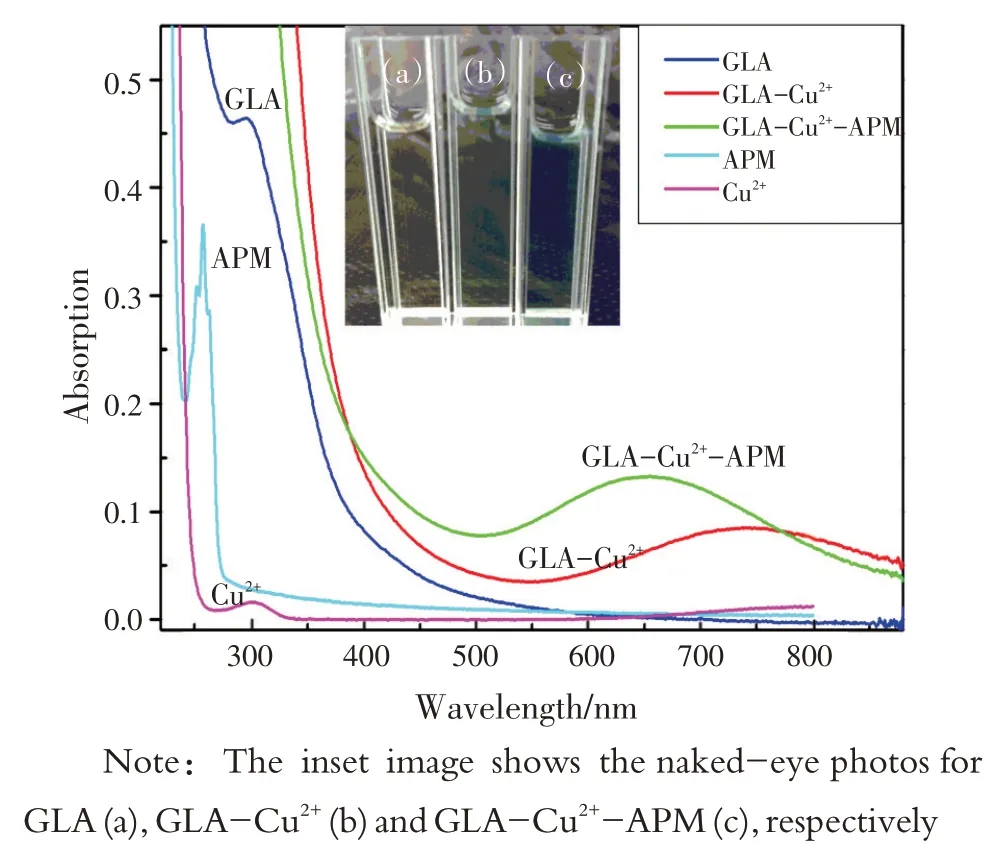
Fig.9 UV-Vis absorption spectra of GLA, GLA-Cu2+, GLACu2+-APM, APM, Cu2+
2.8 Calibration curve
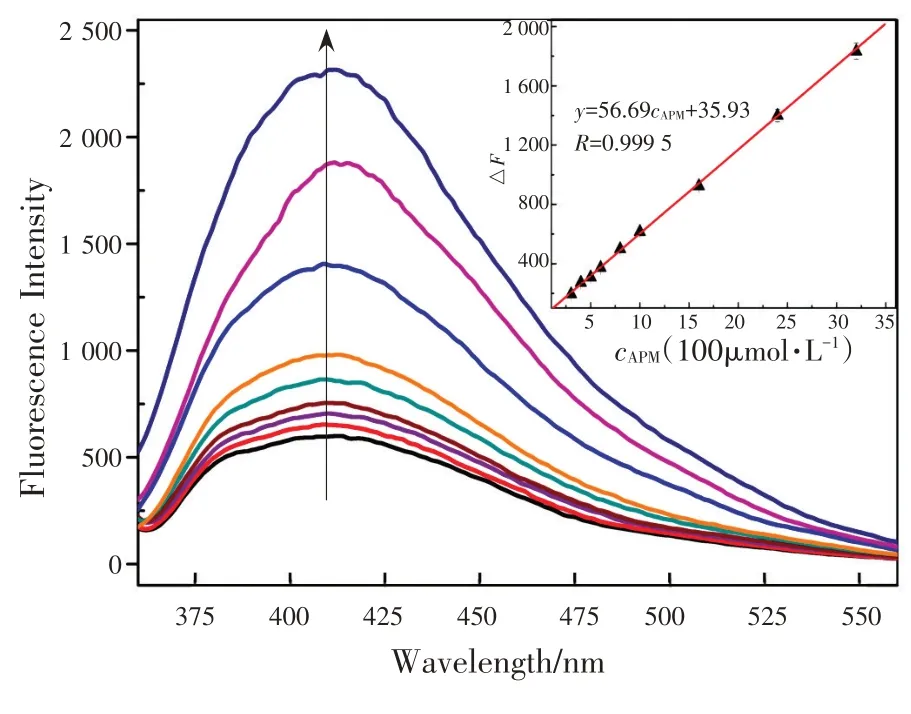
Fig.10 Fluorescence sprectra of GLA-Cu2+ (cGLA=1.0 mmol/L,cCu2+=0.5 mmol/L)system with different concentrations of APM
Under the optimal conditions, the fluorescence spectra of GLA-Cu2+system with different concentrations of APM are shown in Fig.10 .The relative fluorescence intensity (fluorescence intensity recovery)was defined as ΔF=F1-F0, whereF0andF1were the fluorescence intensity of GLA-Cu2+system in the absence/presence of APM, respectively.ΔFwas found to be proportional to the concentrations of APM in the ranges of 0.3~300 μmol/L as shown in Fig.10 (inset).The limit of detection was 26 nmol/L based on 3σ/S(whereσis the standard deviation of the 11 blank determinations andSis the slope of the calibration).The linear regression equation was ΔF=56.69c+35.93 (wherecthe concentration of APM).The correlation coefficient was 0.999 5.
The RRS spectra of GLA-Cu2+with different concentrations of APM were also discussed in Fig.11 .Compared to the changes of fluorescence, the RRS intensity at 328 nm of GLA-Cu2+system decreased gradually when the concentration of APM increased.As shown in Fig.11 , the RRS intensity (IRRS) was proportional to the concentration of APM in the ranges of 0.4~800 μmol/L and the limit of detection was 39 nmol/L.The linear regression equation wasIRRS=-0.942c+7.941 (wherecthe concentration of APM with a correlation coefficient of 0.999 3.
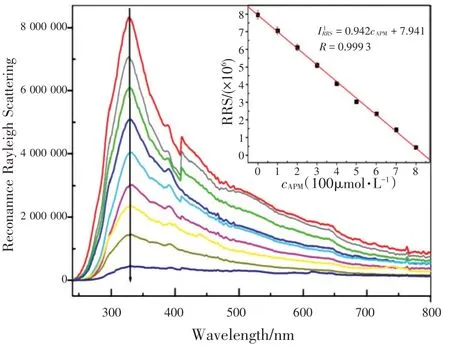
Fig.11 The RRS spectra of of GLA-Cu2+ (cGLA=0.1 mmol/L,cCu2+=0.5 mmol/L)system with different concentrations of APM
3 Analysis of APM in water sample by this method
The standard tests for detecting APM in real water samples were also investigated in order to justify the reliability and practicality of the proposed meth-od.The samples were taken from tap water, and no APM was detected.In order to purify the water samples, all of them were filtered by a filter paper.In the experiment, each sample was tested five times to obtain the averaged recovery rates.As shown in Tab.2 ,the mean rates of APM were fluctuated from 97.80%to 101.67%, and the relative standard deviation was less than 3%.The results indicated that the proposed method had a good reliability and accuracy for APM detection in tap water samples.

Tab.2 Recovery test of APM in tap water samples
4 Conclusion
In summary, the GLA with optical activity and water solubility was synthesized by the Maillard reaction of Glu and L-Arg with simple experimental procedures.The basic optical properties of GLA have been studied.GLA-Cu2+complex was formed from the chelation of the highlight blue-emitting fluorescent product with Cu2+and selected as a sensing platform of fluorescence (FL) or resonance Rayleigh scattering (RRS) for the determination of aspartame(APM).The fluorescence turn-off-on response and RRS turn-on-off response of GLA-Cu2+were investigated.Based on the characteristics of the FL and RRS spectra.a novel Sensing Platform for Fast Detection of Aspartame was proposed, which is effective and reliable.This GLA-Cu2+sensing platform has been applied to the detection of APM in real water samples with satisfactory results.Therefore, GLACu2+could serve as the sensing platform with lowcost and excellent optical performance through Maillard reaction to detect other chiral substances for various purposes.

