
An evaluation of soil moisture from AMSR-E over source area of the Yellow River,China
2019-06-11 03:05:30TangTangZhangMekonnenGebremichaelAkashKoppaXianHongMengQunDuJunWen
TangTang Zhang,Mekonnen Gebremichael,Akash Koppa,XianHong Meng,Qun Du,Jun Wen
1.Key Laboratory of Land Surface Process and Climate Change in Cold and Arid Regions,Northwest Institute of Eco-Environment and Resources,Chinese Academy of Sciences,Lanzhou,Gansu 730000,China
2. Department of Civil and Environmental Engineering, University of California, Los Angeles, California 90095-1593,USA
3.Zoige Wetland and Ecosystem Research Station,NIEER,Zoige,Sichuan 624500,China
4. State Key Laboratory of Atmospheric Boundary Layer Physics and Atmospheric Chemistry, Institute of Atmospheric Physics,Chinese Academy of Sciences,Beijing 100029,China
5.College of Atmospheric Sciences,Chengdu University of Information Technology,Chengdu,Sichuan 610225,China
ABSTRACT In this study, in-situ soil moisture measurements are used to evaluate the accuracy of three AMSR-E soil moisture products from NASA(National Aeronautics and Space Administration), JAXA(Japanese Aerospace Exploration Agency) and VUA(Vrije University Amsterdam and NASA) over Maqu County, Source Area of the Yellow River (SAYR), China. Results show that the VUA soil moisture product performs the best among the three AMSR-E soil moisture products in the study area, with a minimum RMSE (root mean square error) of 0.08 (0.10) m3/m3 and smallest absolute error of 0.07 (0.08) m3/m3 at the grassland area with ascending (descending) data. Therefore, the VUA soil moisture product is used to describe the spatial variation of soil moisture during the 2010 growing season over SAYR.The VUA soil moisture product shows that soil moisture presents a declining trend from east south (0.42 m3/m3) to west north (0.23 m3/m3), with good agreement with a general precipitation distribution.The center of SAYR presents extreme wetness (0.60 m3/m3)during the whole study period, especially in July, while the head of SAYR presents a high level soil moisture (0.23 m3/m3) in July,August and September.
Keywords: AMSR-E soil moisture products; soil moisture ground measurements; source area of the Yellow River;AMSR-E soil moisture products applicability
1 Introduction
Soil moisture is a key parameter in meteorology and hydrology and also an important land surface state variable that has long memory to affect the exchange of water, energy, and carbon between the land surface and atmosphere (Albergel et al., 2012). Soil moisture is tightly coupled with land-atmosphere processes and variables, such as evapotranspiration, sensible heat flux and regional air temperature, and can directly affect global circulation because of its memory to precipitation (Orth and Seneviratne, 2012). Most importantly, soil moisture can affect the onset, duration and strength of monsoons and hence holds potential for improving weather forecasts and climate predictions (Douvilleet al., 2001; Xueet al., 2004; Zuo and Zhang,2016).
Soil moisture is spatially and temporally heterogeneous, even in small catchments (Gómez-Plaza et al.,2000; Susan et al., 2007).This heterogeneity is due to variability in soil physical properties (Hawley et al.,1983), geology, land use (De Rosnay et al., 2006;Zucco et al.,2014),rainfall distribution,irrigation and topography (Western and Blöschl, 1999; Qiu et al.,2001).Therefore,accurate measurements of soil moisture at relevant spatial and temporal resolutions are necessary.
Conventional ground measurements are usually used to measure soil moisture at a specific depth.Although in-situ soil moisture measurements are extremely valuable, they have some practical limitations(Su et al., 2011). As point observations, ground measurements do not adequately represent the spatial heterogeneity of soil moisture(Bi et al.,2016).Also,it is laborious and time consuming to obtain reasonable large spatial and temporal estimates of soil moisture(Wen and Su, 2003; Qin et al., 2009; Zhang et al.,2009).
Satellite remote sensing has emerged as an alternative source of spatially and temporally consistent soil moisture datasets. Passive and active microwave technologies can provide measurements of surface soil moisture (Schmugge, 1983; Jackson and Schmugge, 1989; Njoku and Entekhabi, 1996; Wagner et al., 1999; Colliander et al., 2017; Chan et al.,2018). Soil moisture retrieval from active microwave sensors is seen to be less reliable due to surface roughness interference (Kerr, 2007). The Advanced Microwave Scanning Radiometer on the Earth Observing System (AMSR-E) is one such passive microwave sensor onboard the Aqua satellite from which soil moisture estimates have been successfully retrieved (Njoku et al., 2003; Njoku and Chan, 2005; Bindlish et al., 2006; Ray and Jacobs,2006; Sahoo et al., 2008; Draper et al., 2009; Kang and Kanniah, 2013; Cho et al., 2017). The satellite was launched on May 4, 2002 and provides a potentially improved soil moisture sensing capability over previous spaceborne radiometers such as the Scanning Multichannel Microwave Radiometer and Special Sensor Microwave/imager due to its combination of low frequency and high spatial resolution(Njoku et al.,2003;Njoku and Chan,2005).
From literature, AMSR-E soil moisture products have been widely validated in different hydroclimatic regions, e.g., the United States,Australia, France, Italy, Spain and China (Njoku et al., 2003; Njoku et al.,2005; Draper et al., 2009; Jackson et al., 2010; Dente et al.,2012a;Chen et al.,2013;Draper et al.,2013;Jiang et al., 2017). Also, evaluations of soil moisture from AMSR-E were conducted over the Tibetan Plateau (Chen et al., 2013; Zeng et al., 2015), which focused on the difference between AMSR-E soil moisture products and reanalysis soil moisture products or simulations from different models (Chen et al., 2013;Zeng et al.,2015;Bing et al.,2016).Actually,there is a big difference of soil water content with different algorithms, which presents a challenge of which algorithm is robust enough to estimate soil moisture even in a certain area (Draper et al., 2013). It is also very important to closely estimate soil moisture to the real value with AMSR-E sensor over the source area of the Yellow River for its potential applications of AMSR-E at large scale during 2002-2011. Therefore, in this study we investigate the potential of three different AMSR-E soil water content products using ground measurements over the source area of the Yellow River.
2 Study area
The Source Area of the Yellow River is located(SAYR) in the northeastern part of the Tibetan Plateau, China. Geographically, it lies between 95.5°E-103.5°E and 32.5°N-36.5°N. SAYR covers a catchment area of 121,972 km2which is 16% of the Yellow River Basin. The annual average temperature in the study region is below zero, and the average precipitation is about 485.9 mm between 1956 and 2010 (Pan et al.,2015).There is no clear division of seasons,but diurnal variations of temperatures are large (Jin et al.,2009).More than 75% of the total annual rainfall falls in the wet season (June to September) caused by the southwest monsoon from the Bay of Bengal. Rainfall tends to decrease from the southeast (about 600 mm/a)to the northwest (about 400 mm/a) (Hu et al., 2012;Iqbal et al., 2018). The annual average temperature varies from -5 °C to -2.4 °C,and topography elevation ranges from 2,392 m to 6,248 m (Wang et al.,2015).
3 Materials and methods
3.1 AMSR-E soil moisture data
AMSR-E onboard the Aqua satellite is a passive microwave sensor, operated between May 2002 and October 2011 (Njoku et al., 2003), and provides measurements at six different frequencies. Near surface soil moisture can be obtained through microwave brightness temperature with a C-band observation (Njoku et al., 2003), and the algorithm was updated in 2005 (Njoku and Chan, 2005).A few methods are usually used to retrieve soil moisture from AMSR-E data, but three different soil moisture products generated by (1) NASA(National aeronautics and space administration); (2) JAXA (Japanese aerospace exploration agency); and (3) VUA-NASA(Vrije University Amsterdam and NASA) (Draper etal., 2013) are used in this study, and all observations are with C-band observations. All these soil moisture products are based on different frequency microwave brightness temperature of AMSR-E, and all three brightness temperature data (25km×25km)are resampled of overlayed stripe data (45km×75km).The main difference between the three methods lies in the way the unknown parameters (vegetation and soil temperature) are estimated. NASA uses a semiempirical regression algorithm for soil moisture estimation (Njoku et al., 2003; Njoku and Chan,2005). JAXA retrieves soil moisture by introducing a soil moisture index (Draper et al., 2009); and VUA estimates soil moisture and vegetation optical depth by using the index difference of polarization(Owe et al.,2001).
3.2 In-situ moisture data
Time series of AMSR-E soil moisture are compared to in-situ soil moisture data from Source Area of the Yellow River. The network was installed in 2008 at the northeastern edge of the Tibetan Plateau,located in the southern part of Maqu County, China.The network consists of 20 sites (Table 1) which cover approximately 40km×80km. These sites recorded soil moisture and temperature every 15 minutes at different soil depths including 5,10,20,40 and 80 cm.Elevations at these sites range from 3,430 m to 3,750 m above sea level including typical landscapes with hills, valleys and grasslands. The climate of these sites is cold and humid with dry winters and rainy summers due to the influence of monsoons. Details of this network can be found in Dente et al. (2012b) and Su et al. (2011). Ground measurements data of 2010 are used in this study.
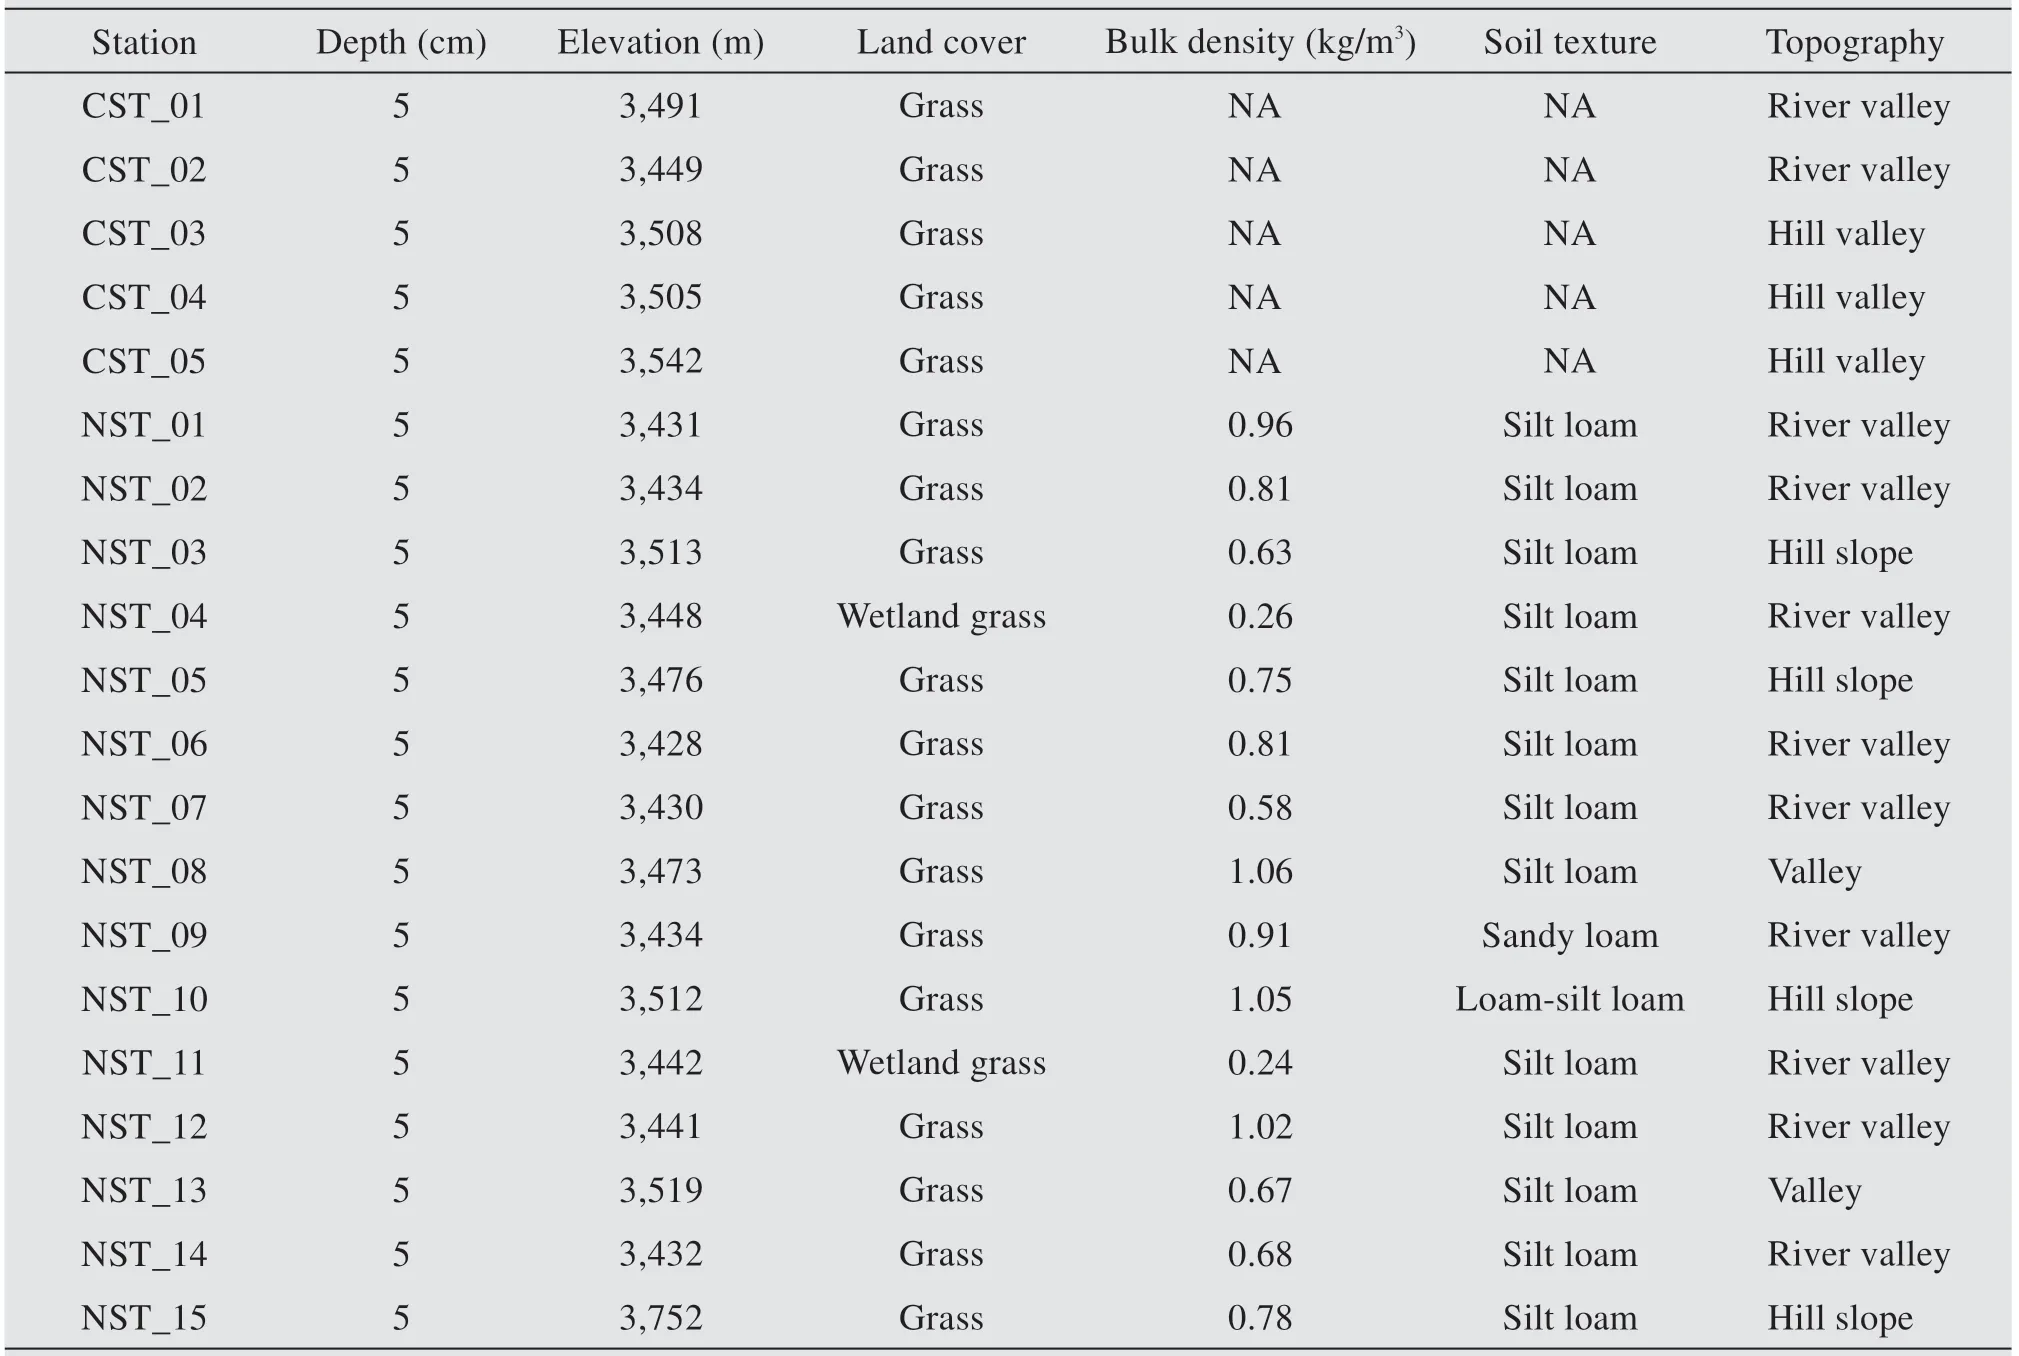
Table 1 Maqu network station information(Dente et al.,2012b)
3.3 Evaluation strategies
In order to effectively validate AMSR-E soil moisture over the entire network, the following rule is adopted. If an AMSR-E pixel is occupied by three or less nodes in the network, the spatial variability of the soil moisture might not be well monitored. Therefore,it was checked if AMSR-E pixels cover at least half the area (33°35'N-34°05'N, 101°45'E-102°45'E) of ground network measurements. If yes, then the average of spatial soil moisture over the network is computed to be the measurements for this pixel. As the pixel of the satellite data does not always cover all ground measurements, the value of soil moisture from ground-based network is computed as follows:

A time series of AMSR-E average soil moisture is obtained for the time period between January 1 and December 31, 2010. Data analysis is carried out separately for products retrieved from AMSR-E ascending data and those retrieved from descending data, because these are characterized by a different acquisition time and by different RFI effects, as they each have different swath coverage.
Firstly, the general seasonal behavior of the time series of the AMSR-E data spatial average is compared to the corresponding spatial average of in-situ measurements (Figure 1) at 5 cm depth. Then, the determination coefficient (DC), the root mean standard error (RMSE), and AE (absolute error) between AMSR-E soil moisture spatial average and in situ spatial average with data from August to September are investigated (Table 2, the units of RMSE and AE are m3/m3).The scatter plots are also presented in Figure 3.
Finally, the spatial distribution (averaged by all the available soil moisture from VUA) of soil moisture (June, July, August and September) of VUA are investigated(Figure 2).
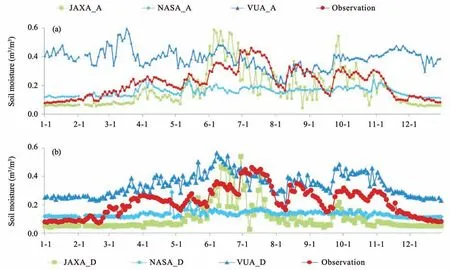
Figure 1 Temporal variation of three soil moisture products obtained from ascending overpasses(top)and from descending overpasses(bottom),compared with in situ soil moisture measurements and precipitation in 2010
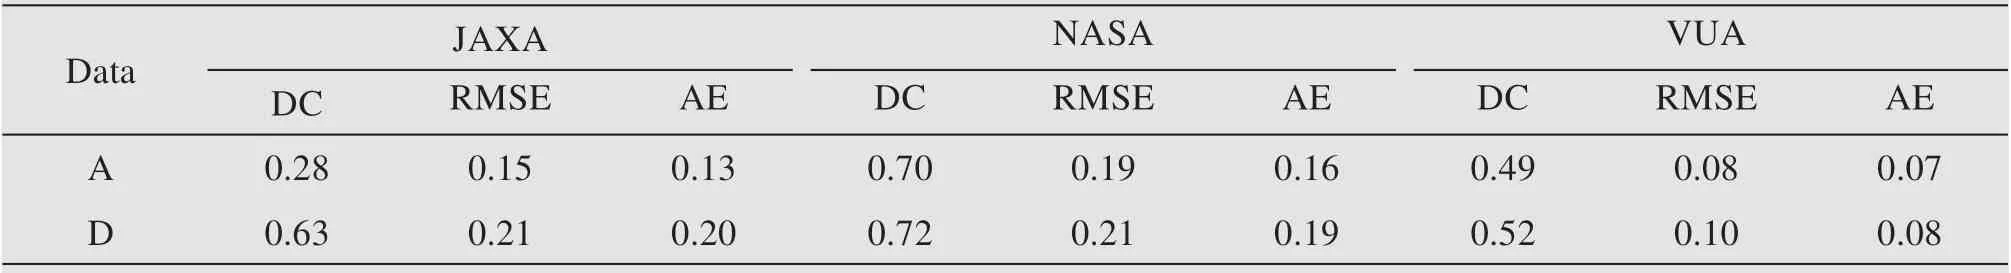
Table 2 Statistics of AMSR-E soil moisture and soil moisture of network measurements
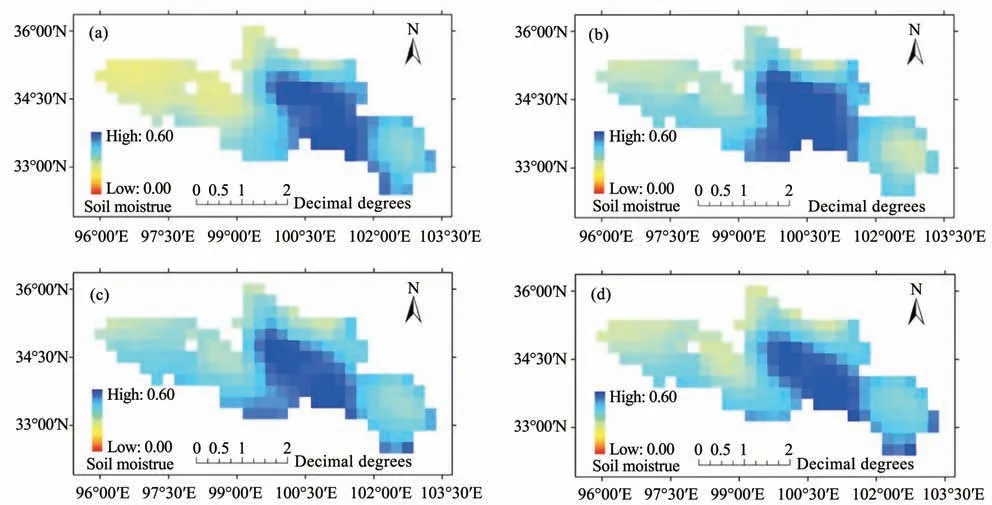
Figure 2 Variation of soil moisture over the SAYR during the period from June to September(the unit of soil moisture is m3/m3)

Figure 3 The three soil moisture data from AMSR-E versus ground measurements of top layer soil moisture(July,August and September)for ascending passes(top)and for descending passes(bottom)
4 Results
4.1 Temporal analysis
The time series of AMSR-E products,spatially averaged over the area of interest, are compared with the in situ average,as presented in Figure 1.The comparison is done separately for ascending and descending products. The soil moisture from ascending of JAXA and NASA shows good agreement with in situ measurements except the VUA product during the period from January 1 to the end of May and the period from October 1 to the end of December (Figure 1,upper).All the soil moisture products show good agreement with in situ measurements during the period from the beginning of June to the end of September(Figure 1,upper).However,the soil moisture from descending of VUA shows better agreement with in situ measurements during the period from the beginning of March to the end of November than that of NASA and JAXA(Figure 1,lower).
The seasonal behavior of the AMSR-E products is in agreement with that of in situ measurements. Figure 1 shows that the soil moisture values are pretty low from January till March and from mid-November till the end of the year, and then increases during the period from March to May due to melt water from snow accumulation in the winter of 2009. Precipitation is the main driver of soil moisture which fluctuates from May to October, and is concentrated between May to September. Thus, soil moisture values are always high during the period from May to October, and fluctuate according to changes in precipitation.
4.2 Spatial analysis
Figure 2 shows the spatial variation of soil moisture over the SAYR during the period from June to September.As seen in Figure 2, soil moisture shows a declining trend from east south (0.42 m3/m3) to west north (0.23 m3/m3), which is in good agreement with the spatial precipitation distribution (Hu et al.,2012; Iqbal et al., 2018). Their research shows that the spatial pattern of precipitation in SAYR is also a declining trend from east south (Ruoergai with around 600 mm/a) to west north (Maduo with around 400 mm/a). The center of SAYA shows extreme wetness (0.60 m3/m3) in the whole study period, especially in July,while the head of SAYR has high soil moisture values (0.23 m3/m3) in July, August and September. Figure 3 shows that there is the best relationship between the VUA soil products and the in situ measurements than that of between NASA, JAXA and in situ measurements.
4.3 Discussion
In this research,we find that the VUA soil moisture product shows the best accuracy between the three soil moisture products of JAXA, NASA and VUA. The JAXA product shows higher fluctuations of the retrieved soil moisture product and seems best to capture variations in ground measurements(Figure 2).The soil moisture of ascending product reaches a maximum(0.59 m3/m3) in mid-June, and reaches a minimum(0.04 m3/m3) in the beginning of August (Table 3).The average value of a whole year is 0.18 m3/m3with good agreement compared with the ground observation 0.22 (m3/m3). The soil moisture of descending product reaches a maximum (0.54 m3/m3) in mid-June,and reaches a minimum(0.03 m3/m3)in the beginning of August. The average value of the whole year calculated from ground measurements is 0.22 m3/m3.The maximum(minimum)ground measurements of soil moisture is 0.47 m3/m3(0.08 m3/m3) for ascending pass,with the average value of soil moisture is 0.22 m3/m3,while the minimum ground measurements of soil moisture is 0.07 m3/m3for descending pass.

Table 3 Statistics of the AMSR-E soil moisture and ground measurements in 2010(units:m3/m3)
The NASA product shows an underestimation of soil moisture during the whole year except the period during October to the March of next year.The ascending product has a maximum value of 0.24 (m3/m3),and a minimum of 0.11,the average value is 0.16.The descending product has a maximum of 0.29 (m3/m3),and the minimum value of 0.11 (m3/m3), the average value is 0.13(m3/m3).
The VUA product (ascending and descending)shows the best agreement with in situ measurements from June to September.The ascending product reaches a maximum of 0.60 m3/m3and a minimum of 0.21 m3/m3respectively, with an average 0.39 m3/m3for the whole year. The descending product reaches a maximum of 0.57 m3/m3and a minimum of 0.18 m3/m3respectively, with an average 0.34 m3/m3in a whole year.Figure 2 shows that all three AMSR-E soil moisture from ascending passes are higher than descending passes.
These results are from an assumption in the retrieval algorithm. The plant layer and ground surface have the same temperature, although vegetation has resistance effect for temperature to increase. One should also note that recent studies have demonstrated the understanding of L-Band microwave emission in the frozen soil from various perspectives (e.g., discrete scattering model (Zheng et al., 2017)), such as soil temperature sensing depth (Lv et al., 2018; Lv etal., 2019). These developments will eventually contribute to the retrieval of soil moisture over high latitude regions during the winter period.
Figure 2 shows that there is higher agreement between AMSR-E soil moisture retrieved from descending data and in situ data, than that from ascending data for all three products, although R2remains relatively low from descending passes, i.e., 0.63 for JAXA,0.72 for NASA, and 0.52 for VUA (Table 2). The plots also show that RMSE from AMSR-E ascending passes retrieval is a little smaller than RMSE from descending passes retrieval, i.e., 0.15 m3/m3for JAXA,0.19 m3/m3for NASA and 0.08 m3/m3for VUA(Table 2), and AE also show similar results with RMSE.Therefore, we can conclude that the soil moisture from descending pass can better capture the trend of soil moisture variation, while the soil moisture from ascending pass can better capture the quantity of soil moisture.
Most importantly, we find that irrespective of whether the soil moisture is derived from ascending or descending passes, soil moisture from the VUA algorithm does the best job in capturing the quantity and soil moisture trend (Table 2). RMSE and AE are both the smallest among the three soil moisture products. Hence we utilize the VUA product to investigate the spatial variation of soil moisture over SAYR of the Tibetan Plateau(Figure 2).
5 Conclusions
The validation of AMSR-E soil moisture products is a crucial step before planned application.The application of AMSR-E products is expected to contribute to a better understanding of the hydrologic processes in the source area of the Yellow River. Thus, the primary contribution of this study is to comprehensively validate AMSR-E soil moisture products by comparing them with in situ data collected from Maqu soil moisture networks observation in 2010.
It can be seen that the NASA product could reflect the trend of soil moisture variation in the whole period,and the DC reaches 0.72 for descending data,with the root square error of less than 0.19 m3/m3for ascending data. Unfortunately, this product excessively underestimates soil moisture in the period of August and September in which the soil is covered by dense vegetation.
Whether the soil moisture is from ascending or descending passes, soil moisture from VUA is the best in capturing true soil moisture. Compared with ground measurements, both RMSE and AE of the VUA product are the least among the three soil moisture products, expect for the cold period. RMSE of VUA is 0.08(0.10)m3/m3and AE is 0.07(0.08)m3/m3for ascending(descending)data.
The presence of frozen soil and snow in Maqu might be one of the causes of low retrieval accuracy in the period of frozen soil, amplified by the fact that the input information about frozen surfaces used in the three AMSR-E retrieval processes was probably inaccurate. A further analysis of the input parameters in the algorithms is needed to assess its accuracy during the frozen season over the source area of the Yellow River.
Acknowledgments:
This study was supported in part by the Programs of National Natural Science Foundation of China(41675157,91537212).
 Sciences in Cold and Arid Regions2019年6期
- Sciences in Cold and Arid Regions的其它文章
- Spatiotemporal variations in moisture conditions across Monsoon Asia during the last 500 years
- Vegetation change and its response to drought in Inner Mongolia of northern China from 1998 to 2013
- Characteristics of climate and melt runoff in the Koxkar Glacier River Basin,south slope of the Tianshan Mountains,Northwest China
- Definition of failure criterion for frozen soil under directional shear-stress path
- Editors-in-Chief Guodong Cheng and Ximing Cai
- Relationship between ponding and topographic factors along the China-Russia Crude Oil Pipeline in permafrost regions