
Vegetation change and its response to drought in Inner Mongolia of northern China from 1998 to 2013
2019-06-11 03:05:28ShuLinLiuTaoWangWenPingKangZiChenGuoXueQinZhang
ShuLin Liu,Tao Wang,WenPing Kang,ZiChen Guo,XueQin Zhang
Key Laboratory of Desert and Desertification, Northwest Institute of Eco-environment and Resources, Chinese Academy of Sciences,Lanzhou,Gansu 730000,China
ABSTRACT Vegetation plays a significant role in global terrestrial ecosystems and in combating desertification. We analyzed vegetation change in Inner Mongolia of northern China using the Normalized Difference Vegetation Index (NDVI)from 1998 to 2013, which is an important composite of Chinese National Ecological Security Shelter. The correlation between vegetation growth and drought quantified using the Standardized Precipitation Evapotranspiration Index (SPEI) was also explored. Results show that vegetation in most of the study area has been rehabilitated to various degrees, especially in regions such as most of the Horqin Sandy Land,eastern Ordos Plateau,Hetao Plain,as well as the middle-northern Da Hinggan Ling Mountains. Vegetation improvement in spring was significant in most of the study area. Vegetation degradation was centrally distributed in Xilingol grassland close to the Sino-Mongolia border and abandoned croplands in Ulanqab Meng.Vegetation change trends and seasonal differences varied among different vegetation types.The biggest vegetation variation in the growing season was the belt-like distribution along those grasslands close to the precipitation isoline of 200 mm and the Sino-Mongolia border, but also variation in summer and autumn exist in obvious spatial differences between grasslands and forests. Drought largely influenced vegetation change of Inner Mongolia at 6-month scale or 12-month scale,except for forests of eastern Hunlun Buir Meng and deserts or gobi deserts of western Alxa Meng.Moreover,drought in the previous winter and early spring seasons had a lag effect on growing-season vegetation. Desert grassland was the most easily affected by drought in the study area.Anthropogenic activities have made great progress in improving local vegetation under the lasting drought background.
Keywords:vegetation change;drought;SPOT NDVI;SPEI;Inner Mongolia
1 Introduction
Vegetation plays an important role in global terrestrial ecosystems (Pielkeet al., 1998), which links soil and atmosphere through energy and mass transports(Ichiiet al., 2010). In arid and semi-arid regions, vegetation cover can directly influence wind erosion and local aeolian activity (Okinet al., 2006; Munsonetal., 2011), and even there producing important feedbacks among aeolian-hydrological processes and vegetation (Gonzales et al., 2018). Moreover, vegetation degradation threatens socioeconomic development,while vegetation recovery enhances socioeconomic development (Mirzabaev et al., 2016). Thus, vegetation dynamics and its response to climate change have become an important theme in current global environmental change research (Braswell et al., 1997; Piao et al., 2011; Zhou et al., 2015; Jiang et al., 2017; Zhou et al.,2018).
Satellite-derived Normalized Difference Vegetation Index (NDVI), which can reflect growth conditions of vegetation and the biophysical or biochemical characteristics of ecosystems (Piao et al., 2011), has been widely used to investigate vegetation dynamics worldwide (Lotsch et al., 2005; Park and Sohn, 2010;Zhao and Running,2010;Zhang et al.,2013).Researches had explored relationships between NDVI and temperature (Braswell et al., 1997) or precipitation (Wang et al., 2003; Piao et al., 2006; Zhang et al., 2011), respectively. Some researchers have proven that effects of precipitation on vegetation show an obvious time lag, which can last several days to several months(Piao et al.,2003;Wang et al.,2003;Zhao et al.,2011;Wu et al., 2015). With global warming, droughts are becoming more frequent (Su et al., 2018) and show an obvious increasing trend(Vicente-Serrano et al.,2013).Moreover, droughts play an important role in carbon and hydrology processes of terrestrial ecosystems, particularly in water-limited semi-arid ecosystem (Hu et al., 2006). Thus, the relationships between vegetation dynamic and drought conditions are under increased scrutiny (Lotschet al.,2005;Zhao and Running,2010;Kang et al.,2018;Zhou et al.,2018).
The Inner Mongolia Autonomous Region (hereinafter referred to as Inner Mongolia) of northern China is an important composite of Chinese National Ecological Security Shelter, which is suffering from serious drought (Liu et al., 2016), grassland degradation,desertification, and frequent dust storms during the last few decades (Wang et al., 2004; Liu et al., 2013).A series of large scale ecological construction and protection projects were implemented since the early 21st century, e.g., the Three-North Shelter Forest Program,Combating Desertification Project, Grain for Green Program and grazing restriction policies. Some reports have indicated that human activity may be the primary driving force for vegetation dynamics in arid and semi-arid regions (Zheng et al., 2006). Some argued that precipitation is a major determiner for interannual variations and spatial patterns of NDVI at a regional scale, whereas human activity is the cause of NDVI variations at a local scale (Zhouet al., 2015).Thus, it is important to determine the situations and driving factors of vegetation change in Inner Mongolia in recent years, and how vegetation dynamics respond to climate change.
This paper aims at 1) revealing temporal and spatial dynamic change of vegetation;2)exploring the influence of drought and human activity on vegetation change.
2 Methodologies
2.1 Study area
Inner Mongolia of northern China covers an area of 1.18×10⁶km2, and is located between 37°N-54°N and 97°E-127°E. This region has a temperate continental monsoonal climate, with cold and long winters and warm and short summers. Except for the relatively humid Da Hinggan Ling Mountains, most of Inner Mongolia is arid, semi-arid or semi-humid from west to east.The region has an average annual temperature of -5 to 10 °C and an annual average precipitation of 30-500 mm during the last five decades. This study area mainly consists of different coverage of grasslands (occupied by 46.0%) from east to west, with a mosaic distribution of the Hulun Buir Sandy Land,the Horqin Sandy Land, the Otindag Sandy Land and the Mu Us Sandy Land. Forest or woodlands (occupied by 14.4%) are mainly distributed in the northern Da Hinggan Ling Mountains, while deserts (occupied by 12.8%) are mainly in Alxa Meng, such as the Ulan Buh Desert, the Tengger Desert and the Badain Jaran Desert. Farmlands (occupied by 9.9%) are mainly concentrated in Xingan Meng, Tongliao Shi and Chifeng Shi to the east of the Da Hinggan Ling Mountains, and Baotoushi, Hohhot Shi and Ulanqab Meng along both sides of the Yinshan Mountains, as well as the Hetao Plain in Bayannur Meng (Figure 1). For the convenience of discussion, three subareas were divided in the study area, including the north-east (I),south-east (II) and middle-west subareas (III) (Figure 1),mainly based on the Cluster Analysis Results of 46 weather stations(Liu et al.,2016).
2.2 Data and processing
The original data used in this paper mainly are a series of 10-day composite images (S10 products) of the SPOT VGT sensor. VGT-S10 data are generated by selecting pixels that have maximum NDVI values within a 10-day period.These S10 products are operationally generated based on a pixel selection by the Maximum Normalized Difference Vegetation Index(NDVI), and they are radio-metrically calibrated, precisely geo-located and corrected for atmospheric effects by Flemish Institute for Techno-logical Research, Vito, Belgium. Multi-temporal geo-location accuracy of the VGT data is particularly good, and thus the data are well suited to change detection applications. For more information on the VGT instrument,see the VEGETATION User Guide(http://www.spot-vegetation.com). All 567 S10 products of SPOT VEGETATION 1-km 10-day images were downloaded free of charge from the following URL(http://free.vgt.vito.be),over the period from April in 1998 to December in 2013, and were extracted with the VGTExtract software. All newly produced data were transformed into those with the same Albers Equal Area Conic Krassovsky projection. Because the maximum NDVI value composite(MVC)(Holben 1986)(a maximum daily NDVI value in each 10 days) minimizes atmospheric effects,scan angle effects,cloud contamination and solar zenith angle effects (Hope et al.,2003; Stowet al., 2003), all three 10-day-synthesis products in each month from April to October, were combined into monthly NDVI datasets for the best vegetation state in those months, adopting the MVC method. Although the maximum NDVI compositing procedure eliminates most cloudy pixels, some VGTS10 products contain residual cloud contamination.For every pixel, the SPOT NDVI time series dataset were further pre-processed using the Savitzky-Golay Filter to smooth NDVI with erroneous spikes due to clouds(Chen et al.,2004).
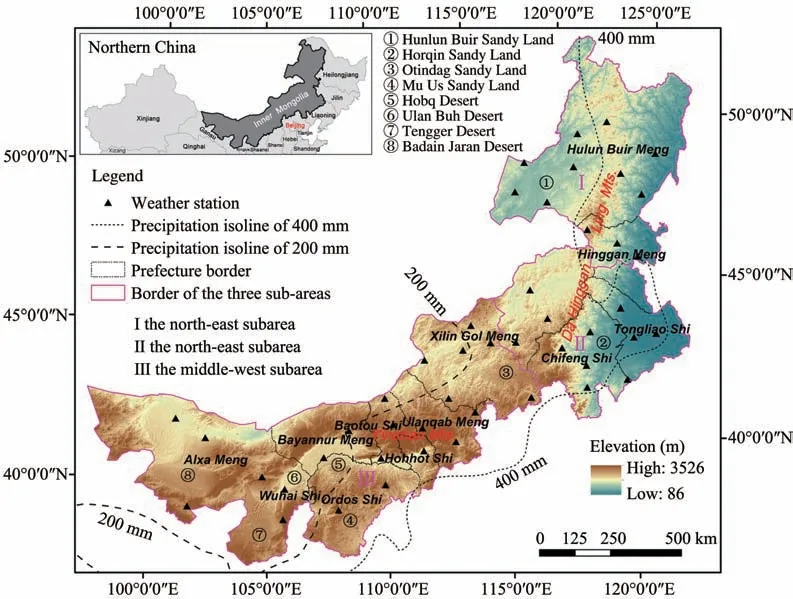
Figure 1 The location and elevation of the study area(Precipitation isoline data according to Climate Atlas of the People's Republic of China,Beijing:China Meteorological Press,2002)
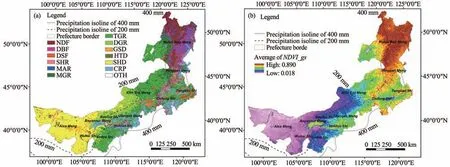
The sum and average of monthly NDVI data from April to October (Chi et al., 2016) is defined as the growing season cumulative NDVI of each year (iNDVI_gs) and the growing season NDVI of each year(NDVI_gs), respectively. Corresponding to the growing season NDVI, seasonal NDVI are defined as follows: spring NDVI is the average monthly composite NDVI of April and May(NDVI_sp);summer NDVI is the average monthly composite NDVI of June, July and August(NDVI_su);and autumn NDVI is the average monthly composite NDVI of September and October (NDVI_au). Finally, all NDVI images during the period of 1998-2013 were extracted by the mask method with the Inner Mongolia administration border.
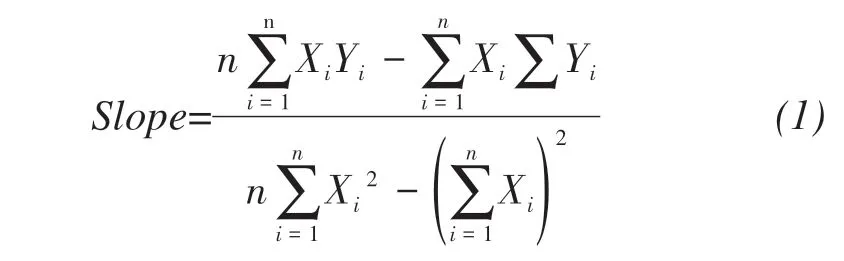
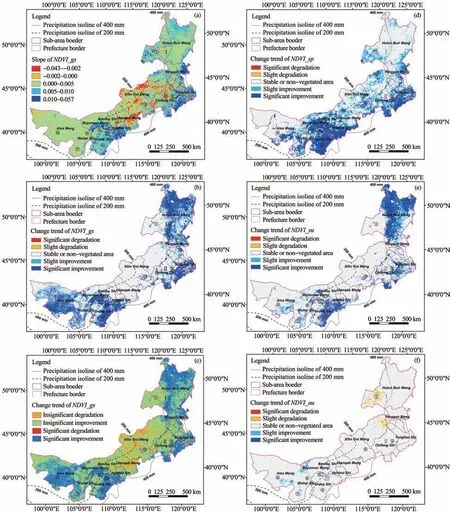
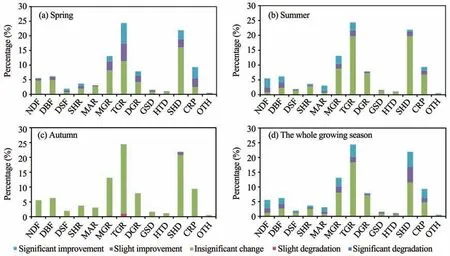
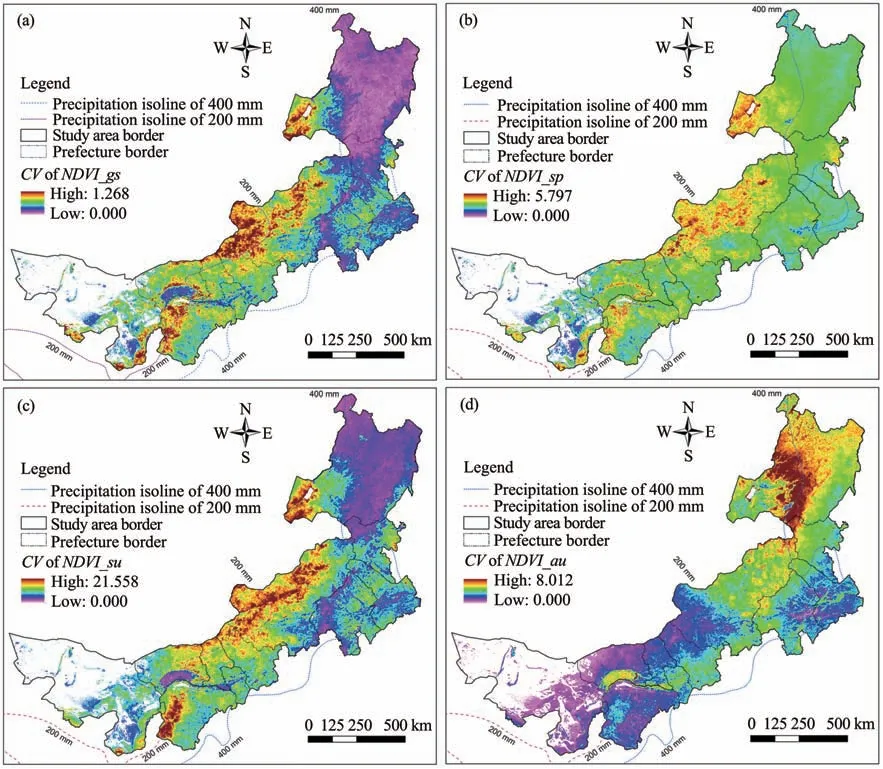
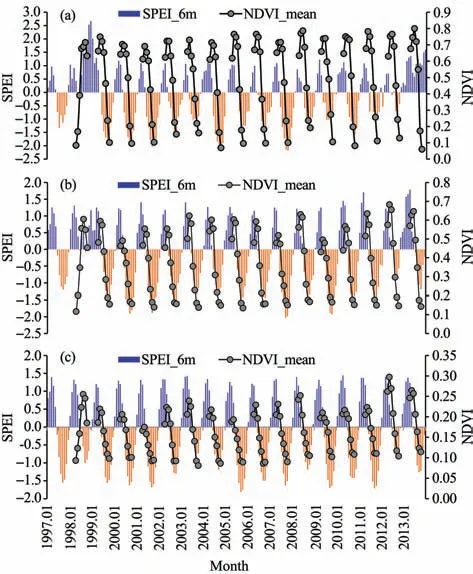
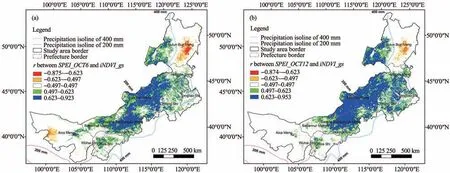
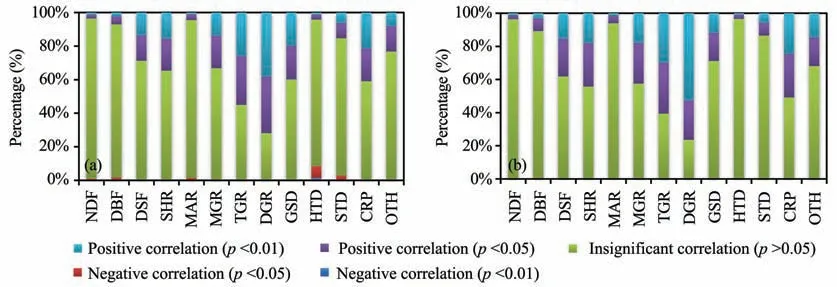
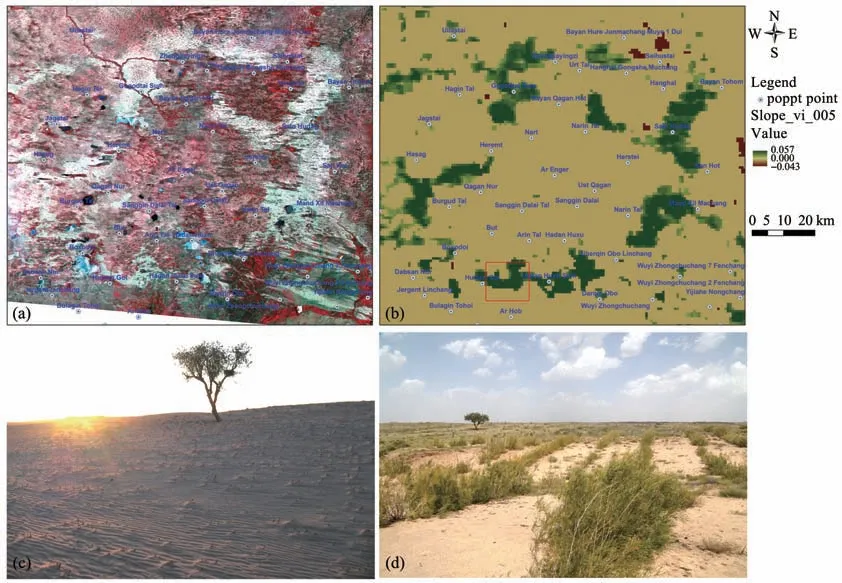
As a new drought index, the Standardized Precipitation and Evapotranspiration Index (SPEI) is particularly suited to detecting, monitoring, and exploring the consequences of global warming on drought conditions, and have good multi-time scale features (Vicente-Serrano et al., 2010), so SPEI was used as indicating drought in this paper. All monthly mean air temperature, total monthly precipitation, monthly mean relative humidity, and monthly mean wind speed dataset in the shared meteorological stations of Inner Mongolia during 1960 - 2013 were obtained from the China Meteorological Data Sharing Service System (http://cdc.cma.gov.cn/), and the total 46 stations with better quality control were selected to calculate SPEI and used for drought analysis in the whole Inner Mongolia. Fewer missing data in specific stations were replaced by linear regression estimate according to the closest series.The location and distribution of weather stations selected and several famous deserts and sandy lands in this study are plotted in Figure 1.The detailed calculation flow chart can be found in Liu et al. (2016). We chose the six-month scale SPEI on October (SPEI_OCT6, a) as the growing season drought index, and the twelve-month scale SPEI on October (SPEI_OCT12, b) as the annual drought index for considering the preceding winter precipitation effect on vegetation growth of the following growing season. Based on the Categorization of dryness/wetness grade by SPEI (Yu et al., 2014),drought is defined as when SPEI was less than -1.0,and wet was greater than 1.0. The normal period was defined as when -1.0 In addition,vegetation type data were downloaded from http://westdc.westgis.ac.cn and used as change analysis of different vegetation types. In this research,based on a linear regression analysis method (Stow et al., 2003; Chatfield, 2016), the spatial and temporal fluctuations of NDVI_gs,NDVI_sp, NDVI_su, NDVI_au, SPEI_OCT6 and SPEI_OCT12 were analyzed. The time series of each pixel was calculated to obtain the slope coefficients of the trend line. Specifically, the slope coefficients of the trend line were computed using Equation(1). where,Xiand Yiare the values of the independent variable and the dependent variable in theith year,respectively, and n is the accumulative number of years during the study period. Generally speaking, if Slope >0,the variation of the dependent variable exhibits an upward trend, whereas if Slope <0, the variation of the dependent variable exhibits a downward trend. Correlation coefficients (Pearson coefficient, r)were calculated between theiNDVI_gsseries (dependent variable) and the time series of SPEI on October at 6-month (SPEI_OCT6) and 12-month scales(SPEI_OCT12) (independent variables) from 1998 to 2013.Significance tests(p<0.05 or p<0.01)were carried out according to the threshold value comparison under the given confidence levels (α=0.05 orα=0.01).The significance of the correlation coefficients indicated a closer relationship between iNDVI_gs and drought. Sen+Mann-Kendall analysis can be widely applied for detecting trends of vegetation's change thanks to its noise immunity and without requirements of data distribution. Temporal trends in the datasets were examined by applying the Theil-Sen (TS)median slope trend analysis which is a robust trend statistical method (Theil, 1950; Sen, 1968). A Nonparametric test (Mann-Kendall significance test) was used to test the statistical significance of TS median slope value, producing z scores providing information on both the significance and direction of the trend. A positive slope (z ≥1.96) represents a significant increase and a negative slope (z ≤-1.96)indicates a significant decrease over time for 95% confidence level(Fensholt et al., 2013).This method was used as verifying the linear regression analysis method mentioned above for obtaining reliable results. Coefficient of variation (CV) is the ratio of standard deviation((σ)to mean(μ).CV of NDVI of different seasons in the growing season from 1998 to 2013 was calculated,including CV of NDVI_gs for growing season,CVofNDVI_spfor spring,CVofNDVI_sufor summer,andCVofNDVI_aufor autumn. Spatial distribution patterns of the average NDVI_gs clearly indicated that vegetation growth activity gradually decreases from northeast to southwest in the study area, except for the Horqin Sandy Land located in the southeast part (Figure 2b) where the average NDVI_gs was smaller than 0.266. Vegetation growth along the precipitation isoline of 200 mm and to the west of that was very bad, where the average NDVI_gs was between 0.178 and 0.355, excluding the Hetao Plain.This was consistent with vast deserts distribution (Figure 1), shrub desert, half shrub and dwarf half shrub desert, as well as desert grassland there (Figure 2a). It is noteworthy that vegetation growth was abnormally worse in the western Horqin Sandy Land and the whole Mu Us Sandy Land (Figure 2b),and which created mosaic distribution of vegetation patches in zonal vegetation patterns of the study area.This indicated that NDVI_gs can better reflect vegetation growth. Results show that vegetation in many sub-regions of the study area had been rehabilitated to various degrees from 1998 to 2013. Significant vegetation improvement had occurred in those sub-regions such as most of the Horqin Sandy Land, most of the eastern Ordos Plateau including the Mu Us Sandy Land, the Hetao Plain, as well as the middle-northern Da Hinggan Ling Mountains (p <0.05) (Figures 3a, 3b, 3c).There were bigger areas of significant improvement in spring than in summer in Inner Mongolian (p <0.05),and significant vegetation improvement regions were different in spring and in summer (Figures 3d, 3e).For example, vegetation improvement in the northern Da Hinggan Ling Mountains in summer was very significant(p<0.05)(Figure 3e). Figure 2 Spatial patterns of vegetation types and NDVI_gs in the study area.(needle-leaved forest(NDF),deciduous broad-leaved forest(DBF),deciduous sparse forest(DSF),shrub-land(SHR),marsh(MAR),meadow grassland(MGR),typical grassland(TGR),desert grassland(DGR),grassy shrub desert(GSD),dwarf half-tree desert(HTD),shrub desert(SHD),cropland(CRP),other vegetation types or non-vegetated areas(OTH)) Vegetation degradation was centrally distributed in the middle part of study area, i.e., Xilingol grassland close to the Sino-Mongolia border and the agro-pastoral transition zone in Ulanqab Meng, but the degradation trend is nonsignificant (p >0.05) (Figures 3b, 3c).Significant vegetation degradation area was very small,and mainly distributed around several prefecture-level cities caused by obvious urbanization(p<0.05)(Figure 3c). There was significant vegetation improvement in spring in the middle-eastern Inner Mongolia, including the four big sandy lands of Hulun Buir, Horqin, Otindag and Mu Us (Figure 3d). But, it is noteworthy that there was obvious degradation trend of vegetation in local regions in autumn, including Ujimqin grassland in the eastern Xilingol Meng and the Hulun Buir Sandy Land(p<0.05)(Figure 3f). Vegetation change trends and seasonal differences varied among different vegetation types (Figure 4).TGR, CRP and SHD areas increased significantly in spring (Figure 4a); NDF, TGR and MGR areas increased significantly in summer(Figure 4b);and SHD increased slightly, while TGR decreased slightly (Figure 4c). However, SHD, TGR, MGR, NDF and CRP statistically increased slightly or significantly in the whole growing season(Figure 4d). Generally, there were huge variations of vegetation, especially those grasslands close to the precipitation isoline of 200 mm and along the Sino-Mongolia border, such as the western Ordos Plateau, the Sonid grassland in the western Xilingol Meng, as well as the northern Xilingol grassland and the west part of Hulun Buir Sandy Land(Figures 5a, 5b, 5c), where dominated by temperate typical grassland and temperate desert grassland (Figure 2a).Vegetation variation is the smallest in the Da Hinggan Ling Mountains, the Horqin Sandy Land, and the Hetao Plains during the whole growing season (Figure 5a), where dominated by forest ecosystem and cropland ecosystem, respectively. There were huge differences of seasonal vegetation variation among forest, cropland and grassland ecosystems. Spatial patterns of vegetation variation in the whole growing season (Figure 5a) are generally similar with those in summer (Figure 5c), but obviously different with that in autumn(Figure 5d)during the period of 1998-2013 in the study area.Vegetation in the northern Da Hinggan Ling Mountains presented abnormal bigger variation in autumn (Figure 5d) but very small variation in summer (Figure 5c), while vegetation variation was always smaller in the Horqin Sandy Land, the western Otindag Sandy Land, the Mu Us Sandy Land and the eastern Alax Pleatue (Figures 5b, 5c, 5d), particularly in autumn(Figure 5d). Figure 3 Vegetation change trend in the study area.(a,vegetation growth trend in the growing season(NDVI_gs)obtained with the Linear regression analysis method;b,slope of NDVI_gs at the significance level(p<0.05);c,the Sen+Mann-Kendall analysis method at the significance level(p<0.05);d,slope of NDVI_sp at the significance level(p<0.05);e,slope of NDVI_su at the significance level(p<0.05);f,slope of NDVI_au at the significance level(p<0.05)) There were similar fluctuation patterns of SPEI_6m and NDVI_mean, and general two-month time-delay in Inner Mongolia (Figure 6a, 6b, 6c). There were obvious differences of vegetation responses to droughts among three subareas. Although fluctuation of NDVI_meanwas bigger, the obvious response relationship between vegetation and drought was not detected in the north-east part of the study area(Figure 6a). Figure 4 Change trends of different vegetation types in different growing periods Figure 5 Vegetation variation of different seasons in the growing seasons from 1998 to 2013.(a,growing season,CV of NDVI_gs;b,spring,CV of NDVI_sp;c,summer,CV of NDVI_su;d,autumn,CV of NDVI_au) However, it was very easily found that NDVI_mean were significantly small in 2000, 2007 and 2009 in the south-east part of Inner Mongolia(Figure 6b),and 2000,2001 and 2005 in the middlewest part of Inner Mongolia (Figure 6c). Extreme low NDVI_mean were in 2000 and 2009 in the south-east part of the study area, responding to continuous droughts during the period of 1999-2000 and the severe drought in 2009 (Figure 6b), while extreme low NDVI_mean were in 2001 and 2005 in the middle-west part of the study area, responding to continuous droughts during the period of 1999-2001 and the severe drought in 2005 (Figure 6c).At the same time, smaller NDVI_mean and bigger NDVI_mean were closely related to lower SPEI_6m and higher SPEI_6m in the south-east part and the middle-west part of Inner Mongolia (Figures 6b,6c),respectively. There were significant positive correlations between iNDVI_gs and SPEI_OCT6 or SPEI_OCT12 in most of middle-eastern part of Inner Mongolia(blue color,p<0.01; green color,p<0.05). Only local parts of the eastern Hunlun Buir Meng and the western Alxa Meng had significantly negative correlation (red color, p <0.01; orange color, p <0.05)(Figures 7a, 7b). Moreover, larger areas were significantly affected by SPEI_OCT12 than SPEI_OCT6(Figures 7a, 7b), about 469.3×10³km2and 451.4×10³km2(p <0.05), and about 291.9×10³km2and 226.0×10³km2(p <0.01), respectively.This indicates that drought in the previous winter and early spring seasons had a lag effect on growing-season vegetation change of the vast region of Inner Mongolia, especially in those grasslands (i.e., Hulun Buir grassland,Xilingol grassland and Ulanqab grassland) to the west of the Da Hinggan Ling Mountains and to the north of Yinshan Mountains(Figures 7a,7b). Figure 6 Responses of monthly NDVI_mean to SPEI_6m from 1997 to 2013 in different subareas.(NDVI_mean is for monthly average NDVI in a subarea during the growing season;SPEI_6m is for SPEI at 6-month time scales.The north-east subarea(a),the south-east subarea(b)and the middle-west subarea(c)) Figure 7 The correlation coefficients between SPEIs and iNDVI_gs at two different time scales.(the correlation coefficients(Pearson coefficient,r)between iNDVI_gs and SPEI_OCT6(a)and SPEI_OCT12(b),respectively.Areas with no significant correlations are depicted in white) At the two time scales of 6-month and 12-month, DGR, TGR and CRP had relative higher proportions of areas with statistical correlations between NDVI_gs and SPEI (Figures 8a, 8b).This indicates that grasslands and croplands are the most easily affected by drought in the study area, especially the DGR (desert grassland) (Figures 2a, 5c,8a,8b). Figure 8 The proportions of areas with statistical correlations between NDVI_gs of different vegetation types and SPEI_OCT6(a)and SPEI_OCT12(b) Vegetation generally changed toward rehabilitation to various degrees in the whole study area from 1998 to 2013, especially in the Mu Us Sandy Land,the Horqin Sandy Land and the northern Da Hinggan Ling Mountains. There were obvious seasonal differences of vegetation change trend among spring, summer and autumn. Research shows that soil erosion is significantly correlated with spring vegetation coverage in regions of higher wind erosion forces (Gong et al., 2014). Significant vegetation improvement in spring (Figure 3d) is very helpful for decreasing soil wind erosion and dust emission (Liu et al., 2013;Gong et al., 2014). The statistical analyses demonstrated that the number and intensity of sand dust storm (SDS) events recorded in spring during 2007 to 2016 show a decreasing trend(An et al.,2018). Vegetation degradation was centrally distributed in Xilingol grassland close to the Sino-Mongolia border and the abandoned croplands in Ulanqab Meng,but the degradation trend is non-significant. Obvious vegetation degradation in the northeastern part of Xilingol Meng and Hulun Buir Meng in autumn is probably related to recent lasting drought events (Xu et al.,2012;Liu et al.,2016). The most obvious regional vegetation variation in the belt-like distribution along those grasslands close to the precipitation isoline of 200 mm and the Sino-Mongolia border (mainly including the western part of Hulun Buir grassland and the northern part of Xilingol grassland) were seriously affected by monsoon. They mainly belong to temperate tufted-grass and dwarf-shrub desert grassland (Figure 2a). Vegetation variation in spring and summer both was very big(Figures 5b, 5c), which greatly challenge local grazing management. Huge vegetation variation combined with overgrazing seriously triggered grassland degradation or Aeolian desertification and accelerating dust storms' frequency, such as Sonid grassland (Liu et al.,2013; Kang et al., 2016), where grazing activity must be strictly optimized or prohibited. Delay grazing is worth recommending and encouraged. Vegetation growth was affected by persistent increasing drought in the last ten years in Northern China (Xu et al., 2012). Vegetation dynamic change was largely influenced by drought in Inner Mongolia (Li et al., 2018). Those areas significantly affected by drought occupy 39.75% and 41.3% at 6-month scale and at 12-month scale during the last 16 years,respectively. Some studies have argued that drought cannot be a factor explaining degradation trends, given the common resilience of semiarid vegetation communities and the general recovery of vegetation following an increase in precipitation, even after long dry periods including those recorded in past decades in the Sahel (Hickler et al., 2005; Olsson et al., 2005). Nevertheless, some studies have shown that in semiarid regions characterized by soil limitations and intense human pressure, drought intensification as a consequence of warming processes may trigger land degradation processes (Vicente-Serrano et al., 2012). Dryland ecosystems exhibit different sensitivity to drought, such as semiarid regions has larger sensitivity than arid ecosystems (Ma et al., 2015). While changes in drought severity may be an important driver of NDVI trends and land degradation processes in semiarid regions worldwide,drought did not apparently explain some of the observed changes in NDVImax.This reflects the complexity of vegetation activity processes in the world's semiarid regions, and the difficulty of defining a universal response to drought in these regions, where a number of factors (natural and anthropogenic) may also affect land degradation(Vicente-Serrano et al., 2015). Although this change trend of drought was not significant in the study area from 1997 to 2013,this period actually belong to a severe lasting drought (Xu et al., 2012), because a significant abrupt change point of drought change trend in the whole Inner Mongolia at 12-month time scale was diagnosed in late 1990s(Liuet al.,2016).To some extent, the lasting drought from 1997 to 2013 had hidden change trend of drought, but drought intensity and quantitative evaluation of the response of vegetation to drought should be given full consideration. Vegetation on those sandy lands with more shifting dunes and shrubs(i.e.,the Mu Us Sandy Land,the western Otindag Sandy Land) (Figure 2a) were not significantly related to drought at 6-month scale and at 12-month scale, while those zonal grasslands were significantly related to drought at the two time-scales(Figures 7a, 7b). For shrubs, due to root length and small leaf area, plants with high water use efficiency could continue photosynthesis and transpiration processes to maintain growth during moderate drought(Xu and Li, 2006). Research revealed vegetation in sand desert had a close relationship with longer drought time-scales(Li et al.,2018).Significant vegetation improvement in the northern Da Hinggan Ling Mountains(Figures 3c,3e)was not significantly related to SPEI_OCT6 or SPEI_OCT12 (Figures 7a, 7b),but also no obvious response relationship between vegetation and drought (Figure 6a), which might be highly related to local vegetation types (Kang et al.,2018).As Vicente-Serrano et al.(2013)suggested,the drought time-scale play a key role in determining the sensitivity of land biomes to drought, arid biomes respond to drought at short time-scales, while semiarid and sub-humid biomes at long time-scale due to different root systems. Significant vegetation improvement in some local areas might be closely related to anthropogenic implementation of ecological projects and types of sandcontrol measures, such as artificial sand-barriers, airseeding and fencing. For example, vegetation of those shifting or semi-shifting dunes in the middle-eastern Otindag Sandy Land has been improved significantly(Figures 3b,3c;Figure 9). The area of significant negative correlation between iNDVI_gs and SPEI_OCT6 or SPEI_OCT12 distributed at local areas of the eastern Hunlun Buir Meng (Figure 7b) belongs to widely distributed swamps (Figure 2a). Vegetation dynamic changes in swamps are obviously different from those in waterlimited arid ecosystems. The decreasing speed of swamp's PUE is the fastest (Xu et al., 2018). However, the area of significant negative correlation in the western Alxa Meng (Figure 7a) is closely related to vegetation largely dependent on river water supply in the Heihe River Basin. There is a prominent impact from the water supply(mainly the previous year's runoff) on vegetation in the lower basin, particularly along the river(Yin et al.,2015). Negative correlation between vegetation change and SPEI in local areas of the study area indicate that vegetation dynamic change not only was derived by drought, but also affected by other factors such as land cover types and human activity(Figure 9d). The gradient and fragmentation of vegetation patterns were very obvious in Inner Mongolia. Vegetation in most places of Inner Mongolia of northern China was rehabilitated to various degrees from 1998 to 2013. Significant vegetation improvement had occurred in regions such as most of the Horqin Sandy Land, the eastern Ordos Plateau, the Hetao Plain, as well as the middle-northern Da Hinggan Ling Mountains. Vegetation change trends and seasonal differences varied among different vegetation types. Vegetation improvement in spring was significant in most of the study area, which is helpful for reducing local wind erosion and dust emission. Vegetation degradation was centrally distributed in Xilingol grassland close to the Sino-Mongolia border and abandoned croplands in Ulanqab Meng, but the degradation is nonsignificant. The biggest vegetation variation in the growing season was mainly belt-like distribution along those grasslands close to the precipitation isoline of 200 mm and the Sino-Mongolia border, but also vegetation variation in summer and autumn exist obvious spatial differences,which was related to vegetation types. Drought largely influenced vegetation change of growing season in Inner Mongolia, except for forests of the eastern Hunlun Buir Meng and deserts or gobi deserts of the western Alxa Meng. Desert grassland was the most easily affected by drought in the study area. Moreover, drought in the previous winter and early spring seasons had a lag effect on growing-season vegetation. Human activity played a very important role in improving local vegetation. Vegetation improvement under general drought climate conditions indicated implementation of the various ecological projects with respective effects. However, grazing activity must be very careful and strictly optimized or even prohibited in local areas, avoiding combined effects of drought and improper human activity on regional environments, especially in those grasslands with bigger vegetation variation. Figure 9 Vegetation improvement in the middle-eastern Otindag sandy land during the last decade.(a,TM composite images of band 4,3,2 on July 10,2000;b,slope of NDVI_gs from 1998 to 2013(p<0.05);c,severe desertification stage(photo taken on May 12th,2004);d,vegetation restoration stage under artificial plantation(photo taken on August 18,2015 at the same site,located in the red rectangle in Figure 9b) Acknowledgments: This work was supported by the Project of National Key Research and Development Program of China(Grant number 2016YFC0500902),the National Natural Science Foundation of China (Grant number 40801003) and the National Basic Research Program of China (Grant number 2009CB421308). We thank anonymous reviewers for their helpful comments.2.3 Linear regression analysis
2.4 Sen+Mann-Kendall analysis
2.5 Coefficient of variation
3 Results
3.1 Temporal and spatial change trends of vegetation
3.2 Temporal and spatial difference of vegetation variation
3.3 Response of vegetation to drought
4 Discussion
4.1 Temporal and spatial characteristics of vegetation change
4.2 Spatial heterogeneity of vegetation response to drought
5 Conclusions
 Sciences in Cold and Arid Regions2019年6期
- Sciences in Cold and Arid Regions的其它文章
- Spatiotemporal variations in moisture conditions across Monsoon Asia during the last 500 years
- An evaluation of soil moisture from AMSR-E over source area of the Yellow River,China
- Characteristics of climate and melt runoff in the Koxkar Glacier River Basin,south slope of the Tianshan Mountains,Northwest China
- Definition of failure criterion for frozen soil under directional shear-stress path
- Editors-in-Chief Guodong Cheng and Ximing Cai
- Relationship between ponding and topographic factors along the China-Russia Crude Oil Pipeline in permafrost regions