
Characteristics of climate and melt runoff in the Koxkar Glacier River Basin,south slope of the Tianshan Mountains,Northwest China
2019-06-11 03:05:26MinXuHaiDongHanShiChangKangHuaTao
Min Xu,HaiDong Han,ShiChang Kang,Hua Tao
1. State Key Laboratory of Cryospheric Science, Northwest Institute of Eco-Environment and Resources, Chinese Academy of Sciences,Lanzhou,Gansu 730000,China
2. Division of Hydrology Water-Land Resources in Cold and Arid Regions, Northwest Institute of Eco-Environment and Resources,Chinese Academy of Science,Lanzhou,Gansu 730000,China
3.Northwest Institute of Eco-Environment and Resources,Chinese Academy of Sciences,Lanzhou,Gansu 730000,China
ABSTRACT Hydrology of the high glacierized region in the Tianshan Mountains is an important water resource for arid and semiarid areas of China, even Central Asia. The hydrological process is complex to understand, due to the high variability in climate and the lack of hydrometeorological data.Based on field observations,the present study analyzes the meteorological and hydrological characteristics of the Koxkar Glacier River Basin during 2008-2011;and the factors influencing climate impact on glacier hydrology are discussed. The results show that precipitation at the terminus of the glacier was 426.2 mm,471.8 mm,624.9 mm,and 532 mm in 2008,2009,2010,and 2011,respectively.Discharge increases starting in May,reaches its highest value in July and August, and then starts to decrease. The mean annual discharge was 118.23×10⁶ m3 during the four years observed, with 87.0% occurring in the ablation season (May-September). During the study period,the runoff in August accounted for 29%of total streamflow,followed by July(22%)and June(14%).The runoff exhibited obviously high interannual variability from April to September, induced by drastic changes in climate factors. Discharge autocorrelations are very high for all the years. The climate factors show different influences on discharge. The highest correlation R between daily temperature and discharge was for a time lag of 2-3 days on the Koxkar Glacier(0.66-0.76).The daily depth of runoff to daily temperature and daily water vapor pressure had an R2 value of 0.56 and 0.69,respectively,which could be described by an exponential function.A closer relationship is found between runoff and either temperature or water vapor pressure on a monthly scale;the R2 values are 0.65 and 0.78,respectively.The study helps us to understand the mechanisms of the hydrological-meteorological system of typical regional glaciers and to provide a reference for glacier-runoff simulations and water-resource management.
Keywords:melt runoff;Koxkar Glacier;hydrometeorological;observation;relationship
1 Introduction
Glaciers concentrated in mountain regions are important freshwater resources in arid and semiarid regions like Central Asia; they have significant ecological, environmental, and economic impacts and maintain the functions of human social development (Jansson et al., 2003; Xu et al., 2017a). Global warming has resulted in a loss of more than half of the glaciers in Asia since 1900, which obviously increased runoff and total surface-water resources in the inland watershed(Masuda et al.,2001;David et al.,2004;Chen et al., 2015; Xu et al., 2017b).The Tianshan Mountains,called the "Water Tower of Asia" are one of the main mountain ranges in Central Asia (Shen, 2009). The total number of glaciers in the Tianshan Mountains of China is 7,934;the area of the glaciers is 7,179.77 km2;and the total volume of the glaciers is 707.95±45.05 km3(Liu et al., 2006). Meltwater of glaciers originating in the Tianshan Mountains accounted for about 25%-55% of the total runoff downstream (Yang, 1991;Wang et al., 2015). Climate change has affected the glacial hydrological process and its water cycle.Therefore, it is very important to study the changes of meltwater in inland rivers.
Previous studies focused on mass balance, runoff,area, and terminus changes in the Tianshan Mountains(Kang et al., 1997; Jing et al., 2006; Haeberli et al.,2007; Li et al., 2007; Narama and Kaab, 2010; Han etal., 2012). The general characteristics of meteorological elements and runoff for glaciers with complex morphology in the Tianshan Mountains have been partially recognized, based on short- or mid-term observations on specific glaciers (Han et al., 2005, 2009). However,most of the observations and research about meteorological and hydrological data were located on the north slope of the Tianshan Mountains (Gao et al., 2013; Sun et al., 2015), with few studies done on the south slope in recent years.Proportionately,hydrology in mountainous areas, especially glacial hydrology, is lagging behind, due to the greater difficulty in data collection at higher altitudes on the south slope of the Tianshan Mountains.Meltwater originating from the Koxkar Glacier on the south slope of the Tianshan Mountains is the most important supply for the Akesu River.In the lower reaches of the Akesu River Basin, more than 2.52 million people and 1.33 million acres of irrigated agricultural land depend on runoff coming from the high mountains, which is necessary for the development and efficient management of water resources, including flood forecasting, reservoir operation, and design of hydraulic structures. By contrast, meteorological elements in high mountains are one of the main components of glacial climatology, based on the observed hydrological and meteorological data; this will not only help to reveal and understand the dynamic changes in the microclimate of glaciers but also help us to calibrate the parameters in the hydrological model and correctly evaluate the changes of glacial runoff in the past and future under the changing climate(Hanet al.,2010;Hanet al.,2015;Xu et al., 2017). In a word, it is imperative to observe the hydrological process in high-altitude glaciers; this is not only the key hydrological research issue in mountain regions but also important for determining the hydrologic parameters in glacial runoff simulations.
In the research described in this paper, we tried to analyze the characteristics of observed daily meteorological data (precipitation, temperature, wind speed,net radiation, relative humidity, and water vapor pressure)and daily runoff in the Koxkar Glacier River Basin on the south slope of the Tianshan Mountains from 2008 to 2011,including the seasonal distribution of runoff and climate elements, runoff and climate variability on annual and seasonal scales,and the relationships between glacial discharge and climate. The aim is to better understand the mechanisms of the hydrological-meteorological system of typical regional glaciers on a daily timescale and to provide a reference for glacier-runoff simulations and water-resource management.
2 Study area
The Koxkar Glacier is located on the south slope of Mount Tumur of the Western Tianshan Mountains;it is one of the source regions of the Akesu River(Figure 1a). The area of the glacier is 89.6 km2, and its elevation is between 3,020 and 6,342 m a.s.l..The length of the Koxkar Glacier is 25.1 km, and the ice volume is 15.79 km3(Figure 1b).Annual precipitation is about 533 mm at the end of the glacier, which is supplied mainly by moisture from the Atlantic and Arctic.The precipitation that occurs from June to August accounts for 50% of the annual precipitation;70% of the precipitation occurs from May to September and about 30% during the cold season. Annual precipitation near the snow line is between 750 and 850 mm (Xie et al., 2004; Zhang et al., 2005). The gradients of temperature and precipitation are 0.66 °C per 100 m and 4.6% per 100 m, respectively (Xu etal., 2017). The average annual precipitation is less than 90 mm on the piedmont plain of the south slope of the Tianshan Mountains; meltwater of glaciers and precipitation in mountain regions are the main sources of water resource for the piedmont river.There is one automatic weather station (AWS) and one hydrological station located on the termius of the glacier(2,974 m a.s.l.)(Figures 1c,1d).
3 Data collection and methodology
3.1 Hydrological and meteorological date collection
Hydrological observation sites and stream waterlevel gauges were installed about 800 m downstream of the terminus of the glacier (41.71°N, 80.17°E),with an elevation of 2,974 m a.s.l..Meltwater flows in a single channel, which controls the main meltwater runoff of the Koxkar Glacier (Figure 1d). There is a bridge across the river channel to facilitate the measurement of flow velocity (Figure 1d); velocity of flow was measured manually by a hydrodynamometer(Model LS25-1, Huazheng Hydrometric Instrument Ltd.). The river channel was divided into six to nine segments (depending on the channel width in different seasons), and flow velocity was measured at each channel.A manual river gauge was placed in the river to read the water level. Coupled with the mean flow velocity and the cross-section area of each segment,the channel discharge at a specific water level can be obtained. Water stage was measured by an automatic HOBO Water Level Logger(Onset,Bourne,U.S.).After taking measures of the discharge at a range of water levels, particularly the maximum and minimum water levels in a year, a stage-discharge relationship was developed for each measurement years; and the discharge was calculated from 2008 to 2011.
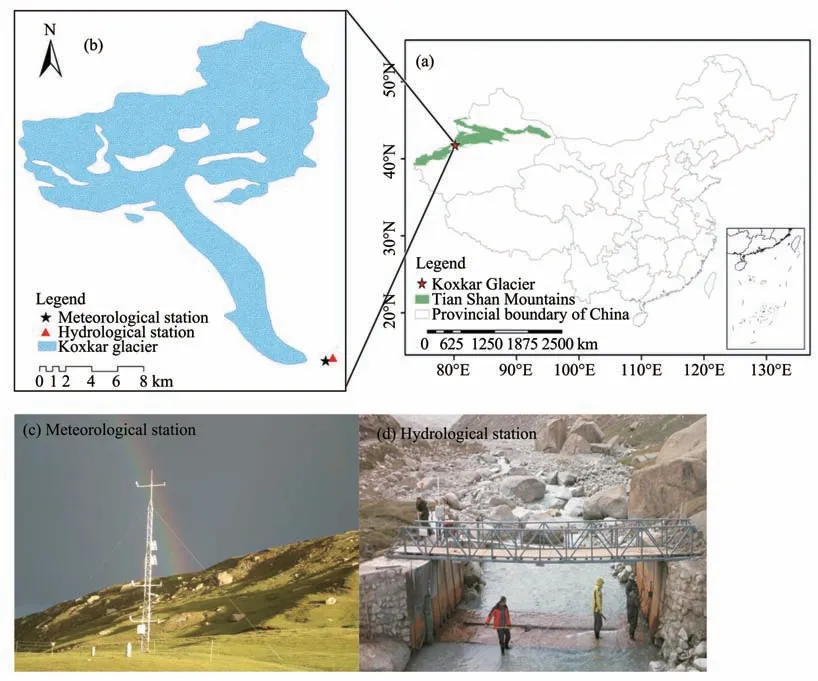
Figure 1 Location of the Koxkar Glacier(KG)(a);meteorological and hydrological stations at the end of KG(b),(c),(d)
The automatic weather station (AWS) was established on the grassland for recording various parameters (Figure 1c). It is located about 100 m southward from the hydrological gauging site(41.70°N,80.17°E).The elevation of the AWS is 3,007 m a.s.l..The AWS monitors several environmental variables, including temperature, solar radiation, wind speed, relative humidity, water vapor pressure, soil moisture, and air pressure.Precipitation was monitored by both a manual rain gauge and an automatic snow/rain gauge(tipping-bucket rainfall gauge).
3.2 Methodology
To obtain the variations in the meteorological variables, the coefficient of variability (Cv) was analyzed;it is calculated as follow:
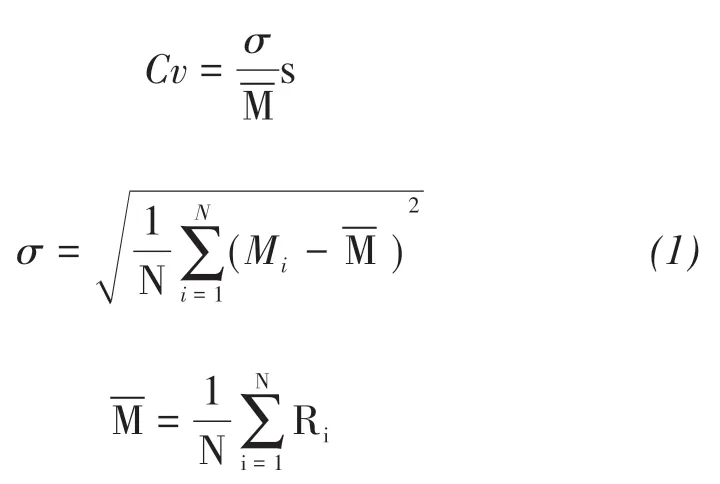
where σ is the standard deviation,is the average value, Miis the observed data, and N is the number of data. Cv reflects the discrete of the overall series; if it is higher, it indicates that the change is drastic. If Cv is smaller,then the change is small.
For determining the characteristics of meltwater and climate in the discharge, discharge autocorrelations (ACF), and cross-correlations (CCF) between discharge and daily climatic variables (temperature and water vapor pressure) at various lag intervals have been analyzed in order to measure the delay in meltwater runoff. The lag period with maximum correlation represents the mean time for all meltwaters to pass through the glacier (Srivastavaet al., 2014). Relationships between the discharge and daily climatic variables (temperature, precipitation, and water vapor pressure) have been obtained in order to measure the runoff of meltwater and to establish mathematical relationships between the discharge and climate variables,which are useful for prediction of discharge.
4 Results and analysis
4.1 Meteorological analysis
Meteorological observations are important for studies of hydrological process, as they are the basic input data driving different hydrological models. The Koxkar Glacier is the only glacier monitored systematically in the high-altitude region of the south slope of the Tianshan Mountains. The spatial distributions of climate variables(precipitation,temperature,net radiation, wind speed, relative humidity, and water vapor pressure)are very different from those in the plain areas; they are induced by the complex topography in the mountains (Immerzeel et al., 2014). It is essential to obtain precise,reliable meteorological data.
Precipitation is affected by the westerly belt and local circulation. During the ablation season (May 1 to September 30) from 2008 to 2011 (Figures 2a-2d), the daily maximum precipitation over the Koxkar Glacier was 40.9 mm,with an average mean daily precipitation of 2.7 mm. The precipitation occurring in May to September accounts for 79% of the annual precipitation.Daily variations in temperature over the ablation season is also important; the daily maximum, minimum, and mean temperatures for May to September were 18.2,-1.5, and 10.3 °C, respectively. Net radiation is related to the height of the sun, the amount of cloud cover, the physical state of the atmosphere, and the surface; it is an indicator of the net income of the underlying surface,which is one of the main factors in climate formation (Hopkinsonet al., 2010; Suet al., 2011). The net radiation was 17.9-29.4 MJ/(m2·d) during the ablation season on KG (data missing in 2010); the mean daily value was 25.0 MJ/(m2·d), which is lower than that for the Laohugou No. 12 Glacier (Su et al., 2011). Due to the strongest total radiation, high temperature, the air's content of water vapor, and lower albedo, the maximum value of net radiation usually occurred in August;but the differences are not obvious(Table 1).
Wind plays a key role in the transport of moisture,formation of clouds,and occurrence of precipitation,as well as in the melting of glaciers.In the study of mountain glaciers, wind also plays an important role in the changes of glacier surface, redistribution, and transfer.The daily mean wind speed was 2.8 m/s;the maximum and minimum values were 37.4 m/s and 1.0 m/s, respectively(Figure 2d).The mean daily relative humidity was 58.1%, and the maximum value was 92.9%;these values are close to those for Urumqi Glacier No.1 and Laohugou No. 12 Glacier (Wanget al., 2012;Sun et al.,2013).Water vapor pressure plays an important role in weather and climate,with the state of water vapor pressure opposite to the relative humidity on the Koxkar Glacier(Figures 2e-2f).The water vapor pressure changed obviously during the ablation season on the Koxkar Glacier; the daily range was from 0.23 kPa to 1.0 kPa,with a mean value of 0.65 kPa.
The maximum, minimum, and mean daily values of meteorological data for each yearly ablation season are showed in Tables 1 and 2. Statistical characteristics of the meteorological data show their distributions and variability.Figure 3 presents the plot of variability reflected by the coefficient of variations (Cv)during four different ablation seasons (2008-2011).The Cv of precipitation was between 1.6 and 2.6 in different years; the mean value was 2.0 during 2008-2011, which is obviously higher than values for other meteorological elements, indicating that precipitation was concentrated and unstable at the station. The Cv of net radiation is lower than that for the other meteorological elements.
4.2 Hydrological analysis
Estimation of discharge is fundamental for water-resource management at the watershed scale. However,streamflow gauges are not always available at remote sites in glacierized mountain regions, especially in continuous spans. Based on component analysis of runoff,the melting of the glacier and snow are the main sources of streamflow on the Koxkar Glacier (Xie et al.,2004). Rain-induced water flow accounts for only about 6.8%of the total glacial runoff(Han et al.,2009);thus it is neglected in the distribution of streamflow analysis. To understand characteristics of streamflow,total water yield, and distribution of melt runoff from a glacierized mountain region is of practical importance and necessary. Streamflow is maintained at a low level in the cold season (April-October); we show only the details from May to September. The daily streamflow during the ablation season has large variability within a year and between years (Table 2, Figures 4a-4d). The discharge starts increasing in May,reaches a peak in July and August, and then starts decreasing. The highflow events were mainly concentrated from May to September, especially in July and August (Figure 5).The respective dates of peak discharge were found in August for 2008 for the ablation, while July was the peak-discharge month during 2009-2011(Table 2).
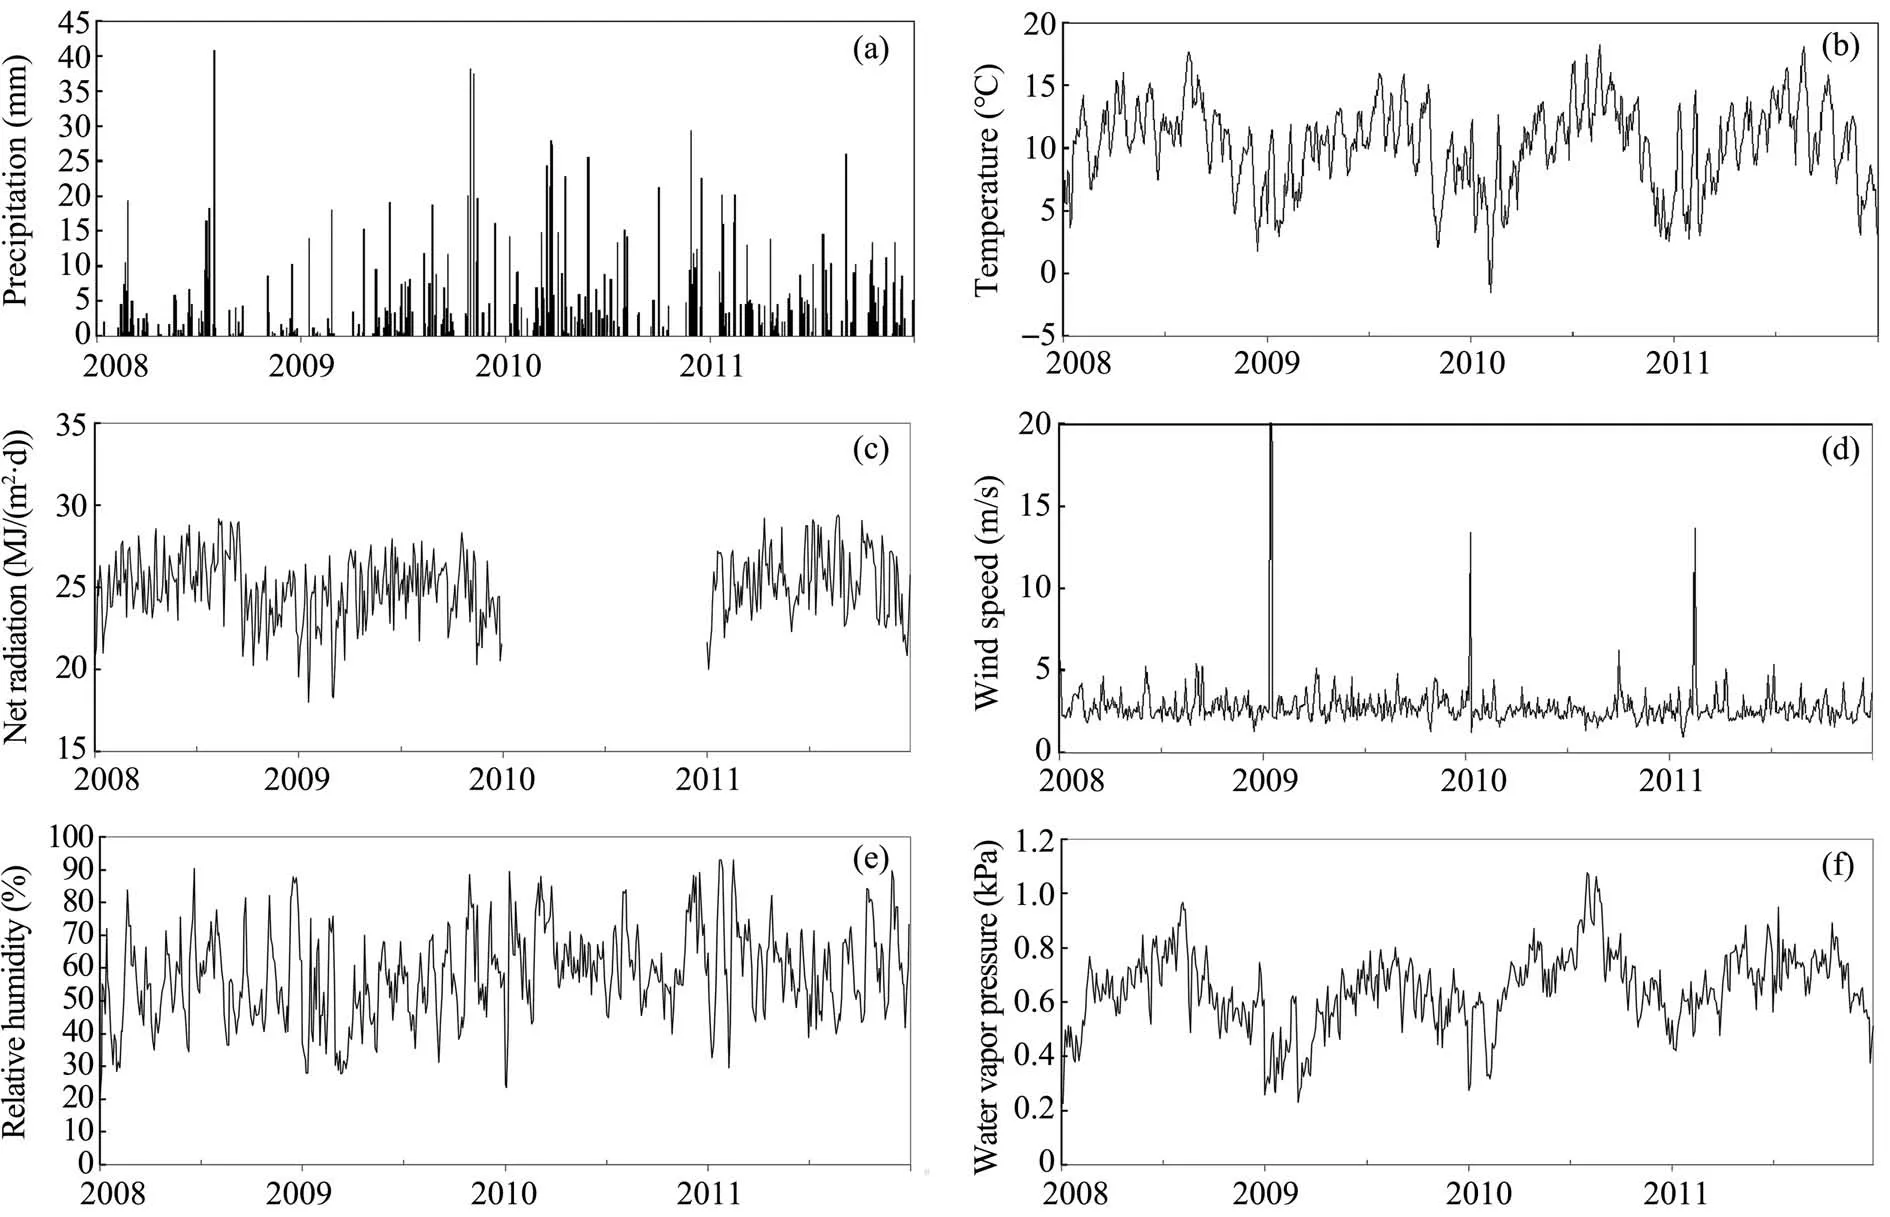
Figure 2 Daily variations of precipitation(a),temperature(b),total solar radiation(c),wind speed(d),relative humidity(e),and water vapor pressure(f),from 2008 to 2011 on KG
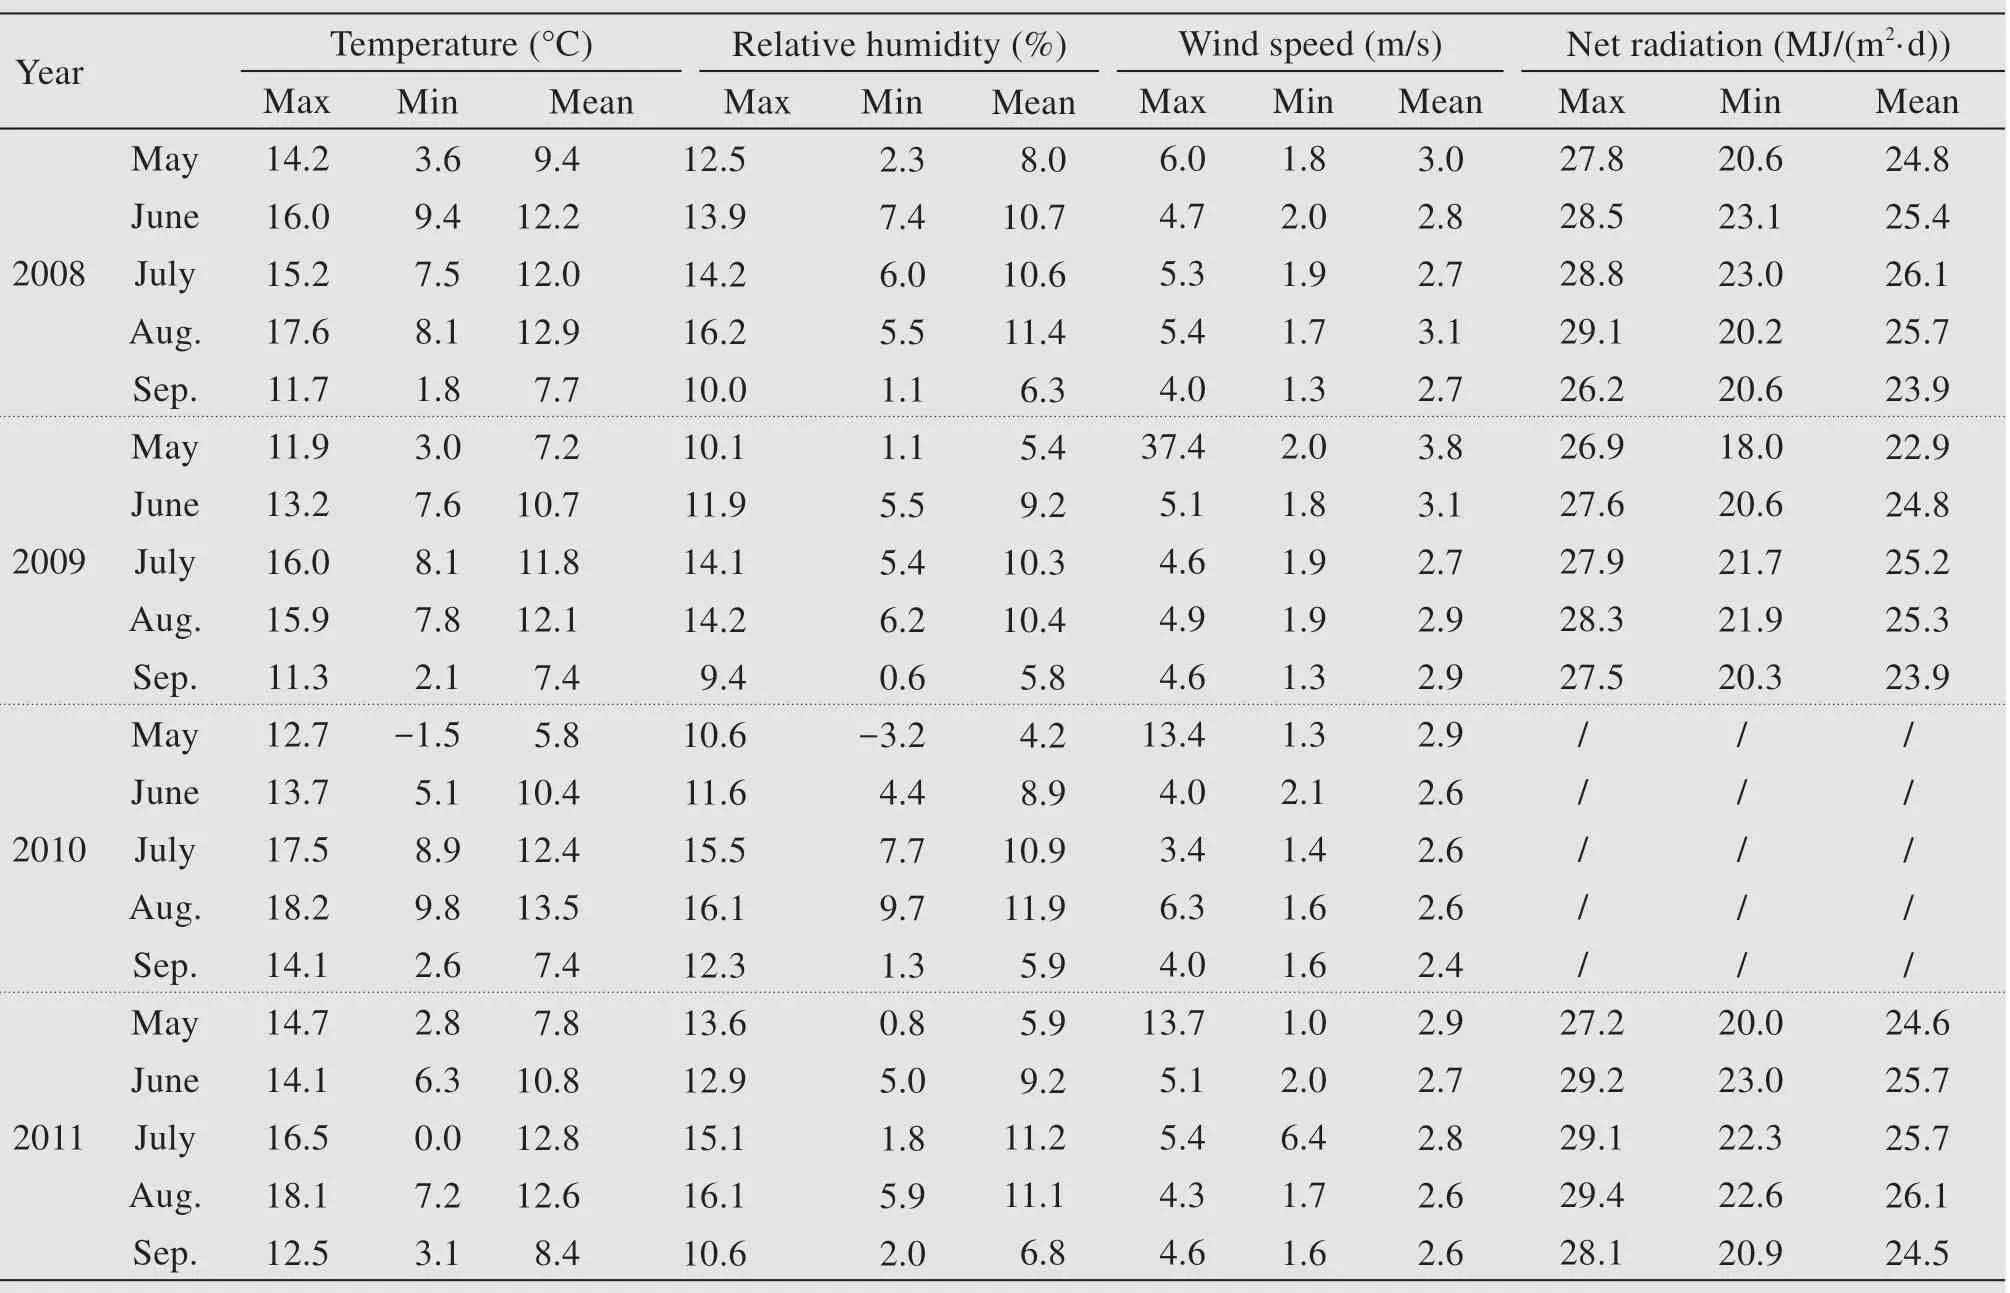
Table 1 Characteristics of daily temperature,relative humidity,wind speed,and total solar radiation during the period of ablation(May to September)from 2008 to 2011
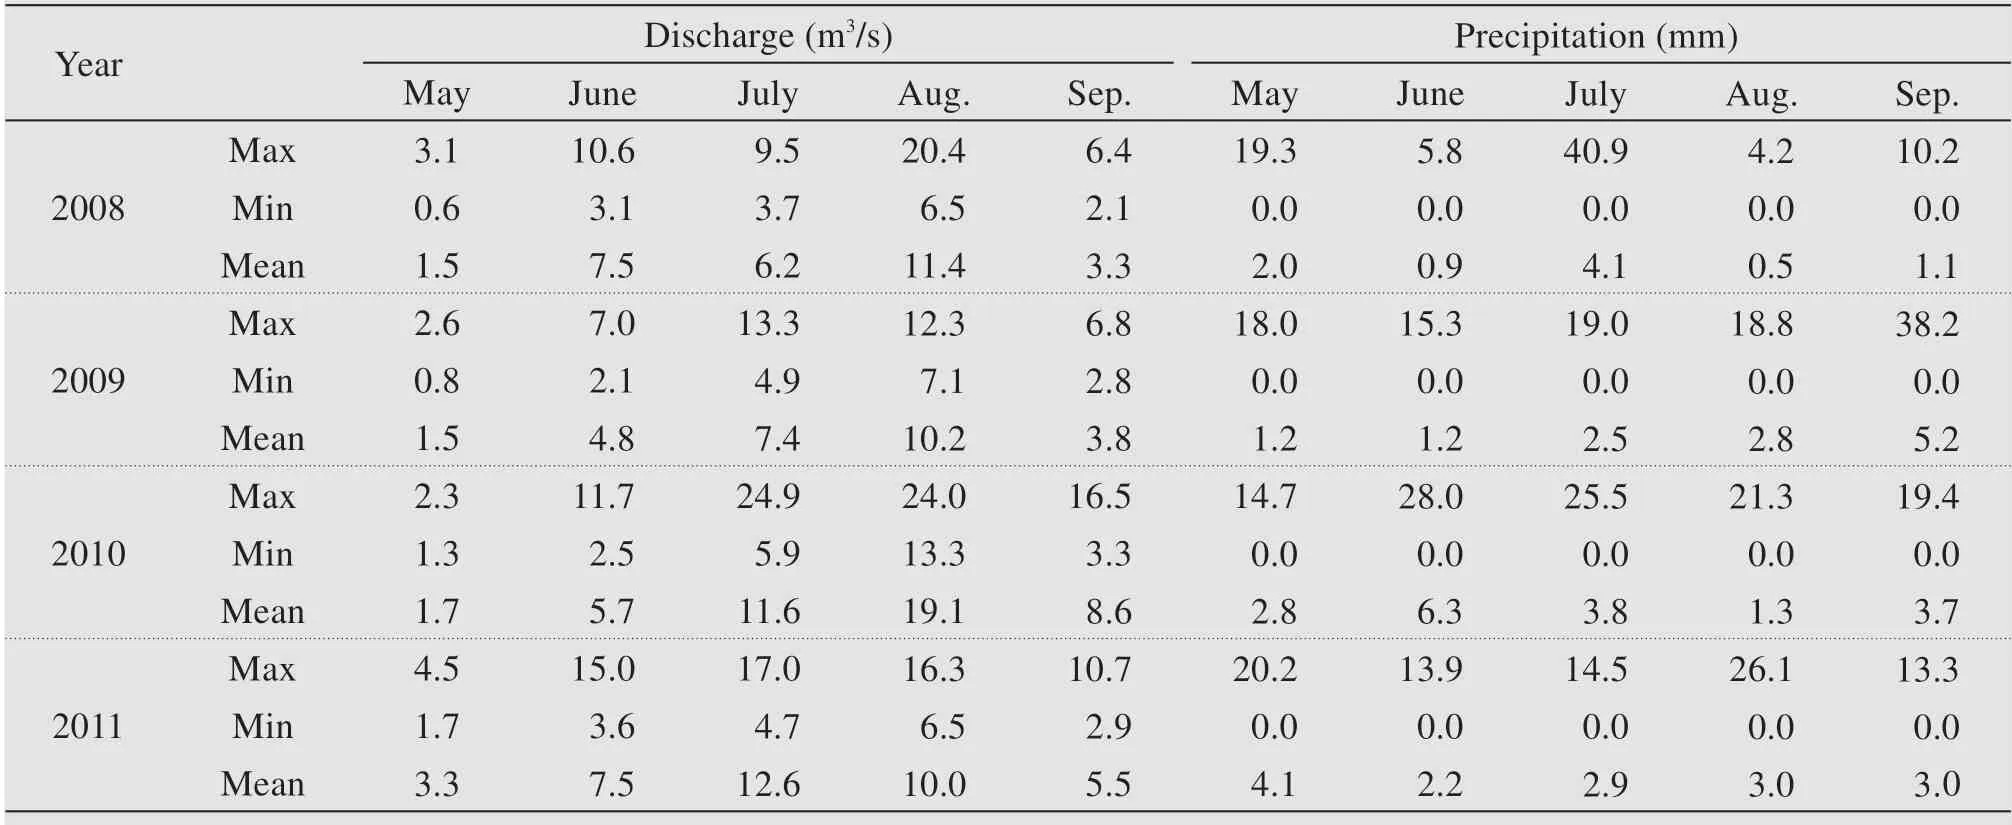
Table 2 Characteristics of daily discharge and precipitation during the period of ablation(May to September)from 2008 to 2011
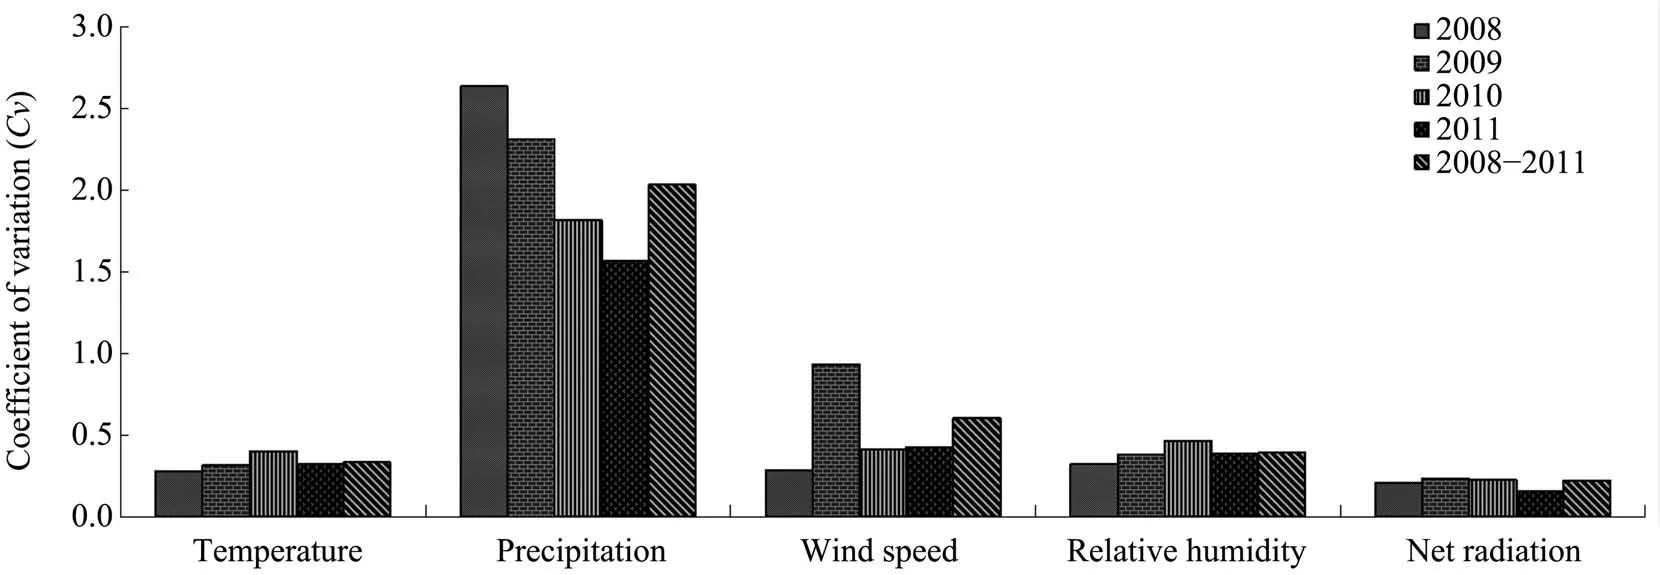
Figure 3 Coefficient variation(Cv)of precipitation,temperature,wind speed,relative humidity,and total solar radiation from 2008 to 2011 on KG
The mean monthly water yield and depth of runoff from January to December were calculated using collected flow records for all study years (Table 3 and Table 4). Total streamflow recorded for 2008-2011 was 96.05×10⁶m3, 97.15×10⁶m3, 149.59×10⁶m3, and 130.11×10⁶m3, respectively; the depth of runoff was 818.5 mm, 831.0 mm, 1,279.5 mm, and 1,114.9 mm,respectively, on the watershed scale. It shows that the annual mean discharge of the Koxkar Glacier is 118.23×10⁶m3during the four years observed, out of which 87.0% was occurred in the ablation season(May-September). During the study period, the runoff in August accounts for 29% of the total streamflow, followed by July (22%) and June (14%). The proportions of July and August runoff on the Koxkar Glacier are close to those on the Gangotri Glacier(56.4%) in the central Himalayas, as well as those on Niyaqu and Qugaqie (52% and 53%, respectively) on the southern Tibetan Plateau (Srivastavaet al., 2014;Gao et al., 2015), but lower than that on the Dunagiri Glacier,which receives 73%of the total runoff in July and August(Singhet al.,2006).
4.3 Variability of glacial runoff
The total glacial runoff for 2008-2011 had a certain pattern of fluctuation on the Koxkar Glacier. To understand interannual variability of the glacial runoff, the variation of monthly discharge from year to year was calculated using monthly flow data from the study period (Figure 6).The coefficient of variation (Cv) was calculated to analyze the variability of discharge (Equation(1)). The value ofCvin January, February, and March was small, between 0.14 and 0.19, indicating a stable baseflow from the glacier in the cold season.From October to December, although the average temperature was below 0 °C, the Cv was higher than in January, February, and March, ranging from 0.23 to 0.25. It indicated that the runoff still consisted of snow melt and glacial melt. The runoff exhibited obviously high interannual variability from April to September. In April and September,the Cv showed very high values,which were induced by drastic changes of climate factors from the cold season to the warm season. During April to September,the Cv fluctuated the least in June and August.
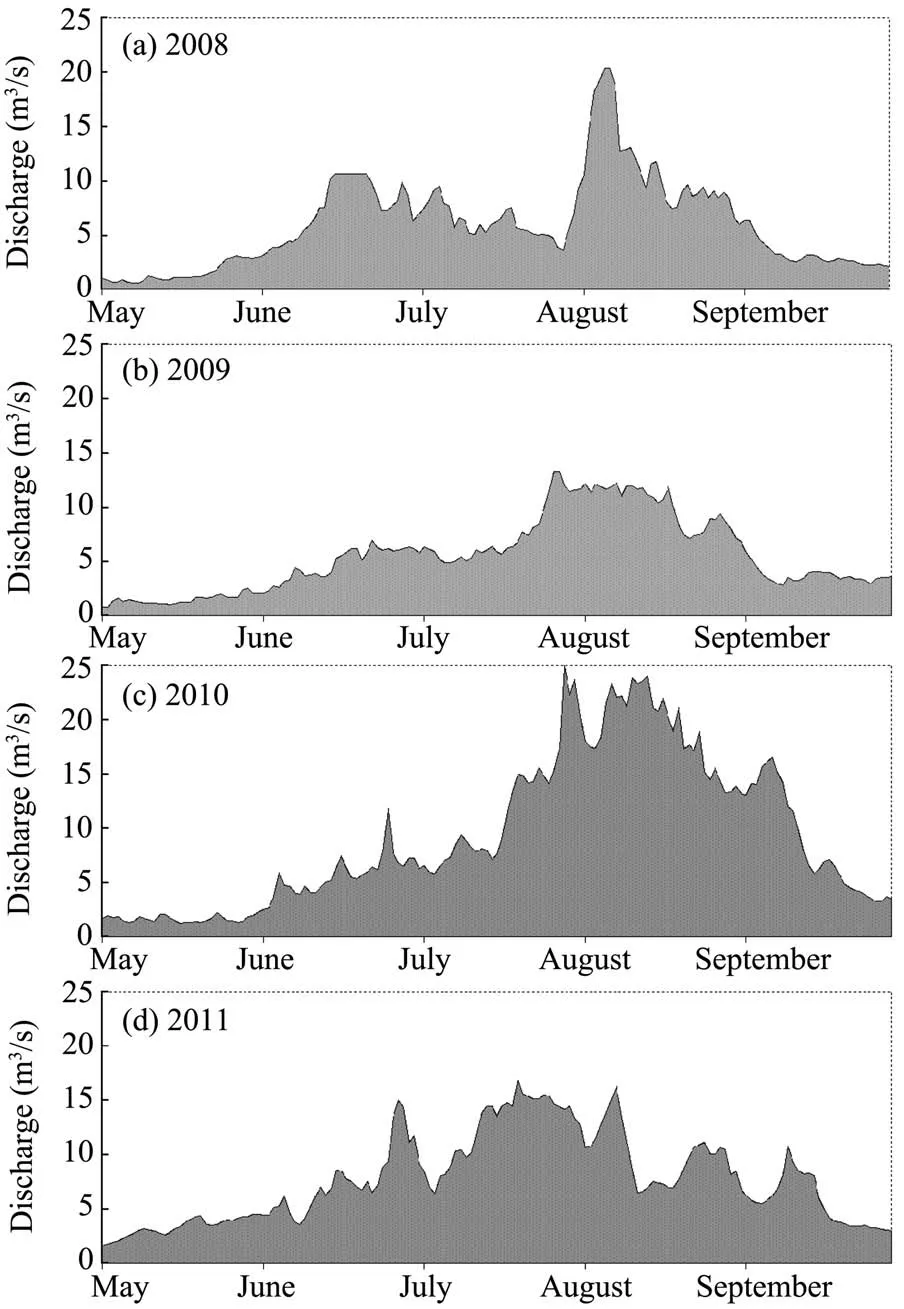
Figure 4 Distribution of daily discharge during the period of ablation(May to September)from 2008 to 2011 on KG
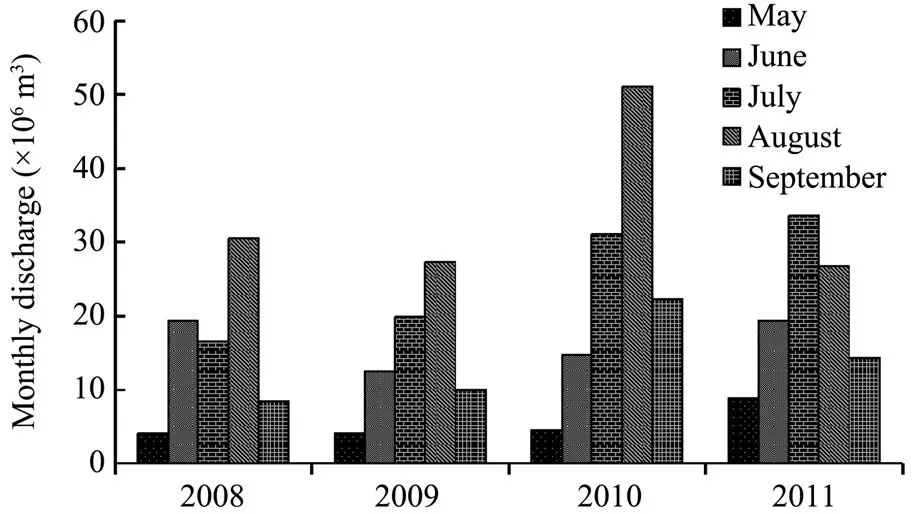
Figure 5 Monthly distribution of discharge volume during the period of ablation(May to September)from 2008 to 2011 on KG
The seasonality of temperature has a major influence on the runoff on the Koxkar Glacier, but the precipitation is also the main source of supply for glaciers.We calculated the monthly Cv of runoff,temperature, and precipitation using the daily data from the different years (Figure 7). The Cv is lower in 2009 during the ablation season than for other years, which was mainly because the overall temperature was also lower (Figure 2b). The average temperature is below 0 °C from October to April; the temperature variability in the cold season is not presented, only the results of May, June, July, August, and September, in which the daily mean temperatures are positive.As shown in Figure 7,the variability in temperature displayed similar patterns in different years;the Cv of temperature is high in May and September, dropping gradually from May to July and then increasing. The variability of temperature induced dramatic changes of runoff. The first stage of the maximum value of discharge usually occurred in April, depending on the variation of precipitation and temperature. There was another peak in September,at the end of the melt season.The variability of precipitation was obviously high, demonstrating that the temporal distribution of precipitation was not stable,even to a slight degree.The discharge variability usually maintains at a low level from December to the next March, due to the stable groundwater supply to the streamflow.

Table 3 Mean monthly volume of discharge from 2008 to 2011 on KG(unit:×106 m3)
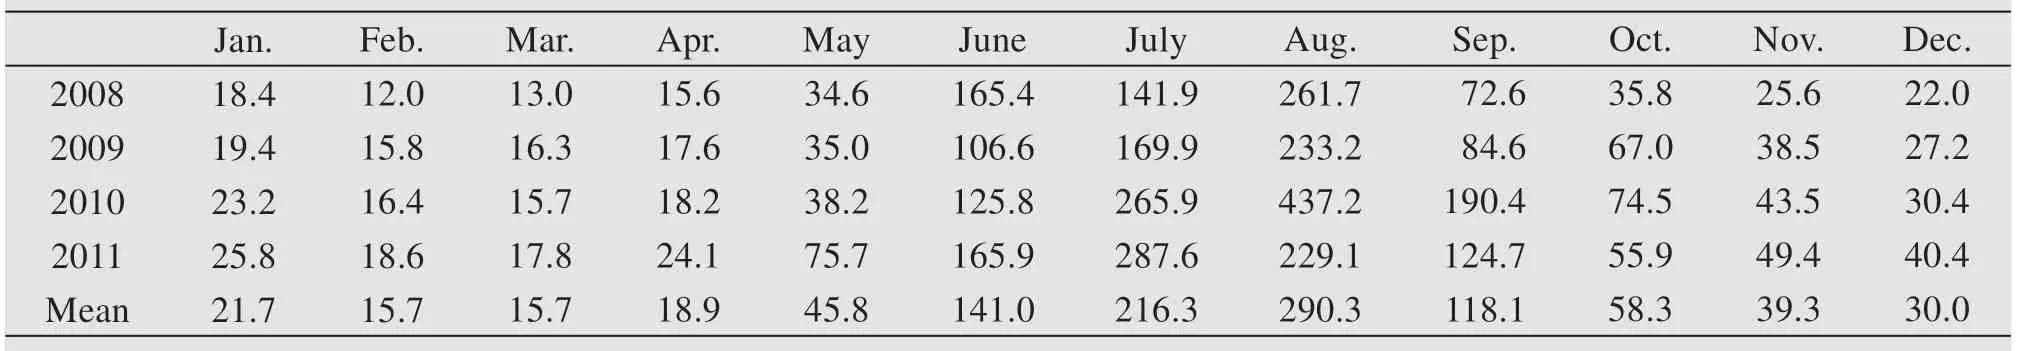
Table 4 Mean monthly depth of runoff from 2008 to 2011 on KG(unit:mm)

Figure 6 Interannual variability of monthly discharge,as reflected by Cv from 2008 to 2011 on KG
5 Discussion
5.1 Cross-correlation between discharge and climate
Figure 8 shows the ACF of daily discharge in different ablation periods,as well as for the combined series of four seasons during 2008-2010. The comparison of discharge autocorrelations for different years indicates that discharge autocorrelations are very high for all the years.The comparing of discharge autocorrelation with time lag for different years shows a decrease in autocorrelation with an increase in time lag(Di-1,Di-2,Di-3,…,Di-n).It is found that discharge autocorrelation varied from 0.73 to 0.98 for the time lag of 0-5 days in different years; but the range is from 0.86 to 0.98, which is even higher considering the entire study period (2008-2011). The results show that the discharge for a specific day is closely dependent on the discharge of the previous day. Therefore, if we want to predicate future discharge from glacierized basins of this kind,the discharge of the previous day becomes an important factor.
The cross-correlation (CCF) between daily discharge and daily air temperature with time lags(Tn+1, ... , Ti+2, Ti+1, Ti, Ti-1, Ti-2, …, Tn-1) was analyzed;plots of the discharge - temperature correlation for each ablation season and the combined data series(2008-2011) are given in Figure 9. The value of the discharge-temperature correlation varied from 0.46 to 0.67 for a time lag of 0-5 days.As can be seen,the relationship improves when the date of temperature was in advance;the highest correlation is in time lags of 2-3 days on the Koxkar Glacier (0.66 - 0.76), but it dropped for a time lag beyond 3 days. This finding means that the particular daily discharge can be predicted by the previous daily temperature to a certain degree.
The cross-correlation (CCF) between discharge and water vapor pressure with time lags of 0-5 days(Vn+1,...,Vi+2,Vi+1,Vi,Vi-1,Vi-2,…,Vn-1)for different ablation seasons and the overall study period (2008-2011)was developed.The values of discharge and water vapor pressure correlations are presented in Figure 10. The correlation of different time lags varied from 0.66 to 0.73 in 2008; it was very close in 2009 and 2011, for which the range is 0.77 to 0.79; and it was between 0.72 and 0.79 in 2010. On the Koxkar Glacier, the correlation between discharge and water vapor pressure varied from 0.72 to 0.76 over the whole study period for different time lags, which show little variability. The result showed no obviously consistent changes in correlation between discharge and water vapor pressure with an increasing time lag.
5.2 Relationships between discharge and climate
The large temporal variability of streamflow in glacial regions was mainly governed by the seasonality of climate; temperature and precipitation are the two most important factors influencing runoff depth(Arora et al.,2008;Gao et al.,2012).The observation of precipitation in high-mountain regions is very difficult, especially with high precision.Thus, we also analyzed the relationship between water vapor pressure and depth of runoff. Daily and monthly series of observed discharge, temperature, and water vapor pressure are used as important variables to represent discharge from the study area.Figure 11 shows the exponential relationships between daily runoff depth and daily temperature,precipitation,and water vapor pressure. Results suggest that the daily depth of runoff to daily temperature and daily water vapor pressure,with R2values of 0.56 and 0.69,respectively.The relationship with daily precipitation is not obvious, which indicates that daily precipitation did not have an instant influence on daily discharge on the Koxkar Glacier;the weak relationship found may also not exactly reflect the real impact of precipitation in the entire drainage.The equation is given in Table 5.
To identify the role of monthly temperature, precipitation, and water vapor pressure on monthly runoff,scatter plots were made(Figure 12);and precipitation gave a lowerR2value of about 0.3, as compared to 0.65 and 0.78 for monthly temperature and water vapor pressure, respectively (Table 6). The relationship between monthly precipitation and depth of runoff had more obvious significance than that for the daily scale, which indicates that precipitation contributes to runoff on a long-term time scale.The low correlation between discharge and precipitation may be induced by runoff-delay and glacier-storage effects on a large glacier. Results suggest that use of a monthly scale gives a better predictive value of the relationship between runoff and temperature and water vapor.A high correlation between mean monthly values may be due to a reduction in variability of both discharge and temperature on a monthly scale, as compared to a daily scale. The relationship between water vapor pressure and runoff is closer than that for other meteorological elements.
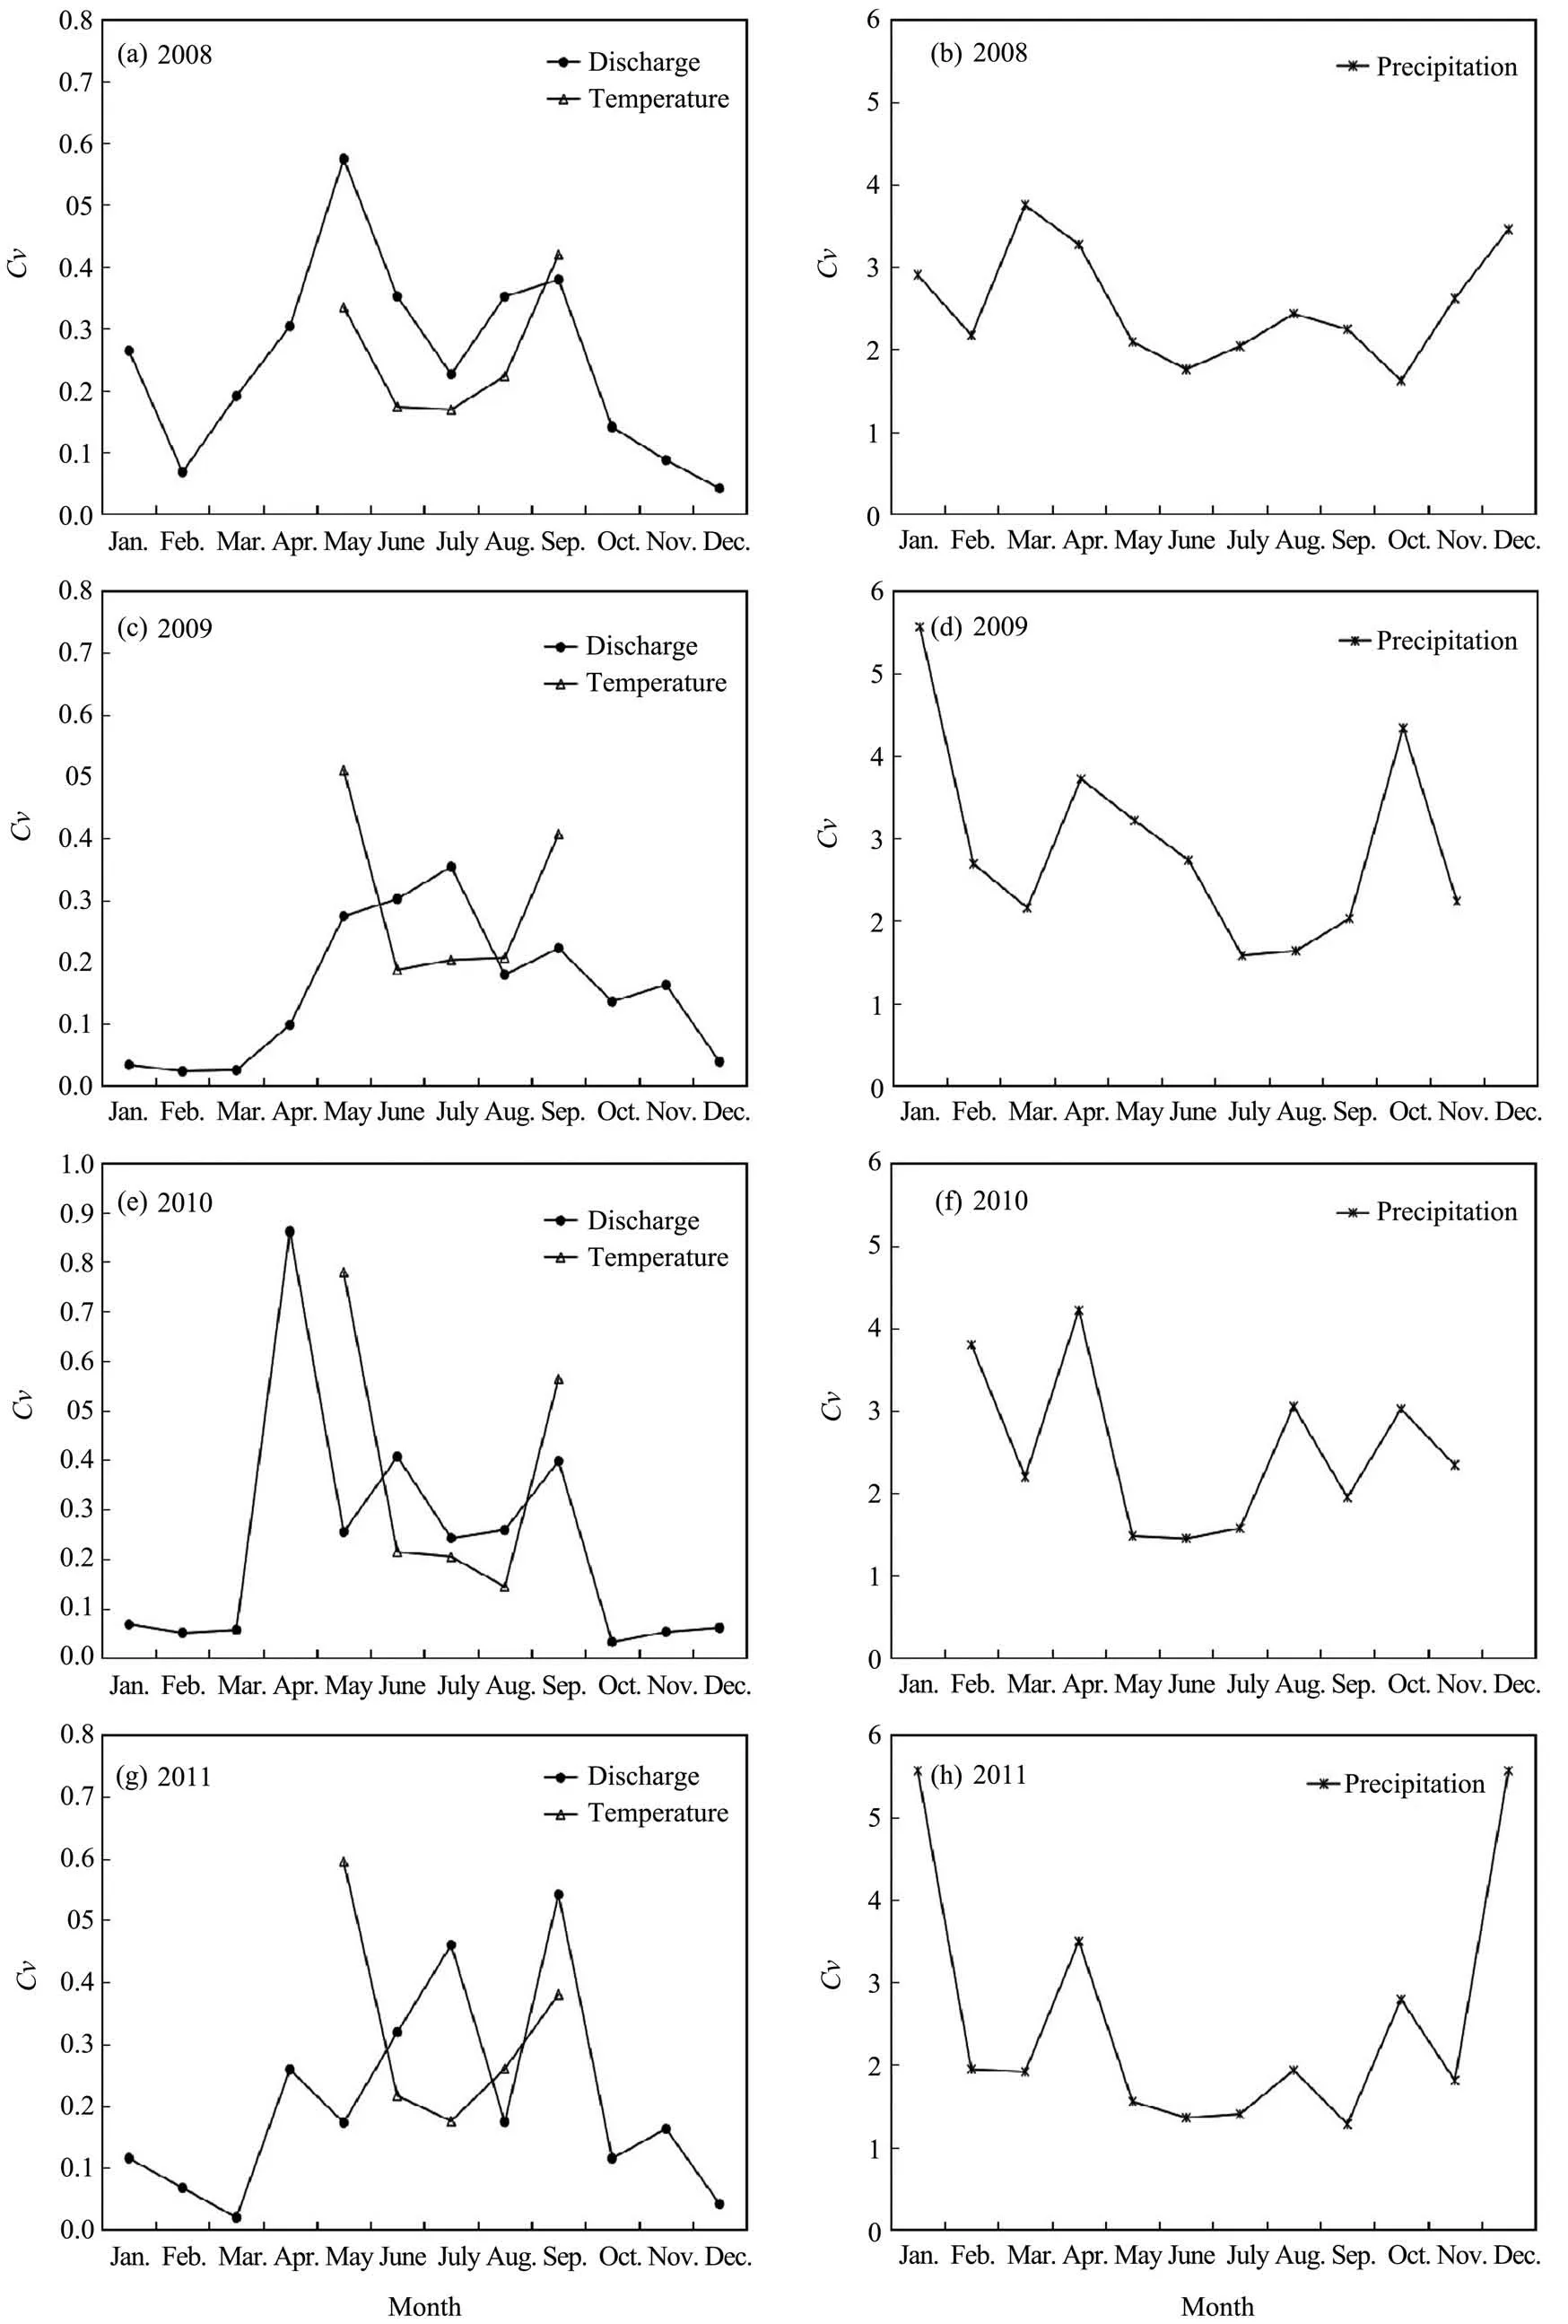
Figure 7 Changes of Cv for discharge,temperature,and precipitation in different years
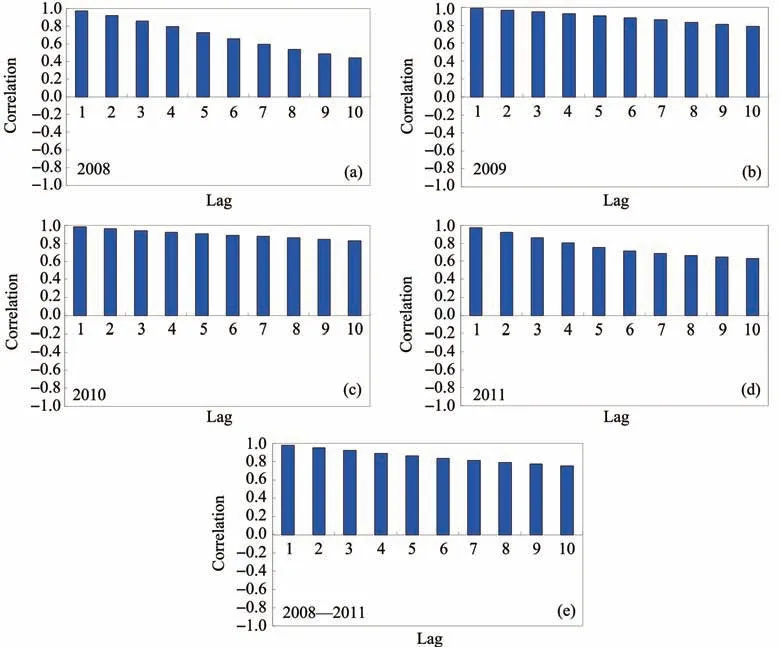
Figure 8 Autocorrelation(ACF)plots of daily discharge in different years
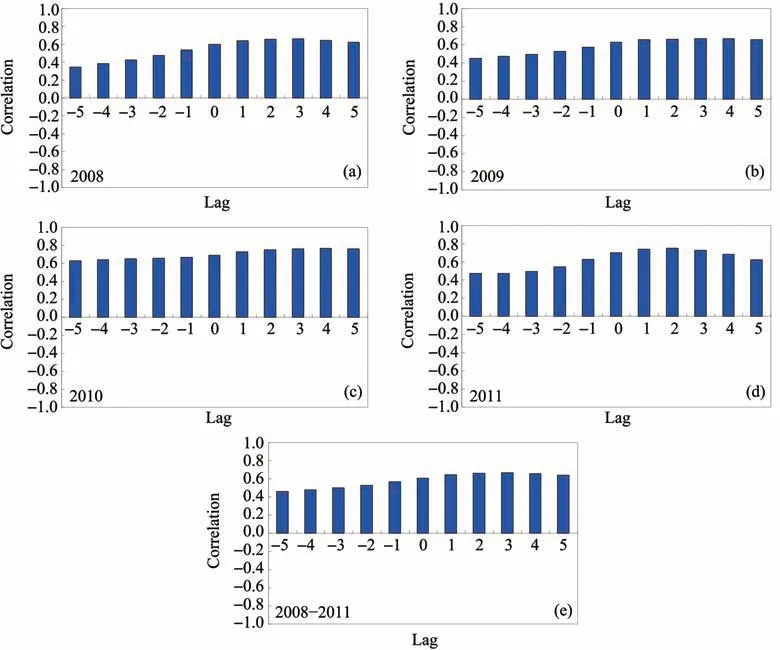
Figure 9 Cross-correlation(CCF)plots between daily discharge and daily temperature

Figure 10 Cross-correlation(CCF)plots between daily discharge and daily water vapor pressure
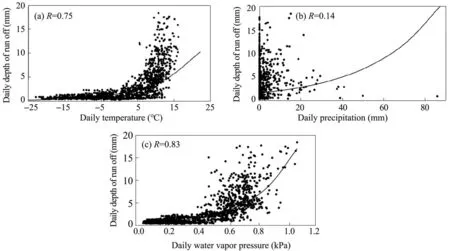
Figure 11 Relationship between daily melt depth and daily temperatures during 2008-2011
6 Conclusions
This study investigated the availability of the discharge from glaciers with suitable heads on the south slope of high Tianshan Mountains;the daily hydrological and meteorological characteristics were measured and analyzed on the Koxkar Glacier during 2008-2011. The study has provided information on the seasonal distribution of glacial runoff; it will help us calibrate the parameters in a hydrological model and correctly evaluate the changes of glacial runoff in the past and future under climate change.Furthermore,the linkage between climate and melt runoff, based on statistical analysis,was developed on the Koxkar Glacier.The high discharge autocorrelation (ACF) indicates that the main source of storage reservoir in runoff is dominant by glacial region.The cross-correlation (CCF) between daily discharge and daily air temperatures with time lags demonstrates that the particular daily discharge can be predicted to a certain degree by the previous daily temperature.No obviously consistent changes in correlation between discharge and water vapor pressure were found with an increasing time lag.
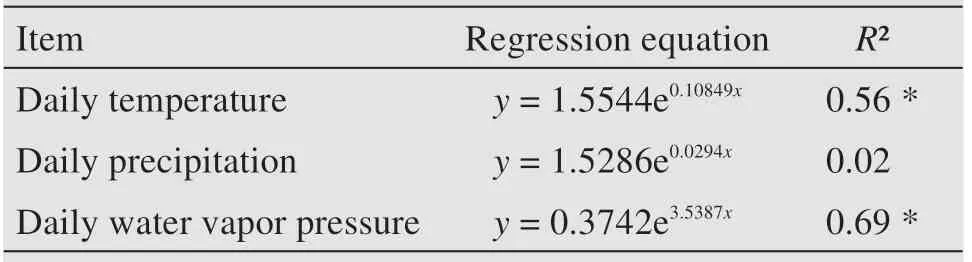
Table 5 Regression equations between daily discharge and daily temperature,daily precipitation,and daily water vapor pressure,respectively,on KG
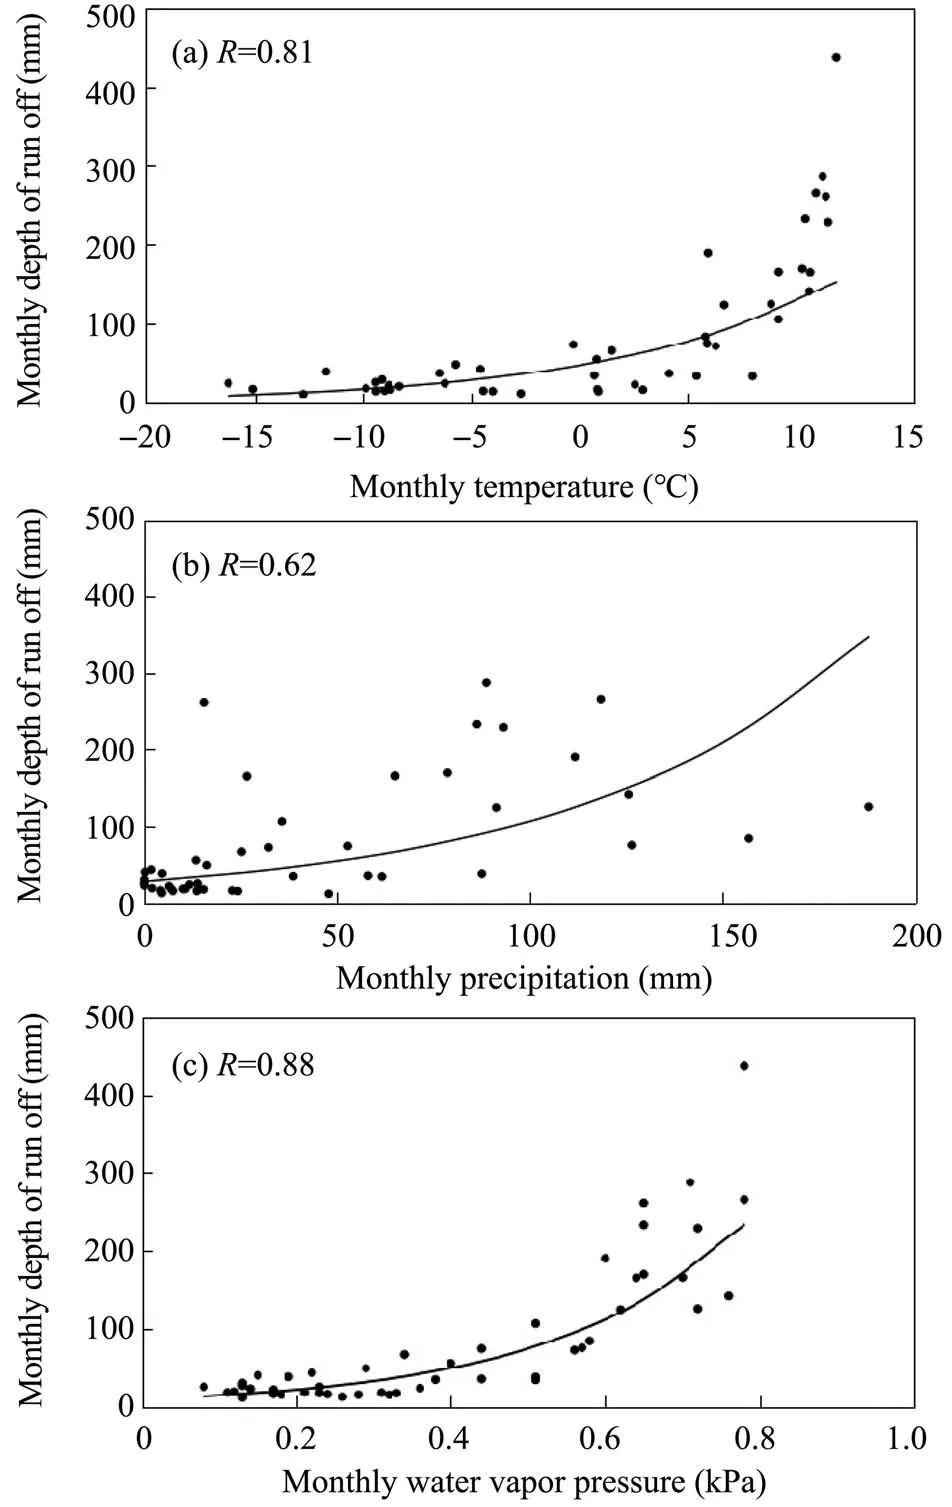
Figure 12 Relationship between monthly melt depth and monthly temperatures from 2008 to 2011
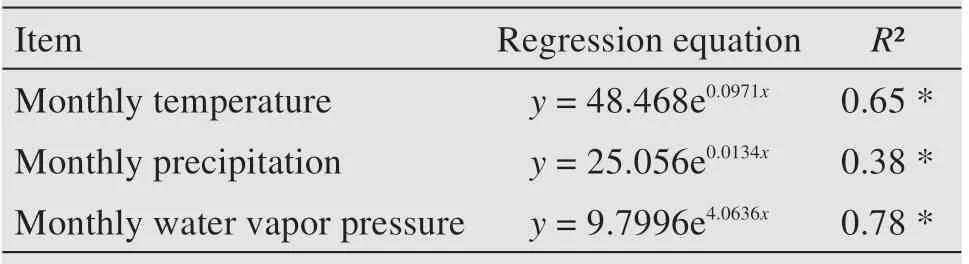
Table 6 Regression equations between monthly dischargeand monthly temperature,monthly precipitation,andmonthly water vapor pressure,respectively,on KG
The results show that the Koxkar Glacier responds to changes in climate,depending on a variety of parameters, such as temperature and precipitation, as well as other variables like water vapor pressure.It has a better relationship between runoff and temperature and water vapor pressure on a monthly scale than on a daily scale.This relationship could be described by an exponential function, which basically can estimate the glacier runoff.The relationship between runoff and precipitation is not as strong as that for other elements, not only on a daily scale but also on a monthly scale,which suggests that most of the discharge has been derived from the melting of the glacier. Field observation of climate and hydrology is helpful for understanding and extending results to a regional scale for glacial hydrological processes. More detailed field measurements and investigations are needed to analyze the linkage between meteorological elements and glacial runoff for different types of glaciers, which can provide new approaches to evaluate glacier runoff for an area lacking observed data.
Acknowledgments:
This study was supported by the National Natural Science Foundation of China (41971094, 41871055,41871059), a project of the State Key Laboratory of Cryospheric Science(SKLCS-ZZ-2019),the Youth Innovation Promotion Association CAS (2019414), and the CAS Pioneer Hundred Talents Program (Xiaoming Wang). The authors would like to thank the editors and the anonymous reviewers for their crucial comments,which improved the quality of this paper.
 Sciences in Cold and Arid Regions2019年6期
- Sciences in Cold and Arid Regions的其它文章
- Spatiotemporal variations in moisture conditions across Monsoon Asia during the last 500 years
- An evaluation of soil moisture from AMSR-E over source area of the Yellow River,China
- Vegetation change and its response to drought in Inner Mongolia of northern China from 1998 to 2013
- Definition of failure criterion for frozen soil under directional shear-stress path
- Editors-in-Chief Guodong Cheng and Ximing Cai
- Relationship between ponding and topographic factors along the China-Russia Crude Oil Pipeline in permafrost regions