
Relationship between ponding and topographic factors along the China-Russia Crude Oil Pipeline in permafrost regions
2019-06-11 03:05:22MingTangChaiYanHuMuGuoYuLiWeiMaFeiWang
MingTang Chai,YanHu Mu*,GuoYu Li,Wei Ma,Fei Wang,2
1. State Key Laboratory of Frozen Soil Engineering, Northwest Institute of Eco-Environment and Resources, Chinese Academy of Sciences,Lanzhou,Gansu 730000,China
2.University of Chinese Academy of Sciences,Beijing 100049,China
ABSTRACT The original landform along the China-Russia Crude Oil Pipeline (CRCOP, line 2) was disturbed during installation of pavement for the pipeline. Forest and vegetation coverage is dense, and runoff develops along the pipe. Since the operation of the CRCOP (line 2) began in 2018, ponding has appeared on both sides of the pipeline. If there is no drainage,ponding can hardly dissipate,due to the low permeability of the permafrost layer.With the supply of surface flow and the transportation of oil at positive temperatures,ponding promotes an increase in temperature and changes the boundary thermal conditions of the pipeline. Meanwhile, when the ponding freezes and thaws, frost heave threatens operational safety of the pipeline.Furthermore,the ponding can affect the thermal condition of line 1.In this paper,the distribution of ponding along the CRCOP was obtained by field investigation.The type and cause of ponding were summarized,and the catchment and stream order were extracted by the Digital Elevation Model (DEM).According to the statistical results in attributes for topographic factors, it is known that ponding along the pipeline is relative to elevation, slope, aspect, and the Topographic Wetness Index(TWI).Water easily accumulates at altitudes of 300-450 m,slopes within 3°-5°,aspect in the northeast or south,TWI within 13-16,flow direction in north-east-south,and flow length within 90-150 km.This paper proposes a theoretical basis for the cause and characteristics of ponding along the pipeline.
Keywords:permafrost;Digital Elevation Model(DEM);Topographic Wetness Index(TWI);pipeline;ponding
1 Introduction
Northeastern China is located at the edges of the Eurasian continent and is primarily known as the Xing'an-Baikal permafrost region. The altitude mainly ranges from 500 m to 1,500 m; and the permafrost is relatively thin, thermally unstable, and ecologically sensitive to external changes (Wei et al., 2011). The permafrost in northeastern China develops in the toe of a slope, marshes, the gentle slope of a mountain front, and river terraces (Gu et al., 1993). With climate warming and the increase of human activities,the permafrost in northeastern China has degraded toward the north, some 50-150 km over the past 50 years. Climate warming, environmental change, and human activities are three main factors that cause degradation of permafrost(Jin et al.,2007).
The China-Russia Crude Oil Pipeline (CRCOP)runs from Skovorodino,Russia,to Daqing,China,traversing 441 km of permafrost in China.Line 1 has operated safely since 2011,and the ecosystem has recovered stably along the pipe (Jinet al., 2010). Line 2 has operated since 2018 and has changed the path of the surface flow after the pavement was installed,which has caused the formation of ponding along the pipeline. The existence of ponding leads to an increase of the permafrost temperature.Besides,seasonally the freezing and thawing of the ponding can cause heaving and settling,which affect the operational safety of the pipe (Mu et al., 2018; Wang et al.,2018).
Except for the disturbance from the installation of the pavement for the pipe,the formation of ponding is related to local topographic factors.A topographic factor is the fundamental landform unit, which affects material migration, energy transformation, groundsurface processes, and landscape patterns. The spatial distribution of the topographic factor is a key indicator for describing the process of spatial change; and it not only affects the distribution of ponding but also indirectly affects the scale of ponding by regulating hydrothermal conditions (Persson et al., 2005). Topographic factors are divided into general factors and hydrological factors (Wood, 1996). General factors include microscopic factors (altitude, slope, aspect, and slope length) and macroscopic factors (plane curvature, profile curvature, surface relief, surface roughness, and surface incision). Hydrological factors include flow direction, flow length, watershed, and catchment area.
The Digital Elevation Model (DEM) is the digital expression of elevation on the ground surface(Sørensen and Seibert, 2007). As the essential information and data for the application of the distributed hydrological model, DEM was applied to extract general factors and hydrological factors by some algorithms and hydrological analysis (Xia et al., 2018).DEM has been widely used in geomorphology, hydrology,and pedology for its visual expression and efficient interpretation (Tang et al., 2001). In this paper,we have chosen elevation, slope, aspect, flow direction, flow length, catchment, stream order, and TWI to reflect topographic attribution along the CRCOP from Mohe to Jiagedaqi. Combined with data from 102 ponding sites,obtained by field investigation,statistical results between ponding and topographic factors were proposed to analyze the cause and formation of ponding.
2 Study area
The CRCOP, from Mohe to Daqing in China, is 953 km in total.It traverses 441 km of continuous permafrost, of which 119 km are warm and ice-rich permafrost. The pipe is 813 mm in diameter, 11.9 mm in thickness. The buried depth is from 1.6 m to 2.0 m,depending on local terrain and permafrost type (Lietal., 2018). Permafrost and talik appear alternately,with rugged terrain and marsh having developed(50 km long) along the pipeline. The level of groundwater is high, and surface flow has developed due to high precipitation. Along the pipeline, the permafrost environment and engineering geological conditions are complex, with a higher risk of frost heave and thaw settlement (Jin et al., 2010; Li et al., 2015). In permafrost regions, the pipeline traverses seven rivers, the Amur, Pangu, Xi'ergenqi, Huma, Ta, Duobukuer, and Gan. Flood plains and river terraces commonly develop along the pipeline (Figure 1). Gullies,valleys, quaternary strata, and gravelly soil develop along the pipe. Clay is the main component in surface sediment and forms a water-resisting layer,which contributes to the development of marsh and wetland(Chen,2007).
3 Method
Ponding was investigated along the CRCOP from Mohe to Jiagedaqi over 400 km in permafrost regions.We identified 102 ponding sites and analyzed the type, cause, and characteristics of the ponding. The DEM (provided by Geospatial Data Cloud site, Computer Network Information Center, the Chinese Academy of Sciences. http://www.gscloud.cn) was adopted to extract the attributes of general topographic factors of the pipeline and ponding, such as elevation, slope,and aspect by using the surface analysis module of ArcGIS. The attributes of hydrological factors were extracted by the filling, flow accumulation, and basin of hydrology analysis module in the software.The distribution of the catchment was obtained, and the characteristics of the source of ponding were explored according to the statistical results of topographic factors between the pipeline and the investigated ponding.
3.1 General topographic factors
General topographic factors such as elevation,slope, and aspect were selected for examination in this paper. Elevation represents the fluctuation of ground surface.Slope and aspect affect the air temperature by spatial distribution of solar radiation. Physical properties of soil (dry density, porosity, and water content) show the scale effect with changes in slope factors. The slope and aspect are point functions. The slope reflects the incline of the ground surface, which is defined by the angle between the normal direction of P(x,y) on the surfacez=f(x,y) and the vertical direction(zenith)Z,of which the range is(0°,90°).The equation is as follows (Hunter and Michael, 1997;Zhou and Liu,2004):
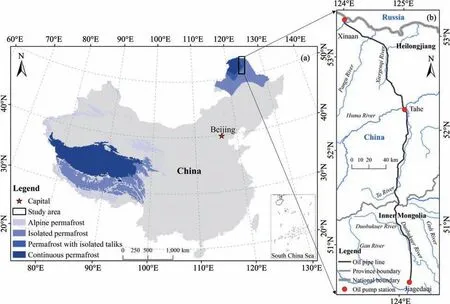
Figure 1 River distribution in the study area(Figure 1a,Shi and Mi,1988)

where fxandfyare the partial derivative inxandydirections,respectively.
Aspect is defined as the angle of the projection of the normal direction of P and the north direction, of which the range is (0°, 360°); when fx≠0, the calculation equation is as follows:

3.2 Hydrological factors
Flow direction, flow length, flow basin, watershed, and stream order were selected to analyze the thermal influence of ponding on the pipeline.Flow direction is determined by the maximum descent direction of every grid (Jenson and Domingue, 1988). The D8 (deterministic eight-neighbor) algorithm commonly has been adopted in the ArcGIS software, as was proposed by O'Callagham et al. (1984). The calculation process of this algorithm is as follows.It assumes there are eight directions in each mesh; and flow direction is determined by the maximum descent direction. Flow direction of the center grid was obtained by the maximum weight distance between the center grid and each adjacent grid among 3×3 DEM grids(O'Callagham and Skidmore,1984).
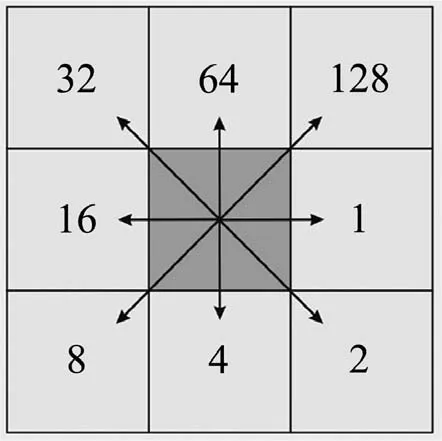
Figure 2 Flow direction of grid
Flow length is the distance from outlet to watershed of the river with the highest level, which affects runoff velocity and erosion ability of the soil (Wu et al., 2008). Catchment area is the projection area surrounded by the watershed, which affects the cumulated amount of surface flow (Vincent and Soille, 1991).River network is a numerical symbol of classification(Martz and Garbrecht, 1999). In this paper, the Strahler coding method was adopted (Strahler, 1957).The coding process is shown as follows.
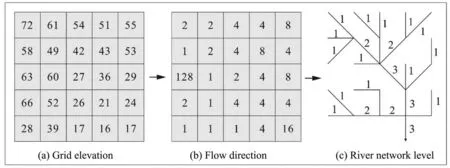
Figure 3 Extraction of river-network level(a,grid elevation;b,flow direction;and c,river network level)
3.3 Topographic wetness index
Beven and Kirkby (1979; 1984) developed a topographic index model in which the effect of topography on runoff was considered.The topographic index model (TOPMODEL) can reflect the spatial distribution of the saturated water deficit and contribution area of runoff by the topographic wetness index (lnα/tanβ). TWI increases with the increase of catchment area and the decrease of the slope,from top of the slope to the river bank. The larger the TWI value means the greater potential of the saturated zone, in which the soil can be more easily saturated(Zhang et al.,2005).
The TWI was proposed based on the following four hypotheses: (1) the infiltration capacity and saturated hydraulic conductivity of soil in the whole watershed are the same; (2) the subsurface-flow direction and the groundwater level are parallel to the ground surface;(3)water discharge is the same in spatial distribution; and (4) the subsurface flow is constant.The TWI W can be obtained as follows:

in which α is the catchment area of each unit length of a contour line at pointion the slope (m2/m);βis the slope at point i(°).
First, the flow path should be analyzed during the calculation of α (α =A/L) to determine the total upslope area A and the effective contour line length L,which is perpendicular to the flow direction. During the calculation of TWI by the method of multi-directional flow (Quinn et al., 1991), the cumulative area of each direction of the downward slope is calculated as follows:
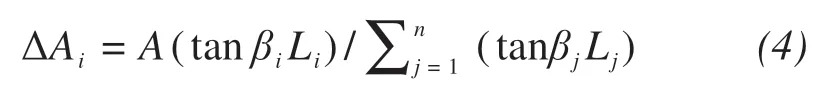
in which n is the sum of the downward direction of the slope; ΔAiis the cumulative area entering the i downward slope grid; A is the cumulative area of grids on the upslope; tanβiis the i-direction downward slope.
It is assumed that the most representative slope of the grid is the weighted-average-value downward slope;tanβ can be expressed as follows:

in which Ljis the length of the contour line vertical with the j direction of the downward slope.
Based on Equations (4) and (5), α/tanβ can be expressed as follows,

4 Results
The forest is dense on the ground surface in the study area. The soil became soft after excavation and backfilling along a narrow range on both sides of the pipeline, which made for easier formation of ponding(Figure 4). There were 102 instances of ponding along the pipe in the summer of 2018. The ponding was mainly concentrated in a narrow area (approximately 5 m width) beside the pipe. The length of the ponding was distributed over a range of 10-100 m.According to analysis on the distribution of ponding sites, the ponding mainly was concentrated in the following three types of regions: (1) developed region of wetland, marsh, or groundwater; (2) runoff-traversing region;and(3)flat valleys.
4.1 Interactions between pipeline and ponding
The accumulation of ponding carries a large amount of heat. Ponding increases the temperature of permafrost beneath the pipe by lateral thermal influence, which accelerates thaw settlement of the pipe and affects the safety of operation. According to the position, ponding can be divided into four types: outside line 2; between line 1 and line 2; both sides of line 2; and on the top of line 2. Ponding changes the boundary condition of the ground surface. The duration of temperature-decrease of ponding is more than that of backfilling soil.Among the four types of ponding listed above, ponding on both sides of line 2 has the largest thermal influence on the permafrost subgrade.The interactions between ponding and pipe can be revealed by hydrothermomechanical coupling (Liu et al.,2013;Wen et al.,2018).

Figure 4 Distribution of ponding:(a)K23,(b)K121,and(c)K193
The accumulation and discharge of ponding can be divided into three types: no accumulation and no discharge; only accumulation; and accumulation with discharge. The first type of ponding is mainly from precipitation and melting of underground ice.With expansion of the ponding area, the backfilling soil settles; and a concave space forms, allowing for more water accumulation. The second type of ponding is from ground-surface flow. When water accumulates beside the pipe, some of it permeates into the pipeline subgrade.Because it is not easy to discharge the accumulated water, the ponding area increases quickly;and it is necessary to apply some engineering measures to treat the water. The scale of the third type of ponding remains stable, and the flow of water thermally erodes the embankment of the pipeline.The last two types of ponding have more severely threatened the safety of the pipe than the first type.
4.2 Hydrological analysis results
The analytical results of the river-network level are shown in Figure 5a. Due to the rugged terrain, the river network is dense in the study area; and there are six levels in total, based on the Strahler coding rule.The water channel with the highest level corresponds to these rivers: the Amur, Pangu, Xiergenqi, Huma,Ta, Duobukuer, and Gan. The higher the level of the river network, the more tributaries accumulate, flowing into the river.The river with the lowest level attributes to the seasonal rainfall.The watershed along the pipe was obtained in Figure 5b. It is known that the watershed from north to south can be divided into three parts: (1) the Amur River, (2) the Ta River and the Huma River, and (3) the Duobukuer River and the Gan River.
On river terraces and in valleys, the ground surface is humid; and it is easy for water to accumulate.The catchment along the pipeline is shown in Figure 5c. A larger catchment means there is a larger water source,which threatens the safety of the pipe more severely.According to the results, the catchments of the ponding, from large to small, are K149 (near the Huma River), K122 (near the Walagan River), Xi'er K224 (near the Manlakai River), K95 (near the Xiergenqi River), K287 (marshland), K10 (marshland south to the Amur River), K183-K185 (near the Daxiluga River and the Xiaoxiluga River), and K74 (valley), successively. The TWI is shown in Figure 5d;the TWI increased from mountain to valley, which means that the capacity of water accumulation increased and the soil is easily saturated.Calculation results of the TWI is consistent with extraction results of the river network,which is precise to reflect the degree of water accumulation.
4.3 Statistical results of attributes
To analyze the difference in attributes between ponding and pipe, statistical results of the attributes were analyzed. Altitude is distributed from 300 m to 700 m along the pipeline (Figure 6a). The percentage of ponding below 450 m is 35.1%,which is more than that for the study area along the pipeline. However,the percentage of ponding above 450 m is 64.9%,which is less than that for the study area along the pipeline. It means that ponding more easily accumulates at the range of 300-400 m in elevation. From statistical results of the slope,it can be known that the range of the slope along the pipe is from 2.5° to 15.0°(Figure 6b);the percentage of the slope along the pipe at the range of 3°to 5°is 58.7%,while the percentage of ponding is 84.5%.The slope is commonly great on mountain tops and in valleys, which is the source of rivers and runoff. It is easy for water to accumulate at the foot of a hill or in a valley.
Statistical results of aspect are shown in Figure 7a. The flat region is 1%, meaning there are lots of hills in the study area. The percentage for east and west is less than for other aspects. The ponding distributed on the northern and southern slopes is more than that for the study region along the pipeline.From statistical results of the flow direction (Figure 7b), it can be seen that the percentage of ponding in directions north, east, and south is larger than that in the study region along the pipeline, which contributes to water accumulation.

Figure 5 Results of hydrological analysis:(a)river-network level,(b)watershed,(c)catchment,and(d)TWI
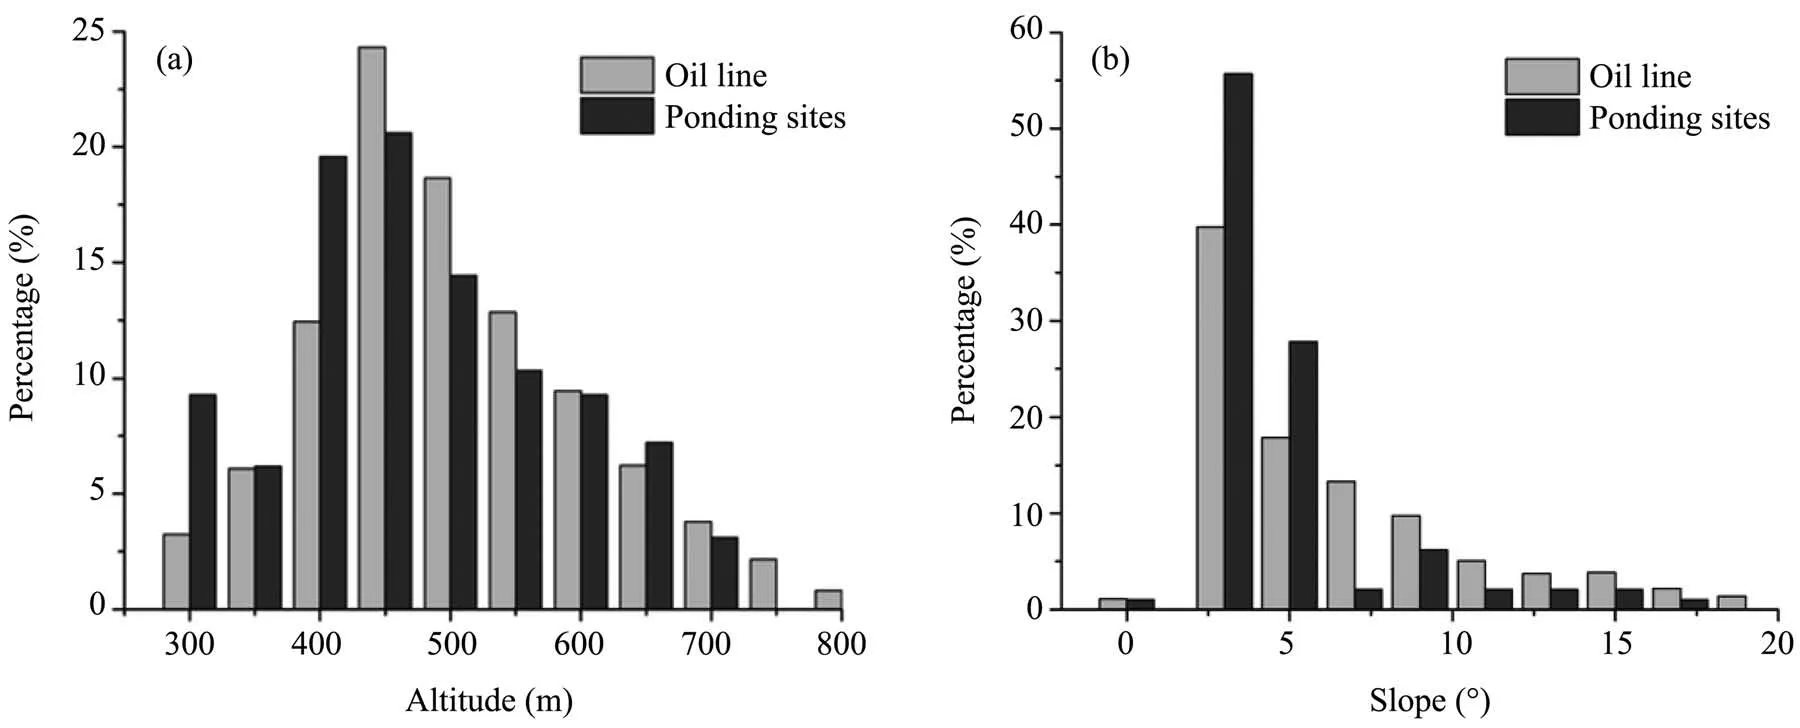
Figure 6 Statistical results of attributes in elevation(a)and slope(b)between ponding and the study region along the pipeline
Statistical results of the flow length are shown in Figure 8a. Flow length along the pipe is mainly focused at 60-150 km. The percentage of ponding with flow length in the range of 60-80 km is less than that in the study region along the pipeline. The long flow path contributes to the water accumulation. Calculated results of the TWI are shown in Figure 8b. When the TWI is greater than 8, then with the increase of the TWI,the percentage of the TWI along the pipe decreased.The TWI from 11 to 16 is 15.8% in ponding;however, in the study region along the pipeline, it is 38.7%.With the increase of the TWI,the formation of ponding is more likely.
The correlation index of the attributes between ponding and the whole pipeline is shown in Table 1.From the results, it can be seen that there is a good correlation between attributes of ponding and the whole pipeline.The larger correlation index(slope,aspect, and flow length) means that the distribution of percentages between ponding and the pipeline are similar. The smaller correlation index (altitude, flow direction,and TWI)means that the distribution of percentages of ponding is unique, which can better reflect the cause of ponding.
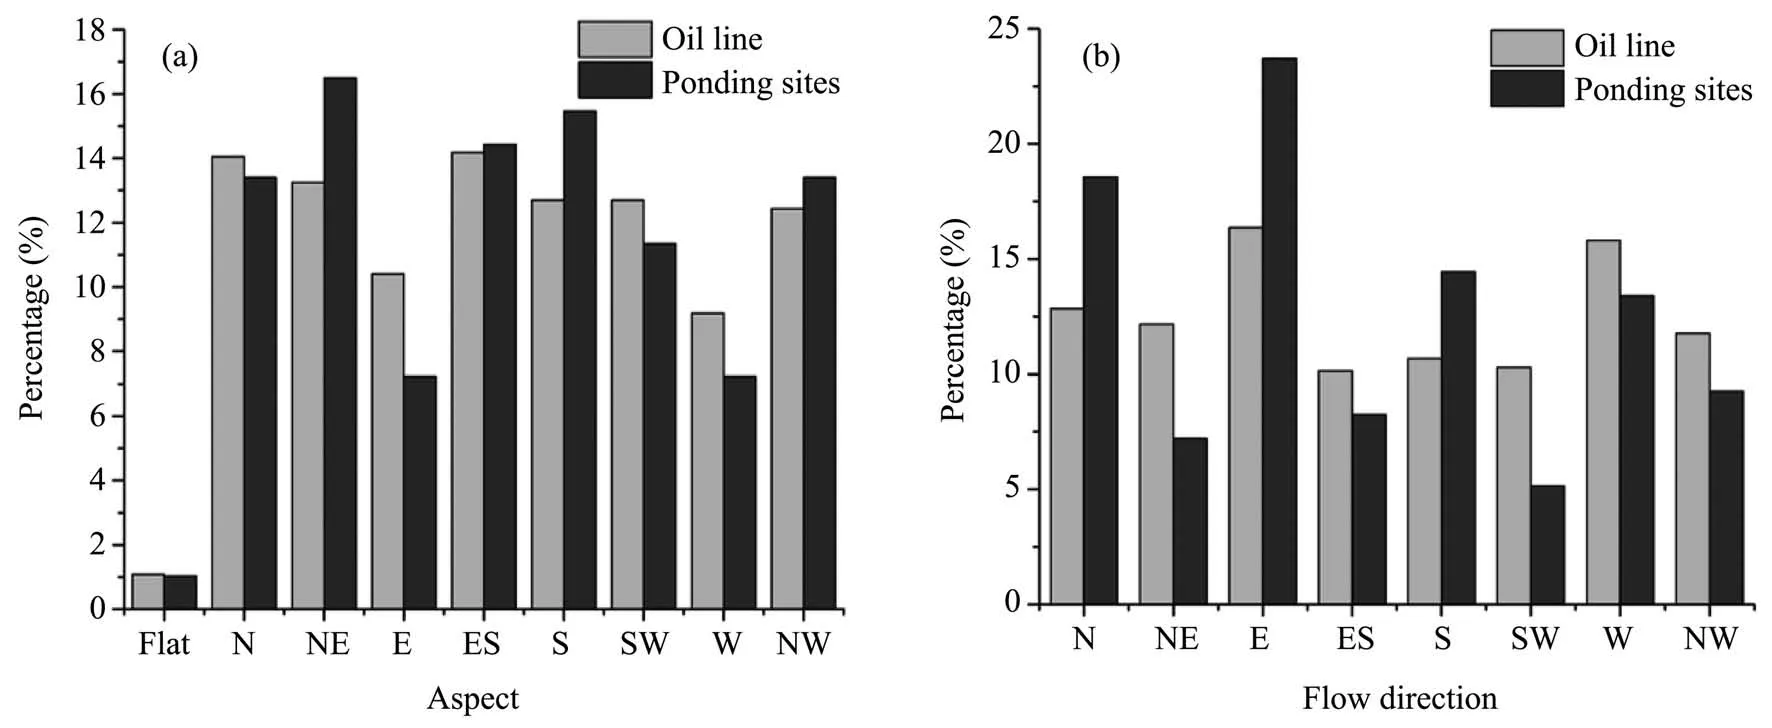
Figure 7 Statistical results of attributes in aspect(a)and flow direction(b)between ponding and the study region along the pipeline
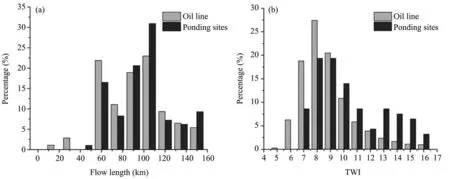
Figure 8 Statistical results of attributes in flow length(a)and the TWI(b)between ponding and study region along the pipeline

Table 1 Correlation index of attributes,between ponding and the whole pipeline
5 Discussion
Ponding changes the thermal condition of the ground surface. The huge latent heat and heat capacity of water during the phase change affect the temperature field surrounding the pipeline. Freezing and thawing of the active layer cause warping and differential settlement of the pipe, which threatens the safety of operation. If there is no measure to treat the ponding, permafrost degrades and ground ice melts,which increase the area of ponding. Based on analysis of the field survey on the ponding environment, it is known that water easily accumulates on flat terrain and in valleys with developed surface flow and groundwater. The pipeline traverses forest and changes thermal conditions of the ground surface once the pavement was installed. After a rainfall, surface runoff accumulates on both sides of the pipe, which contributes to the formation of ponding.
The source of ponding is mainly from outflow of the groundwater, melt of the ground ice, accumulation of rainfall, and catchment of the surface flow. Quaternary sediment is thin along the pipeline,and the lithology consists of clay, silt, sand, and gravelly soil. Partial lithology is completely or intensely weathered bedrock along the pipe (Zhao, 2013). The ground surface has a good vegetation coverage and dense river network,which are supplied by rainfall and melted snow. Dry and wet seasons alternate over the whole year, and hydrological characteristics are evident (Cheng and Jin,2013). Therefore, surface flow traverses the pipeline,and water penetration is prevented by the permafrost.Besides, soil on the ground surface is almost saturated and is suitable for water accumulation.
Most of the ponding along the CRCOP is from surface flow,which is a significant component of the river network in the watershed. By the extraction of the distribution of the watershed along the pipeline, the scale and source of the surface flow and ponding can be analyzed intuitively (Vincent and Soille, 1991). Engineering measures should be proposed to treat the ponding according to the area of the catchment. For a small catchment, surface flow should be intercepted; and ponding can be eliminated. For a large catchment,ponding should be dredged and drained. The temperature of the permafrost subgrade beneath the pipe was measured to guarantee the safety of the pipe (Li et al.,2018;Wang et al.,2018).The temperature can be effectively reduced with the adoption of engineering measures(ventiduct and thermosyphon).
The TWI is a comprehensive index and is relevant to the ponding along the pipeline.The TWI of ponding is generally high, which threatens the operational safety of the pipe. From statistical results of the attributes,it can be seen that the distribution of ponding is related to the topographic factors.Ponding develops more easily in regions of flat terrain,with low slope and a south/north aspect.The trend of the CRCOP is approximately from north to south, and runoff traverses the pipe.Water accumulates beside the pipe with a high embankment when the runoff drains poorly. The formation of ponding is also relevant to the flow direction and flow length.The flow direction in ponding sites accounts for the largest percentage with north, east, and south. The reason is that the flow direction of runoff with a high level in the study area is the same for the above three directions. With a high river-network level and long flow length, the section along the pipe has large flux and water accumulates easily.
6 Conclusion
The distribution of ponding was obtained by a field survey along the CRCOP. The characteristics of the topographic factors in the study area were extracted from the digital elevation model (DEM). The attribute of each factor of ponding and the pipeline was extracted and used to analyze the relationship. Depending upon the source and development condition of the ponding,conclusions can be drawn as follows.
(1)The CRCOP traverses permafrost regions from Mohe to Jiagedaqi. Ponding frequently appeared and was distributed in regions of marsh, wetland, valleys,and flat ground at the foot of mountains.According to the type of accumulation and discharge of water,ponding can be divided into the following three types:no accumulation and no discharge; only accumulation; accumulation and discharge.The source of water in ponding is mainly groundwater, ground ice, rainfall, and surface flow. The original surface flow was altered by pavement and artificial disturbance, which contributed to the formation of ponding. Ponding threatens operational safety of the pipe. Engineering measures should be adopted, based on type of the ponding,to eliminate the threat.
(2) The river network along the pipe is dense and was divided into six levels. The river network with the highest level is consistent with the distribution of seven large rivers. When a river has a high level, it means it has lots of tributaries and large flux.When a river has a low level,that level is related to the seasonal rainfall and snow melt, which is wet and dry alternately. There are three watersheds along the CRCOP from north to south: the Amur River, the Ta River,and the Duobukuer River. The catchment of ponding from large to small are at the mileage of K149, K122,K224,K95,K287,K10,K183-K185,and K74.
(3) Ponding along the CRCOP is related to altitude, slope, aspect, and the TWI.According to statistical results of the topographic factors, it can be found that the formation of ponding is easy when the elevation is in the range of 300-450 m, the slope is in the range of 3°-5°, the aspect is northeast or south, and the TWI is in the range of 13-16. Besides, the ponding is related to the hydrological factors.When the flow direction is north, east, or south;and the flow length is in the range of 90-150 km,the formation of ponding is likely. The TWI has the best correlation with ponding.
Acknowledgments:
This work was supported by the Strategic Priority Research Program of the Chinese Academy of Sciences(Grant No. XDA2003020102), the China Postdoctoral Science Foundation (No. 2019M653797), and the National Natural Science Foundation of China (No.41630636 and No.41772325).
 Sciences in Cold and Arid Regions2019年6期
- Sciences in Cold and Arid Regions的其它文章
- Spatiotemporal variations in moisture conditions across Monsoon Asia during the last 500 years
- An evaluation of soil moisture from AMSR-E over source area of the Yellow River,China
- Vegetation change and its response to drought in Inner Mongolia of northern China from 1998 to 2013
- Characteristics of climate and melt runoff in the Koxkar Glacier River Basin,south slope of the Tianshan Mountains,Northwest China
- Definition of failure criterion for frozen soil under directional shear-stress path
- Editors-in-Chief Guodong Cheng and Ximing Cai