A Data-Intensive FLAC3D Computation Model: Application of Geospatial Big Data to Predict Mining Induced Subsidence
Yaqiang Gong and Guangli Guo ,
Abstract: Although big data are widely used in various fields, its application is still rare in the study of mining subsidence prediction (MSP) caused by underground mining.Traditional research in MSP has the problem of oversimplifying geological mining conditions, ignoring the fluctuation of rock layers with space.In the context of geospatial big data, a data-intensive FLAC3D (Fast Lagrangian Analysis of a Continua in 3 Dimensions) model is proposed in this paper based on borehole logs.In the modeling process, we developed a method to handle geospatial big data and were able to make full use of borehole logs.The effectiveness of the proposed method was verified by comparing the results of the traditional method, proposed method, and field observation.The findings show that the proposed method has obvious advantages over the traditional prediction results.The relative error of the maximum surface subsidence predicted by the proposed method decreased by 93.7% and the standard deviation of the prediction results (which was 70 points) decreased by 39.4%, on average.The data-intensive modeling method is of great significance for improving the accuracy of mining subsidence predictions.
Keywords: Geospatial big data, mining subsidence prediction, FLAC3D, underground coal mining.
1 Introduction
1.1 Geospatial big data and mining subsidence prediction
Governments, scientific institutions, commercial companies, and public media all attach great importance to the value of big data, and there is no doubt that the era of big data has come [Yuki (2011); Lohr (2012); Chen, Mao and Liu (2014)].However, in the study of MSP, the application of big data idea is very rare.
MSP plays an essential role in evaluating surface damage, protecting the natural environment and preventing disasters caused by underground coal mining.The accuracy of MSP can only be improved by providing a better understanding of the lithology and spatial distribution of the rock layers above the coal seam.Geological borehole logs are the most reliable data for identifying the stratigraphic interfaces and lithologic spatial distribution of underground rocks.According to the definition of geospatial data [Li, Dragicevic, Castro et al.(2016)], borehole data are also a part of geospatial big data.
Due to the lack of unstructured geospatial big data processing methods, the existing research has the problem of over-simplifying the rock masses.For example, undulating stratigraphic interfaces are simplified to horizontal stratigraphic interfaces and the rock layers whose lithology changes with space are simplified into rock layers whose lithology remains unchanged on the horizontal surface [Ma, Yin, Li et al.(2017); Pongpanya, Sasaoka, Shimada et al.(2017); Ma, Li and Zhang (2017); Cheng, Zhao and Li (2018); Li, Zhao, Guo et al.(2018)].This type of simplification reduces the difficulty of MSP as well as reduces the rationality of the prediction.Inspired by the idea of geospatial big data, MSP requires the use of complete geospatial big data rather than simplified partial data.
1.2 Geospatial big data and FLAC
FLAC is an effective finite difference method for predicting surface subsidence.Some representative studies are described below.In 1999, Alejano et al.[Alejano, Ramirez-Oyanguren and Taboada (1999)] used FLAC2Dto analyze surface subsidence caused by British mines.This two-dimensional analysis model is undoubtedly a simplified model compared with the real 3D stratigraphy.In 2013, Xu et al.[Xu, Kulatilake, Tian et al.(2013)] established a FLAC3Dmodel using a simplified stratigraphic system and analyzed the surface subsidence problems caused by WUTONG mining in China.In 2016, Li et al.[Li, Guo, Zha el al.(2016)] established a FLAC3Dmodel using a simplified borehole histogram and analyzed the surface subsidence caused by underground coal gasification.No cases that use complete regional multi-hole data to build a FLAC model have been found in published journals.
However, FLAC3Dis fully capable of processing geospatial big data.The FLAC3Duser manual [Itasca (2009)] also mentions that when extensive field data are available, a comprehensive model can be built using these data to meet the needs of engineering design directly.Therefore, by combining geospatial big data with FLAC3D, spatial coordinate data of rock layers can be used to establish a data-intensive FLAC3Dmodel, which will improve the accuracy of MSP.
2 Study area and data
2.1 Study area and its geological characteristics
The study area is located in the YPH coal mine, Inner Mongolia Autonomous Region of China, which is a newly built mine with a design production capacity of 10 million tons per year.The 2201 working face of 22 Panel, adopting fully-mechanized and full-seam longwall caving method, is the first mining face.According to the exploration results of 16 boreholes, the study area was found to have the following geological characteristics.First, the overlying strata can be divided into: the Jurassic Yan-an Formation, Zhi-luo Formation, An-ding Formation, Cretaceous Zhi-dan Group, and Quaternary.Second, the rock masses are mainly clastic sedimentary, layered structures, with anisotropy and have significant changes in mechanical strength.Besides, it has a simple geological structure, and no faults have been found.The regional comprehensive results of geological drilling in this area are shown in Tab.1.
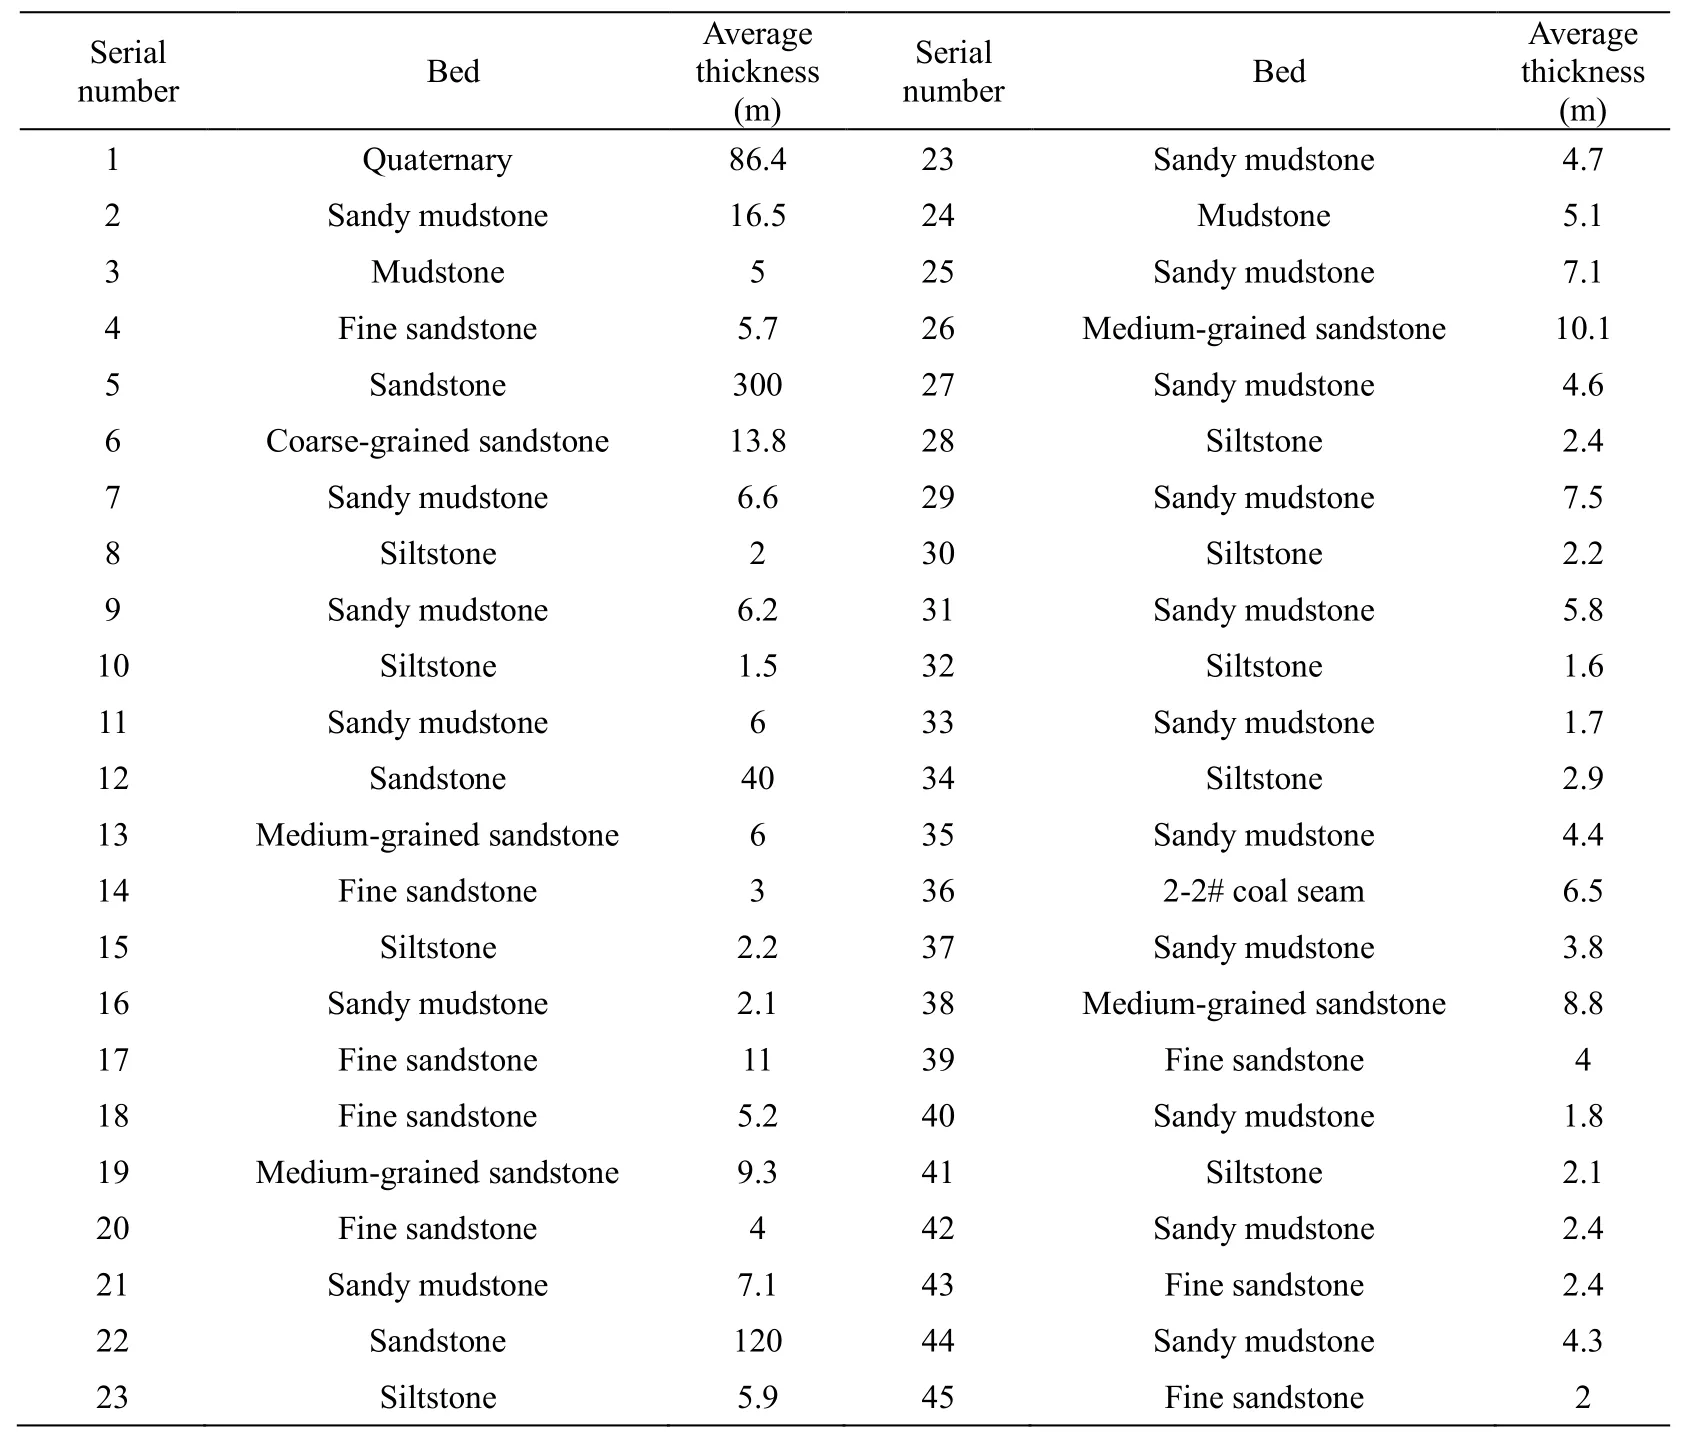
Table 1: The regional comprehensive results of geological drilling
2.2 Data
Two sets of data were used to build the traditional and data-intensive FLAC3Dmodel.The traditional modeling process adopts a simplified stratigraphic structure and generally uses a regional comprehensive columnar graph, while the presented modeling method is based on all of the borehole logs.In this study, we used nineteen borehole logs and results of two surface observation lines from the YPH coal mine.The distance between two adjacent observation points is 30 m.Points on the strike observation line are numbered from C1 to C82, and those on the tilt observation line are numbered from B10 to B81.Their relative positions are shown in Fig.1.
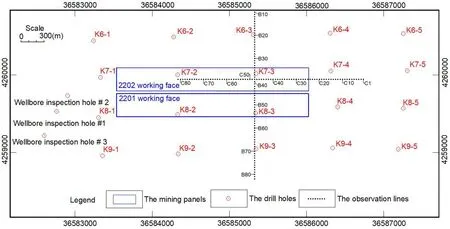
Figure 1: The surface observation points and boreholes
3 Methodology
In this part, the date-intensive FLAC3Dmodeling method is described and it mainly contains four steps.
3.1 FLAC3D model range estimate
The estimate of a FLAC3Dmodel range can be defined by the boundary angle as shown in Fig.2.Based on a large amount of measured data, it can be concluded that the angle value of 45 degrees is a conservative estimate, which ensures that the calculated range of the model is larger than the actual subsidence range.
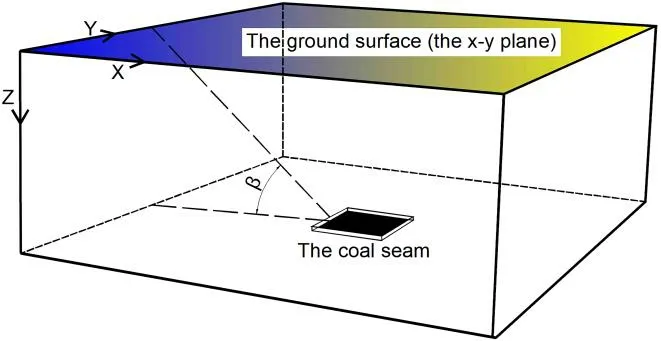
Figure 2: FLAC3D model range estimation
3.2 Divide the FLAC3D model into sub-models
After the FLAC3Dmodel range estimate, all of the geological exploration boreholes in the ground surface (the x-y plane) can be marked, and then the FLAC3Dmodel can be divided into sub-models along the z-direction by dividing the ground surface into sub-regions according to the relative positions of boreholes.
Assuming that the lithology and thickness of each rock layer in a sub-model controlled by a certain borehole are the same as the borehole logs, then the spatial distribution of the overlying strata in the whole model range can be determined.Considering that FLAC3Donly supports dealing with a solid model composed of tetrahedrons, pentahedrons and hexahedrons, two principles for dividing the model into sub-models can be proposed.First, the sub-regions should be equal in area as much as possible, and there should only be one borehole in each sub-region.Second, the sub-region can only be divided into triangles, quadrangles or combinations of the two.In most cases, boreholes are regularly arranged as shown in Fig.3.The ground surface can be divided into quadrangles along the horizontal and vertical direction directly.

Figure 3: Divide the x-y plane into sub-regions
3.3 Subdivide the FLAC3D model along the z-direction
After dividing the x-y plane into sub-regions, it has to subdivide the sub-regions along the z-direction.In fact, the distribution of different types of rocks in real cases varies with location, as is shown by the area indicated by arrow 1 in Fig.4.

Figure 4: Part of four adjacent boreholes in the YPH coal mine
If sub-regions are directly subdivided in accordance with the borehole logs, the grids marked by the pink ellipse in Fig.5 will be obtained.This direct method of subdivision leads to discontinuity of the computational grids, which causes FLAC3Dto be unable to work.

Figure 5: Discontinuous grids generated by the direct method
To solve this problem, the following methods are presented in three steps.First, the stratigraphic interface is determined according to the stratigraphic unit, which is divided into groups or formations.According to the point cloud data of each borehole at the interface, the spatial form of the stratigraphic interface can be obtained by surface fitting, as shown in Fig.6.
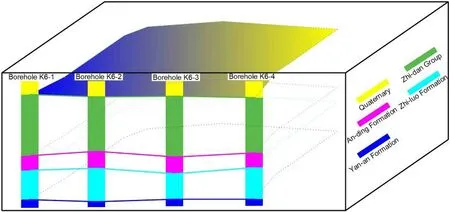
Figure 6: Surface fitting results
Second, the groups or formations are divided into N equal parts, and the coordinates at the bottom of each equal part are taken as the point cloud data, and N-1 new surfaces can be obtained by surface fitting.As is shown in Fig.7, the Yan-an formation of the YPH coal mine is divided into ten equal parts and is then fitted.

Figure 7: Planar graph of the fitting result
Third, the three-dimensional closed space surrounded by the fitted surfaces and model boundary is defined as sub-units, and the rock layers in the comprehensive column graph are represented as multiples of sub-units, as shown in Fig.8.The solid model established by this method can be transformed into continuous FLAC3Dgrids by FISH (the language of FLAC).

Figure 8: Subdivision results of part of the Yan-an formation
3.4 Determinations of mechanical parameters
The mechanical parameters of each rock layer are individually determined according to its geological description.This process is performed by a computer as shown in Fig.9.A is a specific rock layer, B is a rock layer in the database of wellbore inspection holes, and C is the most similar rock layer to A.First, determine whether there is a geological description of B that is identical to that of A, and if so, the mechanical parameters of A are equal to B.Otherwise, look for C in the database and the mechanical parameters of A are equal to the modified values of C.

Figure 9: Flow chart of the mechanical parameters determination
4 The modeling process based on different methods
4.1 The FLAC3D modeling process based on the traditional method
The closed rectangle modeling area is determined by the boundary angle, as shown by the red rectangle box in Fig.10 which using the Beijing coordinate system of 1954.The model size is 3800 m*1800 m, and the coordinates in the upper left corner and the lower right corner are 36582897, 4260639 and 3658669, 74258839, respectively.The simulated altitude range of the model is 484.4 m to 1248.0 m.
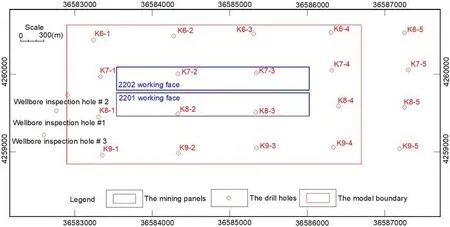
Figure 10: Determination of the modeling area
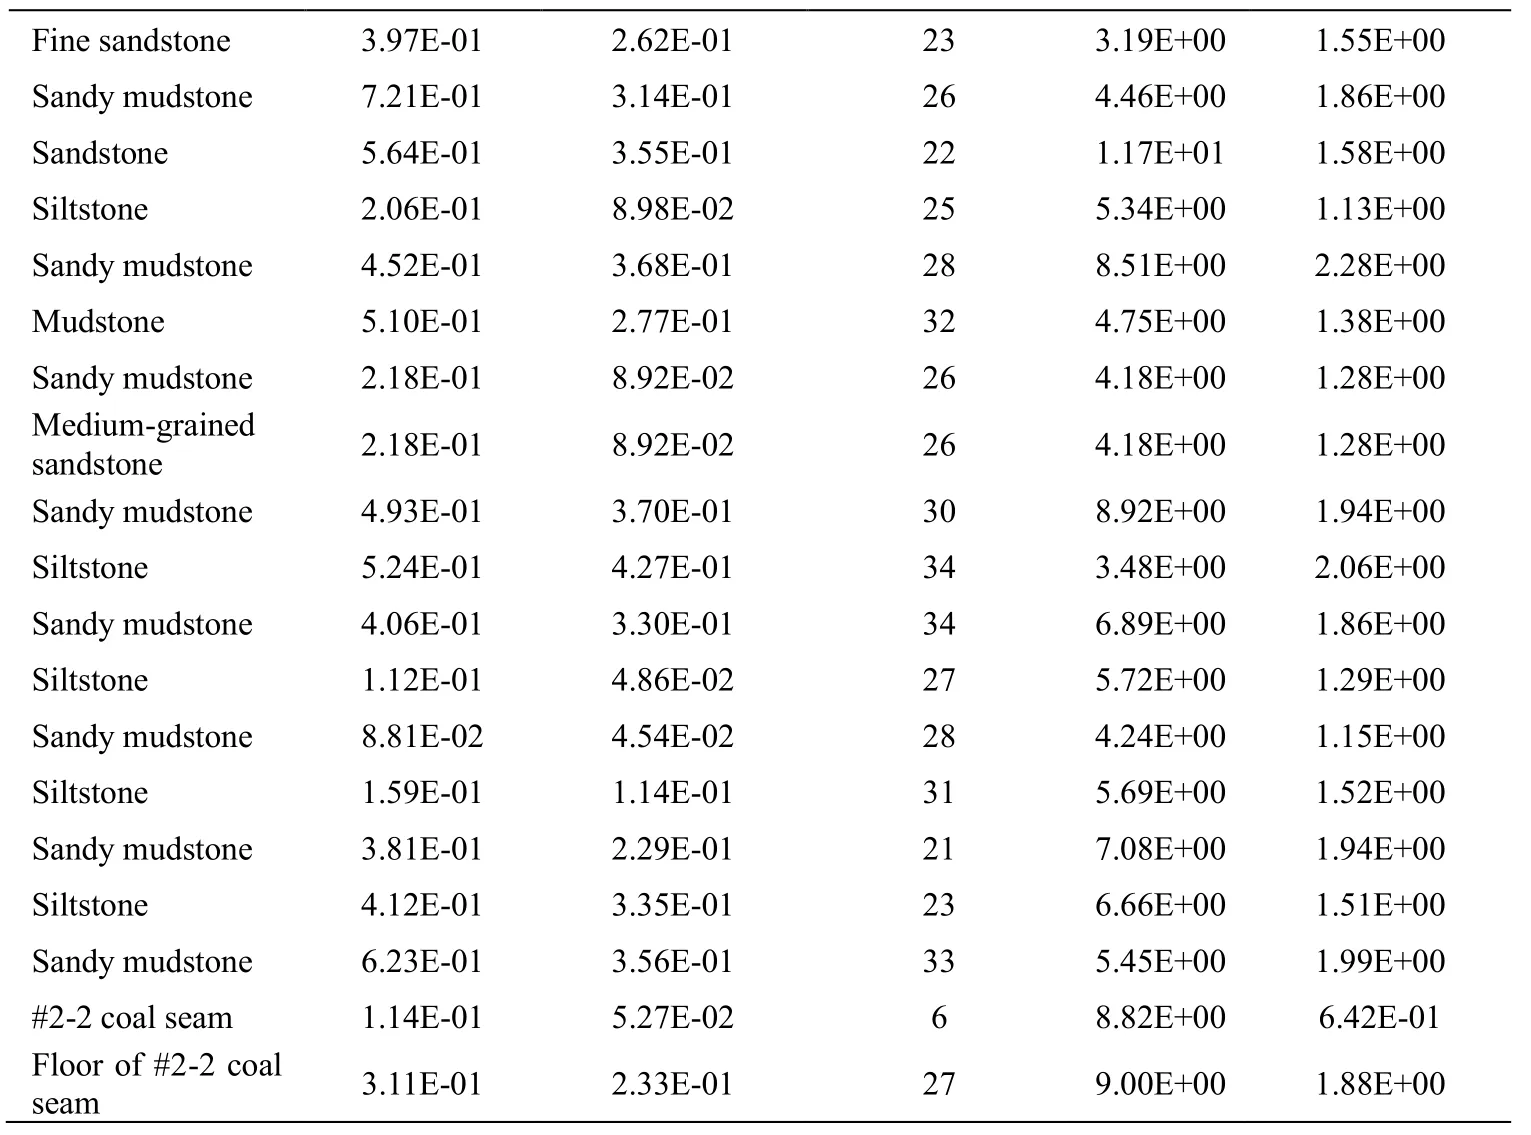
Mohr-Coulomb yield criterion [Itasca (2009)] is used in the traditional model.And its mechanical parameters for each rock layer are the average values of the same elevation in the data-intensive FLAC3Dmodel, as shown in Tab.2.It should be mentioned that because the formation integrity of the YPH coal mine is good and its structural surface is insufficient, the parameters of rock samples are directly used to replace that of rock masses.
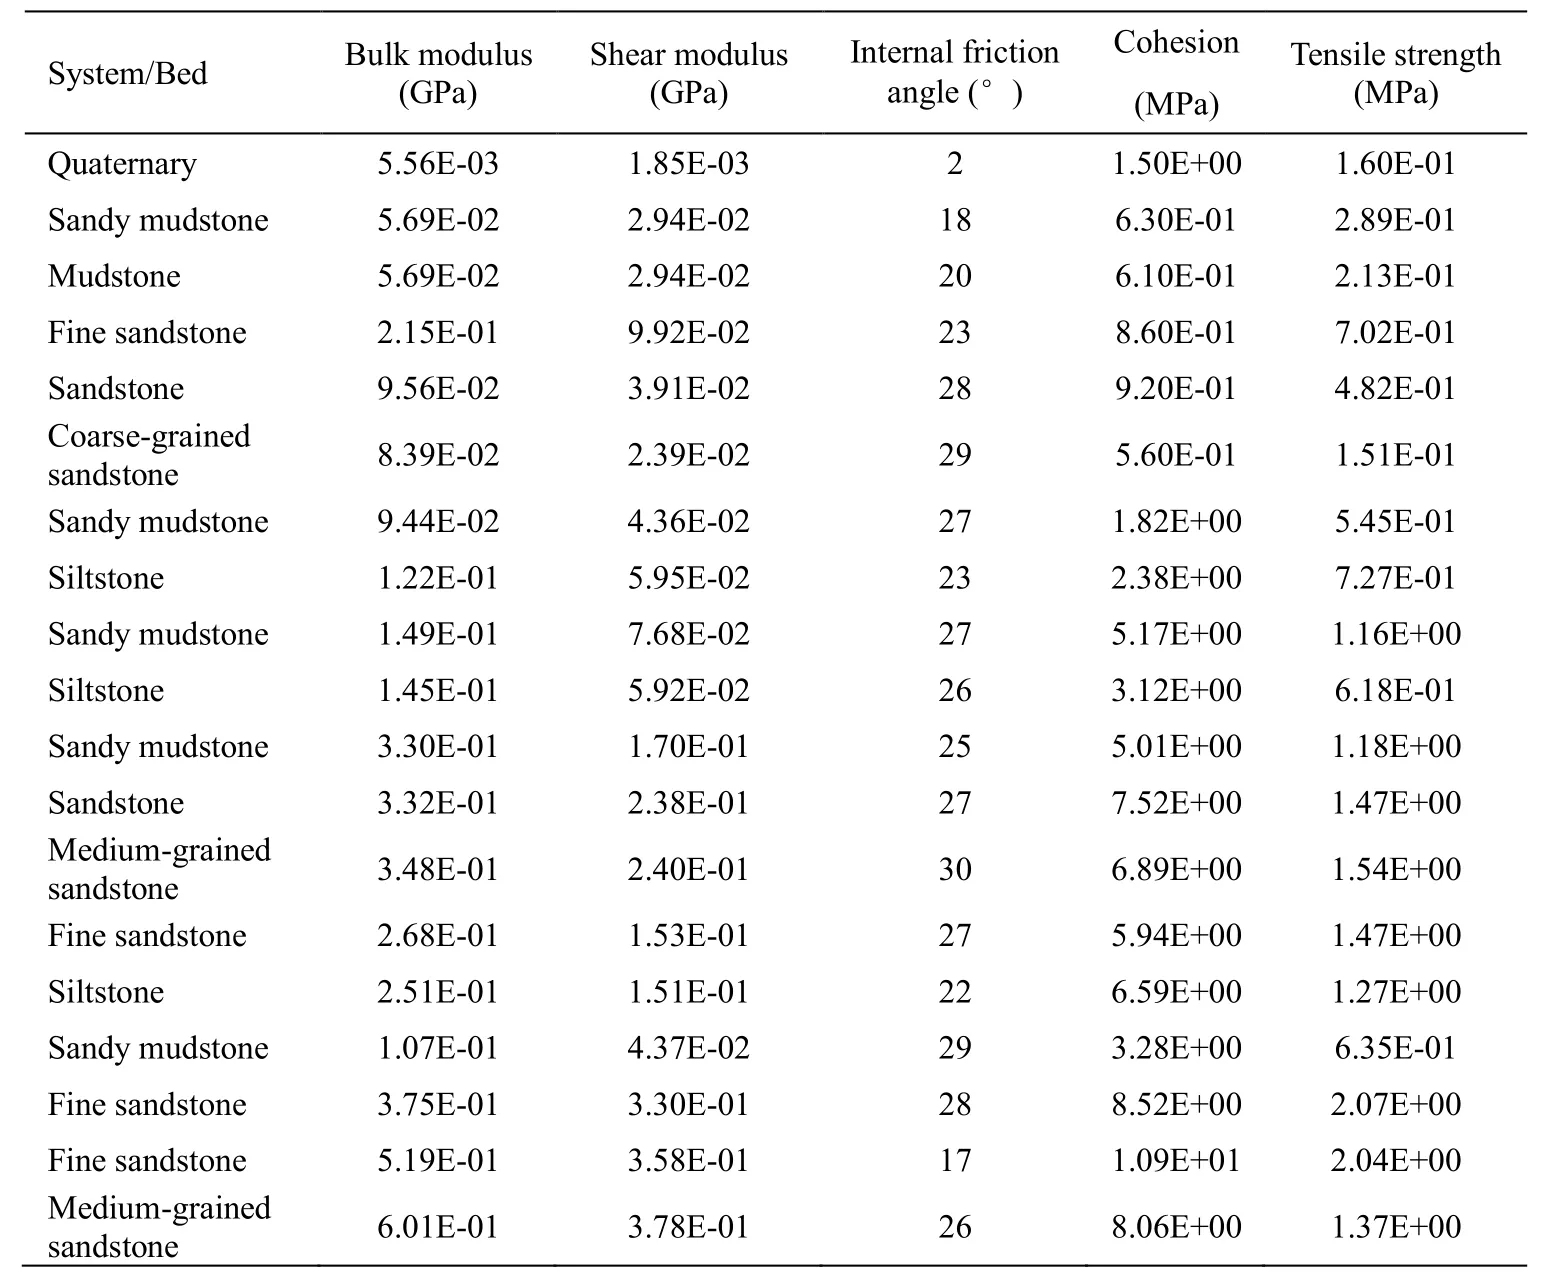
Table 2: Mechanical parameters used in the traditional FLAC3D model
Fine sandstone 3.97E-01 2.62E-01 23 3.19E+00 1.55E+00 Sandy mudstone 7.21E-01 3.14E-01 26 4.46E+00 1.86E+00 Sandstone 5.64E-01 3.55E-01 22 1.17E+01 1.58E+00 Siltstone 2.06E-01 8.98E-02 25 5.34E+00 1.13E+00 Sandy mudstone 4.52E-01 3.68E-01 28 8.51E+00 2.28E+00 Mudstone 5.10E-01 2.77E-01 32 4.75E+00 1.38E+00 Sandy mudstone 2.18E-01 8.92E-02 26 4.18E+00 1.28E+00 Medium-grained sandstone 2.18E-01 8.92E-02 26 4.18E+00 1.28E+00 Sandy mudstone 4.93E-01 3.70E-01 30 8.92E+00 1.94E+00 Siltstone 5.24E-01 4.27E-01 34 3.48E+00 2.06E+00 Sandy mudstone 4.06E-01 3.30E-01 34 6.89E+00 1.86E+00 Siltstone 1.12E-01 4.86E-02 27 5.72E+00 1.29E+00 Sandy mudstone 8.81E-02 4.54E-02 28 4.24E+00 1.15E+00 Siltstone 1.59E-01 1.14E-01 31 5.69E+00 1.52E+00 Sandy mudstone 3.81E-01 2.29E-01 21 7.08E+00 1.94E+00 Siltstone 4.12E-01 3.35E-01 23 6.66E+00 1.51E+00 Sandy mudstone 6.23E-01 3.56E-01 33 5.45E+00 1.99E+00 #2-2 coal seam 1.14E-01 5.27E-02 6 8.82E+00 6.42E-01 Floor of #2-2 coal seam 3.11E-01 2.33E-01 27 9.00E+00 1.88E+00
In the computational model, grid points with coordinates x=0 m or x=3800 m were not allowed to move along the x-axis; grid points with coordinates y=0 m or y=1800 m were not allowed to move along the y-axis; and grid points with the coordinate z=484.4 m were not allowed to move along the z-axis.Gravity along with the lateral stress coefficient at rest, k0, given by k0=μ/(1-μ), where μ is the Poisson’s ratio, were used to apply the in situ stresses [Xu, Kulatilake, Tian et al.(2013)].
Fig.11 shows the final modeling result based on the traditional method.The study area is divided into 50490 hexahedron zones, the different colors represent different lithologic rock layers, and a total of 46 rock layers with different mechanical properties were obtained.
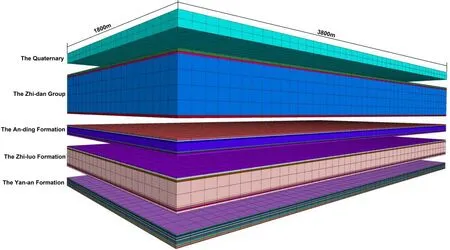
Figure 11: The FLAC3D model based on the traditional method
4.2 The FLAC3D modeling process based on the proposed method
The model range, constitutive model, yield criterion, boundary condition and initial stress of the data-intensive FLAC3Dmodel are consistent with those of the traditional model.However, the mechanical parameters of each rock layer in the data-intensive FLAC3Dmodel are determined by the method described in Section 3.4.Using the method described in Section 3.2, the x-y plane is divided into 16 sub-regions as shown in Fig.12.

Figure 12: The x-y plane division result of the YPH coal mine
The spatial coordinate data of 16 boreholes can be transformed into the data-intensive FLAC3Dmodel using the method described in Section 3.3, as shown in Fig.13.The different colors in Fig.13 represent different lithological rock layers, and the model is divided into 50388 hexahedron zones and 519 rock layers with different mechanical parameters.

Figure 13: The FALC3D model based on the proposed method
5 Comparison of the prediction results
The surface subsidence values of the YPH coal mine were observed four times when the working face was mined at the length of 186 m, 361 m, 478 m, and 594 m.Due to obvious errors in the first observation, only the last three times were used in this comparison, as shown in Fig.14, Fig.15 and Fig.16.
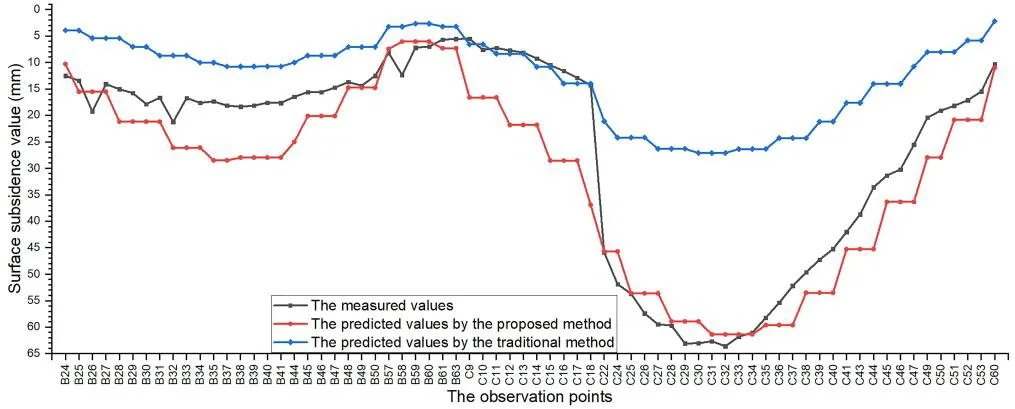
Figure 14: Comparison between the predicted and observed values when the working face was mined to 361 m
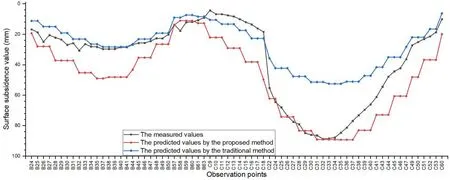
Figure 15: Comparison between the predicted and observed values when the working face was mined to 478 m
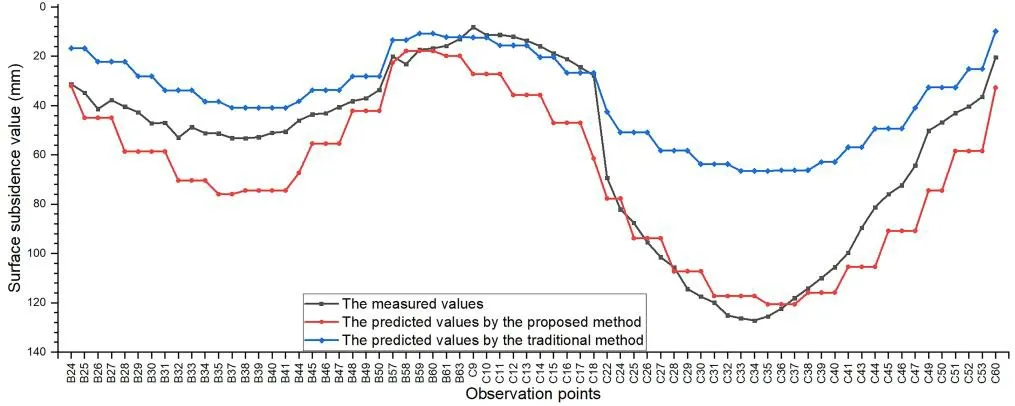
Figure 16: Comparison between the predicted and observed values when the working face was mined to 594 m
On the B observation line, the prediction result based on the proposed method is larger than the observed values, while the predicted values based on the traditional method are smaller than the observed values.On observation line C, the predicted values based on the proposed method are basically consistent with the measured values, which can reflect the surface maximum subsidence value (SMSV).Although the predicted values obtained by the traditional method are closer to the measured values on the edge of the observation line, the predicted SMSV is far from the measured value.

Table 3: Comparison of the SMSV
Whether the SMSV can be predicted is a critical index to evaluate the prediction model.As observed from Tab.3, the relative error of the SMSV based on the proposed method is very small.Compared with the traditional method, the relative error of SMSV decreased by 93.7%, on average.

Table 4: Standard deviation comparison of the 70 prediction points
It is observed from Tab.4 that when the prediction results of all 70 prediction points are compared, the prediction results based on the proposed method are still superior to those of the traditional method, and the average standard deviation is reduced by 39.4%.
Although the predicted values based on the proposed method is relatively large at some points, it can guarantee the project safety for engineering design.In summary, the dataintensive FLAC3Dmodel has obvious advantages.
6 Conclusions
The problem of oversimplification of rock masses exists in the traditional method of using FLAC to predict surface subsidence.Inspired by geospatial big data idea, a data-intensive FLAC3Dmodeling method is proposed by taking full use of geological drilling data.
In this study, a method to determine the model range is presented.Two principles for dividing the FLAC3Dmodel into sub-regions are proposed, and a method for subdividing the sub-regions along the z-direction is given.Also, the process of determining the mechanical properties of each rock layer is described.
Compared with the traditional prediction results, the relative error of the SMSV predicted by the proposed method decreased by 93.7%, and the standard deviation of the prediction results (which was 70 points) decreased by 39.4%, on average.The results show that the proposed method is of great significance for improving the accuracy of mining subsidence predictions.
Acknowledgments:This study was supported by the National Key Research and Development Program (Grant No.2018YFC0604704).
References
Alejano, L.R.; Ramirez-Oyanguren, P.; Taboada, J.(1999): FDM predictive methodology for subsidence due to flat and inclined coal seam mining.International Journal of Rock Mechanics and Mining Sciences, vol.36, no.4, pp.475-491.
Chen, M.; Mao, S.W.; Liu, Y.(2014): Big data: a survey.Mobile Networks and Applications, vol.19, no.2, pp.171-209.
Cheng, J.W.; Zhao, G.; Li, S.Y.(2018): Predicting underground strata movements model with considering key strata effects.Geotechnical and Geological Engineering, vol.36, no.1, pp.621-640.
Corkum, A.G.; Board, M.P.(2016): Numerical analysis of longwall mining layout for a Wyoming Trona mine.International Journal of Rock Mechanics and Mining Sciences, vol.89, pp.94-180.
Li, H.Z.; Guo, G.L.; Zha, J.F.; Yuan, Y.F.; Zhao, B.C.(2016): Research on the surface movement rules and prediction method of underground coal gasification.Bulletin of Engineering Geology and the Environment, vol.75, no.3, pp.1133-1142.
Li, S.N.; Dragicevic, S.; Castro, F.A.; Sester, M.; Winter, S.et al.(2016): Geospatial big data handling theory and methods: a review and research challenges.ISPRS Journal of Photogrammetry and Remote Sensing, vol.115, pp.119-133.
Li, H.Z.; Zhao, B.C.; Guo, G.L.; Zha, J.F.; Bi, J.X.(2018): The influence of an abandoned goaf on surface subsidence in an adjacent working coal face: a prediction method.Bulletin of Engineering Geology and the Environment, vol.77, pp.305-315.
Lohr, S.(2012): The age of big data.New York Times, pp.11.
Ma, C.Q.; Yin, D.W.; Li, H.Z.; Zhang, P.P.(2017): A numerical study on gangue backfilling mining in a thick alluvium soil environment.Journal of Residuals Science & Technology, vol.14, no.3, pp.64-75.
Ma, C.Q.; Li, H.Z.; Zhang, P.P.(2017): Subsidence prediction method of solid backfilling mining with different filling ratios under thick unconsolidated layers.Arabian Journal of Geosciences, vol.10, no.23, pp.511.
Itasca Consulting Group Inc.(2009): FLAC3D (Fast Lagrangian Analysis of a Continua in 3 Dimensions) User’s Manual.Version 4.00.
Pongpanya, P.; Sasaoka, T.; Shimada, H.; Wahyudi, S.(2017): Study of characteristics of surface subsidence in longwall coal mine under poor ground conditions in Indonesia.Earth Science Research, vol.6, no.1, pp.129-141.
Xu, N.X.; Kulatilake, P.; Tian, H.; Wu, X.; Nan, Y.H.et al.(2013): Surface subsidence prediction for the WUTONG mine using a 3-D finite difference method.Computers and Geotechnics, vol.48, pp.134-145.
Yuki, N.(2011): Following digital breadcrumbs to big data gold.http://www.npr.org/2011/11/29/142521910/thedigitalbreadcrumbs- that-lead-to-big-data.
 Computer Modeling In Engineering&Sciences2019年5期
- Computer Modeling In Engineering&Sciences的其它文章
- Optimization of Well Position and Sampling Frequency for Groundwater Monitoring and Inverse Identification of Contamination Source Conditions Using Bayes’ Theorem
- 3D Web Reconstruction of a Fibrous Filter Using Sequential Multi-Focus Images
- Frequency Domain Filtering SAR Interferometric Phase Noise Using the Amended Matrix Pencil Model
- Monitoring Multiple Cropping Index of Henan Province, China Based on MODIS-EVI Time Series Data and Savitzky-Golay Filtering Algorithm
- Inferring Spatial Distribution Patterns in Web Maps for Land Cover Mapping
- Exploring Urban Population Forecasting and Spatial Distribution Modeling with Artificial Intelligence Technology
