Inferring Spatial Distribution Patterns in Web Maps for Land Cover Mapping
Yang Liu, Zeying Lan and Hanfa Xing
Abstract: Web maps represent an effective source for land cover mapping in capturing human activities.However, due to spatial heterogeneity, previous research has mainly focused on generating land cover maps in partial areas.Inferring spatial distribution patterns in Web maps may provide an alternative perspective on improving map production on a larger scale.This paper represents a novel approach to investigating the spatial distribution in Web maps for land cover mapping.First, linear features from Web maps are utilised to delineate parcels with insufficient Web map data for classification.Then, spatial factors are constructed from point and polygon features to identify the spatial variety of Web maps, with an artificial neural network classifier being adopted to classify land cover automatically.Land cover mapping is finally proposed by combining classified parcels and existing polygon features.The proposed method is applied in Guangzhou, Guangdong Province, using a Web map from AutoNavi.The results show an approximately 88% classification accuracy and an overall mapping accuracy of 85.06%.The results indicate that the proposed approach has the potential to be utilised in land cover mapping, and the constructed spatial factors are effective at characterising land cover information.
Keywords: Land cover mapping, Web maps, spatial distribution, spatial factors, ANN classifier.
1 Introduction
Land cover is a key environmental information for a variety of social needs, which range from natural resource management, urban planning, climate change modelling to sustainable development [Chen, Chen, Liao et al.(2015); Chen, Li, Wu et al.(2017)].As an important determinant of human activities on the land systems, land cover usually varies irregularly at different scales and temporal frequencies [Cihlar (2000)], which leads to a high potential for uncertainty.Consequently, the demand for land cover mapping corresponding to social benefits has been increasingly recognised in variable domains [Friedl, McIver, Hodges et al.(2002); Bartholomé and Belward (2005)].
Land cover mapping has witnessed a long period of investigation.Conventionally, remote sensing is considered a reliable tool to generate land cover maps because of the wide availability, high spatial and spectral resolution and automatic classification process [Rogan and Chen (2004); Wulder, White, Goward et al.(2008); Giri, Pengra, Long et al.(2013); Hansen, Potapov, Moore et al.(2013)].The different approaches of land cover mapping are primarily conducted in two perspectives: pixel-based and object-based classification.In general, spectral information and textural properties are utilised as significant indicators in pixel-based classification [Shaban and Dikshit (2001); Lu and Weng (2006)], while object-based classification mainly involves more complex processes including image segmentation and feature extraction as well as a variety of classification methods [Blaschke (2010); Ma, Li, Ma et al.(2017)].Currently, a variety of methods for land cover mapping have been proposed in many studies based on these two perspectives [Ban and Jacob (2013); Chen, Wu, Li et al.(2013)].However, as only coarse levels of spatial distribution and semantic features from ground components can be monitored, remote sensing usually concentrates on capturing physical properties instead of human activity, which is one of the main causes of land cover changes [Hu, Yang, Li et al.(2016); Liu, He, Yao et al.(2017)].Considering the limitations in mining land cover information, it is necessary to focus on the investigation of more effective data sources that enable capturing social activities, which are required for land cover mapping.
Thanks to the rapid utilisation of Internet technologies and mobile devices, a variety of data from Web maps including OpenStreetMap (OSM), Google Maps and AutoNavi are massively generated, and they have been investigated for their usability in human activity analysis under different purposes [Zheng, Capra, Wolfson et al.(2014); Liu, Liu, Gao et al.(2015)].In general, Web maps infer to the variable generated data delivered by geographic information systems (GIS) in World Wide Web.The delineation and depiction of human activities in Web maps are inspired by the large amounts of dynamic data, which are usually generated and displayed in Web maps in real time and can reflect spatio-temporal patterns.For instance, trajectory data, which are capable of positioning continuous locations of human activities, are widely used in analysing citizen movement and intra-urban trip patterns [Liu, Kang, Gao et al.(2012); Kang, Liu, Guo et al.(2015)].In addition, social media check-ins enable the ability to explore spatial interactions as well as analysing land use in urban areas [Frias-Martinez and Frias-Martinez (2014); Liu, Sui, Kang et al.(2014)].Despite the fact that these user-generated dynamic data contain sufficient human activity, they actually cannot reflect the surrounding environments directly or correspond the activities to specific physical properties.Therefore, there remain difficulties in deriving land cover information from dynamic data.
With regard to these issues, it is essential to consider the potential of static data in Web maps including point (e.g., points of interest), linear (e.g., roads) and polygon features (e.g., green land), as they represent identical locations and environments, which can be inferred by human activities.Despite that Web maps may reflect more detailed information than land cover, such as land use classes, the nomenclatures between land cover and land use are far beyond consistence.Thus, specific concerns for mapping land cover classes are required with the utilisation of Web data.In fact, point features, such as points of interest (POIs), have been investigated in variable land cover applications [Meng, Hou and Xing (2017); Xing, Meng, Hou et al.(2017); Xing, Meng, Hou et al.(2017)].Existing research has revealed the usability of POIs in Web maps for classifying different land cover classes in typical regions [Xing, Meng, Hou et al.(2017)].Based on this hypothesis, researchers have employed classified POIs for the application of land cover validation, especially in the regions where POIs were distributed in spatial heterogeneity [Xing, Meng, Hou et al.(2017)].This is also the case in land cover change detection, in which changes that are significantly influenced by human activities can be accurately captured by the identification of Web maps [Meng, Hou, Xing et al.(2017)].These researches conduct promising results to utilise Web maps for further land cover explorations.However, the above studies only demonstrated the usability of point features from Web maps in land cover applications in partial areas, and the potential of linear and polygon features has not been considered yet.Moreover, the existing studies ignored the spatial distribution of different features, which requires further investigations to facilitate land cover mapping at a larger scale.
Faced with the disadvantages in the aforementioned land cover applications, the utilisation of static data from Web maps in land cover mapping has been further explored by many studies [Fonte, Minghini, Antoniou et al.(2016);Fonte, Minghini, Patriarca et al.(2017); Fonte, Patriarca, Minghini et al.(2017)].Existing study has investigated polygon features from Web maps for land cover classification [Estima and Painho (2013)].Others have extracted point, linear and polygon features from OSM and converted these features to different land cover nomenclatures based on the semantic information.Additionally, a spatial conversion process was established to generate polygon features for each land cover class from existing point and linear features [Fonte, Minghini, Antoniou et al.(2016); Fonte, Patriarca, Minghini et al.(2017)].Based on the proposed land cover mapping process, one research demonstrated the usability of OSM to generate up-to-date and detailed land cover maps [Fonte, Minghini, Patriarca et al.(2017)].The production of these maps was supplemented by the existing land cover classes in GlobeLand30 [Chen, Ban and Li (2014)].Although these studies have proved the possibility of employing point, linear and polygon features from Web maps, they can only be utilised for land cover mapping in partial areas, because of the spatial heterogeneity of Web maps [Estima and Painho (2015); Fonte, Bastin, See et al.(2015)].As a result, challenges still exist in mapping land cover classes, especially at a larger scale.
In fact, inferring spatial distribution patterns among Web maps may provide an alternative perspective to solve this problem.As shown in Fig.1, both regions contain static data from Web maps, which are apparently not capable of depicting the whole area.However, the high density of POIs, which contains commercial related semantic information, might give a cue of artificial surfaces (Fig.1(b)) in the area without containing data in Fig.1(a).Meanwhile, a low density of POIs containing cropland related categories and a short distance to water body polygons is displayed in Fig.1(c), indicating the possibilities that the wide regions among water bodies belong to cultivated land and forest (Fig.1(d)).Accordingly, constructing the spatial factors to infer spatial distribution patterns of Web maps might be an effective approach for land cover mapping.
Therefore, by inferring spatial distribution patterns from Web maps, this paper represents a novel approach for land cover mapping.As land cover information is generally planned and changed by human activities in a road network level, parcels that contain insufficient data from Web maps are first delineated for land cover classification by linear features (i.e., roads).Spatial factors are then constructed from point and polygon features as sufficient indicators and are utilised in an artificial neural network (ANN) classifier in each parcel to classify land cover automatically.Finally, the classified parcels are combined with existing polygon features for land cover mapping.
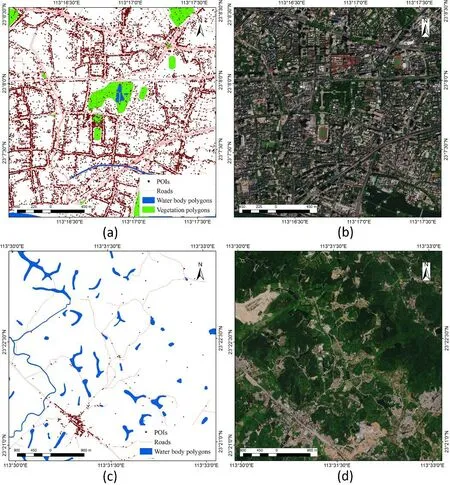
Figure 1: Distribution of data in Web maps in partial regions.(a) Web maps in built-up areas; (b) High resolution images in built-up areas; (c) Web maps in other areas; (d) High resolution images in other areas
2 Methodology
Web maps usually contain three kinds of components, namely, point features (such as POIs), linear features (such as roads) and polygon features (including vegetation polygons, and water body polygons).As POIs, vegetation polygons and water body polygons only exist in partial regions to identify typical spots, the clustering of POIs and the utilisation of these polygons cannot meet the requirement of land cover mapping at a large scale.This study proposes a novel approach for land cover mapping by inferring spatial distribution patterns from Web maps.While Section 2.1 introduces the study area and experimental data in this paper, the following sections present the four steps of the proposed methodology (Fig.2).The first section utilises linear features from Web maps to delineate parcels for land cover mapping.These parcels are considered basic units of land cover classes, which are demonstrated in Section 2.2.To classify land cover class in each parcel, spatial factors, including point density, point aggregation and distance to polygons, are constructed using point and polygon features in Web maps in the second step.The detailed explanation for spatial factor construction is shown in Section 2.3.In the next step, these features are applied into an ANN classifier for land cover classification.The classified parcels are combined with polygon features for land cover mapping.In this way, the data in Web maps can be converted into regions with typical land cover classes.The approach is proposed in Section 2.4.The final step is to evaluate accuracy of land cover mapping proposed by our method, which is proposed in Section 2.5.
The approach described below is implemented in our research using ArcGIS 10.5 and R on Windows 10×64.The source code of the ANN classifier is available at https://CRAN.R-project.org/package=nnet.
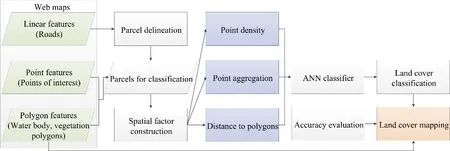
Figure 2: The framework of the methodology
2.1 Study area and experimental data
The study area in this paper is in Guangzhou, Guangdong Province, China.As it covers a wide range of areas, namely, 7434.4 km2, a variety of land cover classes with different landscapes are involved in this region.Given the land cover distribution derived from GlobeLand30 in 2010 [Chen, Ban and Li (2014)], seven classes including cultivated land, forest, grassland, shrubland, wetland, water bodies and artificial surfaces are classified.This paper aims to map three land cover classes because the experimental data in Web map we utilise are limited to classify vegetation and water bodies into more detailed classes, i.e., vegetation, water bodies and artificial surfaces.Specifically, cultivated land, forest, grassland and shrubland are merged into vegetation.Wetland is included in water bodies.We maintain the nomenclature of artificial surfaces in GlobeLand30 in this study.The limitation of the proposed classification nomenclature will be discussed in Section 4.Data from Web maps are collected in the year of 2016 from AutoNavi (https://ditu.amap.com/).The quality of this experimental data can be relatively ensured because they are officially generated for navigational purposes.Three basic kinds of data are involved including point features, linear features and polygon features.In particular, point features contain 795719 POIs and polygon features involve 1834 vegetation polygons as well as 3736 water body polygons.And a variety of roads belong to linear features.The distribution of experimental data is shown in Fig.3.One can see that the data are displayed with spatial heterogeneity.For example, POIs and roads are distributed with a much high density in build-up areas compared with other data located in a low density in non-built-up area.Accordingly, our proposed approach is applied with experimental data in Guangzhou, and the results are displayed in the following sections.
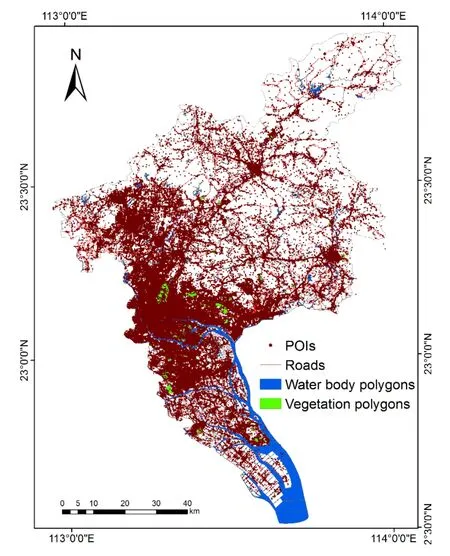
Figure 3: Data from Web maps of Guangzhou
2.2 Delineating parcels from roads for land cover mapping
As human activities and planning have become one of the vital indicators in land cover changes and arrangement, roads play an important role in land cover delineation.This study employs linear features (i.e., roads) to split parcels, which contain data from Web maps (like point features and polygon features) for land cover classification and mapping.Regarding to parcel delineation, a variety of roads are utilised to extract and abstract effective data for parcel generation.The first is merging multiple roads.As multiple roads are usually located horizontally in the same traffic line, the average distance between horizontal roads is measured and utilised to generate road polygons with buffering.The second step is extracting centre lines from road polygons, which are considered basic units to delineate different parcels for land cover mapping.
However, parcels for classification are not required in the regions where polygon features exist, as polygon features usually contain typical land cover classes, which can be directly used in land cover mapping.Therefore, the overlapping regions, which are delineated by roads, are merged and removed from the parcels.These regions will be directly utilised to map land cover according to the corresponding polygon features.
2.3 Constructing spatial factors with Web maps
As data from Web maps are usually insufficient with respect to spatial heterogeneity for most of the delineated parcels in Section 2.1, the spatial distribution patterns of Web maps are analysed for land cover mapping.In this section, point features and polygon features from Web maps are utilised by proposing three spatial factors, including point density, point aggregation and distance to polygons.Both point density and point aggregation are used for characterising point features in Web maps.In particular, as point features (such as POIs) usually contain a variety of land cover information, they are separated into different land cover classes for the purpose of calculate point density as well as aggregation for each class.The third spatial factor is distance to polygons, which is performed to measure the distribution among parcels and polygon features.Specifically, distances to each kind of polygon feature are calculated separately.The above spatial factors will be constructed for each land cover class in the following sections.
2.3.1 Point density
For point density, the amount and allocation of points with different land cover classes when faced with variable scales of parcels are examined.Parcels usually contain a variety of points corresponding to different class, so several spatial factors of point density are proposed, reflecting landscape diversity in the delineated parcels.For instance, points corresponding to artificial surfaces usually show a relatively high density in a built-up area, whereas a much lower point density have more tendency to be found in vegetation, such as grasslands and forests.Thus, the allocation of variable points can be significant indicators in characterising land cover classes.Generally, point density can be defined as

where Densitykrefers to point density for the kth land cover class.Nkrepresents the number of points belonging to the kth class.Aiindicates the area of the ith parcel delineated from roads.
2.3.2 Point aggregation
Point aggregation refers to the contagion of points, illustrating the spatial distribution of points in a given region.In general, points that are displayed in a clustered distribution usually show a high degree of aggregation.Those sparsely distributed ones tend to be less aggregated.This factor is considered for land cover mapping because different land cover classes may represent variable point distribution, with a large amount of points located intensively in artificial surfaces and several points distributed in a larger scale referring to forest or grassland.Consequently, effective measurements are necessary to capture the spatial distribution of points.Previous studies have proposed contagion metrics to measure data aggregation [O'Neill, Krummel, Gardner et al.(1988); Li and Reynolds (1993)].However, these metrics are specialised in characterising landscape patches (i.e., polygon features) instead of point features.To measure the aggregation of point features, a factor of point aggregation is proposed as follows:

where Aggregationkrepresents point aggregation for the ith land cover class.Sf(x)>0refers to regions S where the value of the calculated kernel density f(x) [Oliver and Gotway (2005)] is larger than 0.In the calculation of kernel density, h refers to the bandwidth, which determines the areas of point features distribution.Here, h is set as 200 metres.The value of which is determined by the distribution of shortest distance among points, with most of the distances being less than 200 metres.n indicates the number of points, which are included in the bandwidth.Besides, k(·) represents kernel function.x and xirefer to the positions of point features that are to be estimated within bandwidth h.
2.3.3 Distance to polygons
For the distance to polygons, the shortest distance between parcels and polygon features are considered as another factor for land cover mapping.While the density and aggregation of point features illustrate the inner spatial characters in each parcel, distance to polygons represent the distribution between the target parcel and neighbourhood parcels.For example, cultivated land tends to be selected near water bodies such as rivers, whereas many grassland areas are surrounded outside the forest.Furthermore, each kind of polygon feature usually contains a typical land cover class, which can be considered as indicators to measure the distances to each unclassified parcel.Consequently, the distance to polygons is introduced as one of the spatial factors for land cover mapping.
2.4 Classifying land cover with spatial factors using ANN classifier
In this section, an effective machine-learning based approach, namely, an ANN classifier, is utilised to classify land cover automatically.Generally, ANN, which is inspired by the biological neural networks, is based on the construction of connected artificial neurons.The classification proposed by ANN is through adjusting typical weights among artificial neurons in the learning process.The framework of land cover classification using ANN classifier is elaborated in Fig.4.Specifically, spatial factors constructed with Web maps are considered as the input data and further utilised into an ANN classifier for automatic land cover classification.Since the ANN classifier works best when the values of spatial factors are scaled to a narrow range around zero [Sola and Sevilla (1997)], a normalisation process with spatial factors is proposed as follows:

With regard to building the single hidden layer, number of artificial neurons remains uncertain.As one of the basic units in the ANN classifier, the artificial neuron is defined as follows:

where viand y(v) represents the ith input and output values of the artificial neuron.n infers to the number of input values, and wicontrols the weight of the ith input value.f(·) refers to the activation function of the ANN classifier.Here, a sigmoid activation function is selected for ANN classification.To choose the proper number of artificial neurons, iterations with artificial neuron number N∈[1,100] are proposed for acquiring each classification accuracy.In general, an artificial neuron number N with a higher training and testing accuracy is preferred for building an ANN classifier.

Figure 4: The framework of land cover classification using ANN classifier.
2.5 Accuracy evaluation
For accuracy evaluation, reference points for validation are selected using a stratified random sampling.To calculate sampling size population, the method proposed by Foody [Foody (2009)] is applied to generate a total sampling set.The number of reference points in each land cover class is determined by the percentage of area in a typical class among the total region.Based on the selected reference points, land cover class with each point is visually interpreted using high resolution images from Google Earth, which are in the same year as the Web maps.The differences between the reference points and land cover mapping results are calculated using a confusion matrix, quantifying accuracies including producer’s accuracy, user’s accuracy, overall accuracy and kappa coefficient.
Specifically, producer’s accuracy refers to the map accuracy from the perspective of map maker, which is the number of samples classified correctly divided by the total number of samples for that class.User’s accuracy is calculated by taking the total number of correct samples for a class and dividing it by the row total.In addition, overall accuracy is determined by taking the accurately classified samples in each class and dividing it by the total samples.
3 Results
3.1 Parcel delineation and spatial factor construction
To delineate parcels for land cover classification, a variety of roads are extracted from the Web map, including main roads, second roads, county roads, railways and national roads, etc.Part of the delineated parcels is displayed in Fig.5.A total number of 26233 parcels are generated for land cover classification.After removing 5570 parcels, which are overlapped with vegetation and water body polygons, 20663 parcels remained as effective units for classification.In general, small parcels are usually delineated in built-up area, while other regions mostly contain much larger parcels, in which mixed land cover classes may exist.
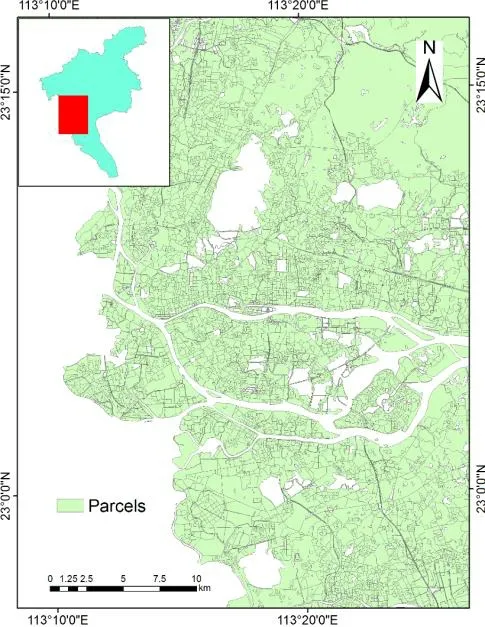
Figure 5: Part of the delineated parcels from roads in Guangzhou
Based on the delineated parcels, a semantic classification process is first proposed in point and polygon features from Web maps.As water body and vegetation polygons can be directly utilised for land cover mapping, only POIs are classified into different land cover classes.Among the total number of 795719 POIs, 789525 of them are classified as artificial surfaces, along with 3468 POIs being classified as vegetation and 461 POIs being divided into water bodies.The remaining 2265 POIs are excluded from this study because they are not representative as a unique land cover class.Moreover, POIs that are classified as water bodies are also not considered, as many of them are actually located beside water bodies, which bring more uncertainty in land cover mapping.Therefore, data from Web map, including POIs for artificial surfaces and vegetation as well as polygons related to vegetation and water bodies, are involved in spatial factor construction.
With regard to the classified data from the Web map, three types of spatial factors are constructed, including point density for artificial surfaces and vegetation, point aggregation for artificial surfaces and vegetation as well as distance to vegetation and water bodies.These spatial factors are visualised using a boxplot, which are shown in Figs.6(a), 6(b) and 6(c).One can see that all of the spatial factors represent much lower values of the first quartile, median and third quartile, indicating an apparent clustering within 75% of the values.However, it is followed by a long tail of higher values.The distribution of these spatial factors reveals the significant differences of spatial factors in land cover parcels, illustrating distinguishable characters among different classes.For example, high values in point aggregation for artificial surfaces usually exist in built-up areas, whereas vegetation areas often contain much lower values.Consequently, it is regarded as a cue of utilising these spatial factors in land cover mapping.
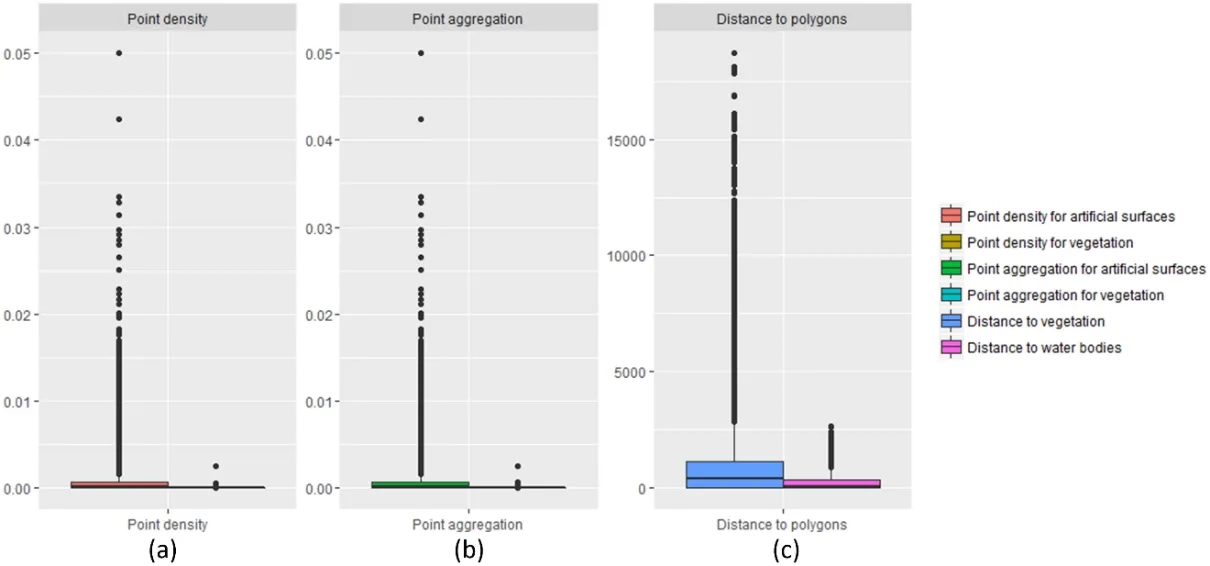
Figure 6: Boxplot visualisation of spatial factors derived from Web maps.(a) Boxplot visualisation for point density.(b) Boxplot visualisation for point aggregation.(c) Boxplot visualisation for distance to polygons
3.2 Land cover classification with ANN classifier
With regard to classifying land cover automatically, the spatial factors that were constructed in Section 3.2 are utilised in an ANN classifier.In particular, the aim of building an ANN classifier is to distinguish two land cover classes including vegetation and artificial surfaces from parcels without classification.For those polygon features, which have already represented typical land cover classes, they are directly utilised in land cover mapping without using an ANN classifier.
Basically, 800 parcels are chosen with 400 of them being divided into training data and the other parcels belonging to testing data.Based on these parcels, effective artificial neurons are required to be calculated.Fig.7 shows classification accuracies of both training data and testing data, with the number of artificial neurons set as [1,100] in hidden layer.The overall accuracy is between 0.85 and 0.93, indicating no significant changes in these iterations.However, an apparent tendency is that the gap between training and testing accuracy becomes much wider when the number of artificial neurons increases from approximately 5 to 100.This wider accuracy gap indicates a model overfitting, which causes uncertain results in land cover classification.Therefore, 5 artificial neurons are established in a hidden layer in the ANN classifier to classify land cover.
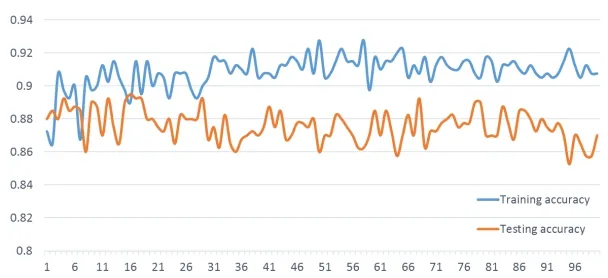
Figure 7: Classification accuracy with different artificial neurons in the hidden layer (X axis: Number of artificial neurons; Y axis: Classification accuracy)
Despite the fact that the number of artificial neurons has been determined, the stabilisation of the ANN classifier should be evaluated, since the classifier usually does not generate exactly the same results during each iteration of the classification process.Thus, the ANN classifier with 5 artificial neurons in the hidden layer is repeatedly constructed with 100 iterations.Fig.8 displays the classification accuracy among 100 classification process.Relatively stable changes are shown in both training and testing accuracy.Furthermore, no significant overfitting trends are shown in each classification process as most of the testing accuracies are close to the training ones.Accordingly, the ANN classifier with 5 artificial neurons in hidden layer is reliable when utilised in land cover classification.
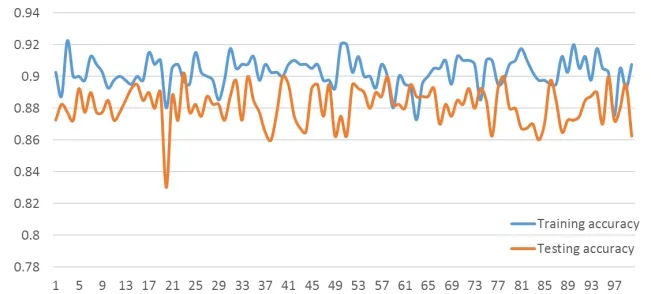
Figure 8: Classification accuracy with 5 hidden nodes within 100 iterations (X axis: Number of classification iterations; Y axis: Classification accuracy)
When the number of artificial neurons in hidden layer is determined, one of the classification processes in Fig.8 is selected.Both the detailed classification accuracy of training data and testing data are displayed in Tab.1 and Tab.2.An overall accuracy of 88.8% and 88.5% is obtained, which is consistent with the result in Fig.7.

Table 1: Land cover classification accuracy with training data

Table 2: Land cover classification accuracy with testing data
3.3 Land cover mapping and accuracy evaluation
Existing polygon features and classified parcels in Section 3.3 are merged for land cover mapping.In particular, data from Web map (shown in Figs.1(a) and 1(b)) are converted into land cover map, which are displayed in Figs.9(a) and 9(b).It indicates that although there is a lack of data in some regions; data from Web maps can be employed in land cover mapping once the spatial distribution is considered.Moreover, the entire land cover mapping in Guangzhou is shown in Fig.10.
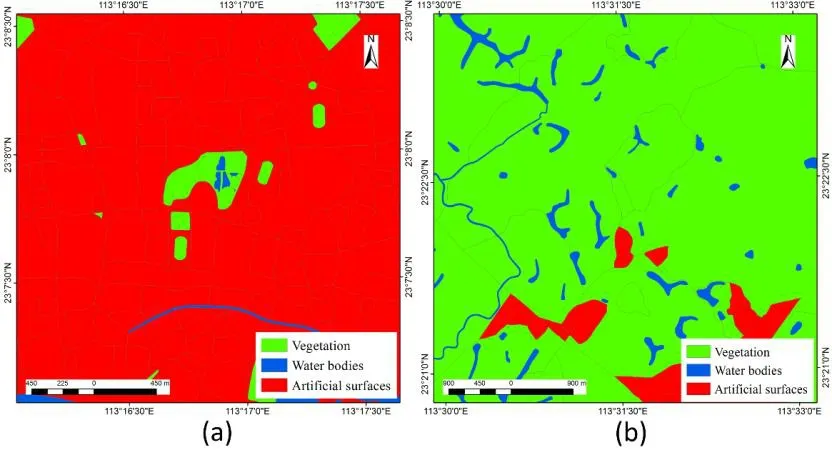
Figure 9: Land cover mapping in partial regions.(a) Land cover mapping in built-up areas; (b) Land cover mapping in other areas
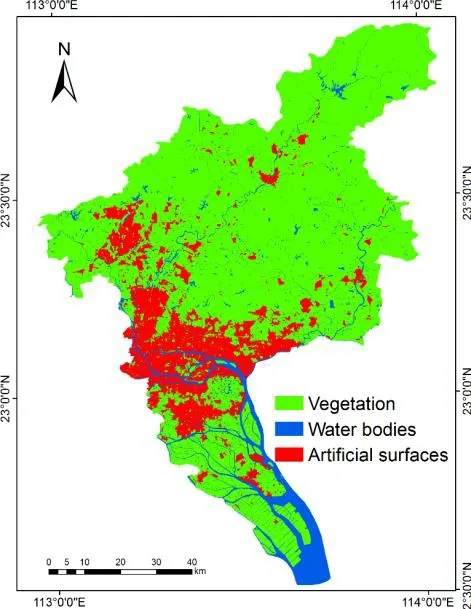
Figure 10: Land cover mapping in Guangzhou
To evaluate land cover mapping accuracy, a stratified random sampling approach is applied in the study area.Tab.3 shows the selected reference points in each class, which are determined by the percentage of land cover area in the total regions.Specifically, 134 points, 14 points and 26 points are generated for vegetation, water bodies and artificial surfaces, respectively.

Table 3: Selected reference points for accuracy evaluation
The land cover mapping accuracy is displayed in Tab.4.In terms of the accuracy in each class, vegetation acquires a relatively higher mapping accuracy; with the producer’s accuracy and user’s accuracy being 93.60% and 87.31%, separately.Although the user’s accuracy in water bodies is 100.00%, the producer’s accuracy decreases to 73.68%.For artificial surfaces, both producer’s accuracy and user’s accuracy are much lower: 56.57% and 65.38% respectively.On the other hand, the results reveal an overall accuracy of 85.06% and a kappa coefficient of 0.638.These land cover assessments illustrated that utilising data from Web maps with the proposed spatial factors is reliable for land cover mapping.

Table 4: Land cover mapping accuracy
4 Discussion
This paper proposes an effective approach to land cover mapping by inferring spatial distribution patterns in Web maps.Although satisfying results have been obtained, several issues still exist and should be solved in further studies, which are listed as follows:
(1) The first concern comes from the data sources of the Web maps.The experimental data used in this study are collected from AutoNavi, which provides navigation services in China.Other data sources in the world such as OpenStreetMap, Google Maps also provide the required point, linear and polygon features for land cover mapping.This to some extent ensures the usability of Web maps and provides potential to be utilised with the proposed approach wherever Web maps are available.Besides, despite the fact that Web maps are usually updated in real time and that it is difficult to extract the same datasets, the latest data sources show advantages to representing the state-of-the-art land cover classes.
(2) Only limited land cover classes are classified and mapped in this study.Basically, vegetation and artificial surfaces are classified through an ANN classification process using the constructed spatial factors.These classified parcels are combined with the existing water bodies and several vegetation polygons in Web maps for land cover mapping.As a result, three land cover classes including vegetation, water bodies and artificial surfaces are represented in map generation.To fill this gap, multi-sourced data from Web maps can be involved in a more detailed land cover classification.For example, as geo-tagged photos from the Internet can capture a variety of landscapes; they provide the potential to be involved in point features in classification [Antoniou, Fonte, See et al.(2016); Sitthi, Nagai, Dailey et al.(2016); Xu, Zhu, Fu et al.(2017)].
(3) Spatial factors should be further modified to classify more land cover classes.In this study, three types of spatial factors are constructed to automatically classify vegetation and artificial surfaces.When more detailed land cover classes are involved, efficient spatial factors corresponding to these classes are required.For example, cultivated land might be identified by deriving cultivation-related Web map data with semantic information, and constructing effective spatial factors such as the degree of aggregation for cultivated land as well as the diversity based on the spatial distribution of the extracted data.In addition, the properties of Web map features can provide a new perspective of representing different land cover classes.Assigning meaningful weights to each type of feature is also an effective approach to both classify more land cover classes and increase mapping accuracy.To improve our approach, these issues will be considered and solved in future studies.
(4) Linear features (i.e., roads) are only considered as the basic units for land cover region delineation.As land cover changes are deeply influenced by human activities, the road distribution plays an important role in detecting land cover boundaries and splitting land cover parcels.On the other hand, although roads should be classified as artificial surfaces, most of them cannot meet the standard of MMU (minimum mapping unit) in artificial-surface mapping based on the existing land cover nomenclatures.For example, the MMU established in GlobeLand30 allows a minimum unit of 4*4 (0.0144 km2) [Chen, Chen, Liao et al.(2015)], which is much larger than the road width.Therefore, roads are only applied in land cover parcel delineation instead of land cover mapping in this study.
(5) Vegetation and water body polygons in Web maps are utilised basically for two purposes.The first is inferring spatial distribution patterns with other Web map data for spatial factor construction.The locations of these polygons and distributions among other data give a clue of land cover class identification.The second is applying vegetation and water body polygons in land cover mapping.As it avoids land cover classification process, the cost and time in map production can be reduced.However, as polygon features cannot represent detailed land cover classes (such as vegetation polygons including all vegetation related land cover), it limits the generation of fine-scaled land cover maps.Future studies will focus on this issue by integrating multi-sourced data to further delineate the existing polygon features.
5 Conclusions and future work
The massive amounts of Web maps provide opportunities to generate land cover maps related to human activities.However, because of the spatial heterogeneity of these data, current researches have only focused on generating land cover maps in partial regions.Inferring spatial distribution patterns in Web maps provides an alternative perspective to solve this issue.In this paper, we propose a novel approach for land cover mapping using Web maps.Linear features (i.e., roads) are first utilised to delineate parcels, which are considered basic units for land cover mapping.It is followed by constructing spatial factors from point features and polygon features.By inferring spatial distribution of Web maps, spatial factors are calculated from each parcel, and then applied into the ANN classifier to classify land cover class automatically.Finally, existing polygon features are then combined with classified parcels for land cover mapping.As a case study, a Web map derived from AutoNavi is utilised for mapping Guangzhou, Guangdong Province.Three types of spatial factors are constructed, including point density for vegetation and artificial surfaces, point aggregation for vegetation and artificial surfaces, as well as distance to water bodies and vegetation.The result reveals a classification accuracy of approximately 88% of the ANN classifier, along with an overall mapping accuracy and kappa coefficient of 85.06% and 0.638, respectively, which indicates the potential of utilising Web maps with spatial factors for land cover mapping.
The proposed approach provides a novel approach to map land cover by depicting spatial distribution patterns in Web maps.With regard to the availability of Web maps in other regions such as OSM, we will consider mapping land cover classes outside of China, even at a global scale.Besides, as the potential usability of Web maps has been proven in land cover mapping, future works will consider utilising the proposed method into other land cover applications, such as change detection and land cover validation.Besides, Web maps contain massive amounts of detailed semantic information, which are related to urban function, and thus, they offer opportunities to apply these data into urban land use analysis.Particularly, as spatial distribution patterns of Web maps in urban areas might be correlated with socioeconomic changes, human movement, urban planning and other factors, the integration of both semantic and spatial information may provide a new perspective in urban studies.
Acknowledgement:This research was supported by the National Natural Science Foundation of China (Grant Nos.41501420, 41301377).
References
Antoniou, V.; Fonte, C.C.; See, L.; Estima, J.; Arsanjani, J.J.et al.(2016): Investigating the feasibility of geo-tagged photographs as sources of land cover input data.ISPRS International Journal of Geo-Information, vol.5, no.5, pp.64.
Ban, Y.; Jacob, A.(2013): Object-based fusion of multitemporal multiangle envisat asar and hj-1b multispectral data for urban land-cover mapping.IEEE Transactions on Geoscience and Remote Sensing, vol.51, no.4, pp.1998-2006.
Bartholomé, E.; Belward, A.S.(2005): Glc2000: A new approach to global land cover mapping from earth observation data.International Journal of Remote Sensing, vol.26, no.9, pp.1959-1977.
Blaschke, T.(2010): Object based image analysis for remote sensing.ISPRS Journal of Photogrammetry and Remote Sensing, vol.65, no.1, pp.2-16.
Chen, J.;Ban, Y.; Li, S.(2014): China: open access to earth land-cover map.Nature, vol.514, no.7523, pp.434.
Chen, J.; Chen, J.; Liao, A.; Cao, X.; Chen, L.et al.(2015): Global land cover mapping at 30m resolution: A pok-based operational approach.ISPRS Journal of Photogrammetry and Remote Sensing, vol.103, pp.7-27.
Chen, J.; Li, S.; Wu, H.; Chen, X.(2017): Towards a collaborative global land cover information service.International Journal of Digital Earth, vol.10, no.4, pp.356-370.
Chen, J.; Wu, H.; Li, S.; Liao, A.; He, C.et al.(2013): Temporal logic and operation relations based knowledge representation for land cover change web services.ISPRS Journal of Photogrammetry and Remote Sensing, vol.83, pp.140-150.
Cihlar, J.(2000): Land cover mapping of large areas from satellites: Status and research priorities.International Journal of Remote Sensing, vol.21, no.6-7, pp.1093-1114.
Estima, J.; Painho, M.(2013): Exploratory analysis of openstreetmap for land use classification.Proceedings of the Second ACM SIGSPATIAL International Workshop on Crowdsourced and Volunteered Geographic Information, pp.39-46.
Estima, J.; Painho, M.(2015): Investigating the potential of openstreetmap for land use/land cover production: a case study for continental portugal.Openstreetmap in Giscience, pp.273-293.
Fonte, C.C.; Minghini, M.; Antoniou, V.; See, L.; Patriarca, J.et al.(2016): Automated methodology for converting osm data into a land use/cover map.http://hdl.handle.net/10316/48070.
Fonte, C.C.; Bastin, L.; See, L.; Foody, G.; Lupia, F.(2015): Usability of vgi for validation of land cover maps.International Journal of Geographical Information Science, vol.29, no.7, pp.1269-1291.
Fonte, C.C.; Minghini, M.; Patriarca, J.; Antoniou, V.; See, L.et al.(2017): Generating up-to-date and detailed land use and land cover maps using openstreetmap and globeland30.ISPRS International Journal of Geo-Information, vol.6, no.4, pp.125.
Fonte, C.C.; Patriarca, J.; Minghini, M.; Antoniou, V.; See, L.et al.(2017): Using openstreetmap to create land use and land cover maps: development of an application.Volunteered Geographic Information and the Future of Geospatial Data, pp.113-137.
Foody, G.M.(2009): Sample size determination for image classification accuracy assessment and comparison.International Journal of Remote Sensing, vol.30, no.20, pp.5273-5291.
Frias-Martinez, V.; Frias-Martinez, E.(2014): Spectral clustering for sensing urban land use using twitter activity.Engineering Applications of Artificial Intelligence, vol.35, pp.237-245.
Friedl, M.A.; McIver, D.K.; Hodges, J.C.; Zhang, X.; Muchoney, D.et al.(2002): Global land cover mapping from modis: algorithms and early results.Remote Sensing of Environment, vol.83, no.1, pp.287-302.
Giri, C.; Pengra, B.; Long, J.; Loveland, T.R.(2013): Next generation of global land cover characterization, mapping, and monitoring.International Journal of Applied Earth Observation and Geoinformation, vol.25, pp.30-37.
Hansen, M.C.; Potapov, P.V.; Moore, R.; Hancher, M.; Turubanova, S.et al.(2013): High-resolution global maps of 21st-century forest cover change.Science, vol.342, no.6160, pp.850-853.
Hu, T.; Yang, J.; Li, X.; Gong, P.(2016): Mapping urban land use by using landsat images and open social data.Remote Sensing, vol.8, no.2, pp.151.
Kang, C.; Liu, Y.; Guo, D.; Qin, K.(2015): A generalized radiation model for human mobility: Spatial scale, searching direction and trip constraint.PloS One, vol.10, no.11, e0143500.
Li, H.; Reynolds, J.F.(1993): A new contagion index to quantify spatial patterns of landscapes.Landscape Ecology, vol.8, no.3, pp.155-162.
Liu, X.; He, J.;Yao, Y.; Zhang, J.; Liang, H.et al.(2017): Classifying urban land use by integrating remote sensing and social media data.International Journal of Geographical Information Science, pp.1-22.
Liu, Y.; Kang, C.; Gao, S.; Xiao, Y.; Tian, Y.(2012): Understanding intra-urban trip patterns from taxi trajectory data.Journal of Geographical Systems, vol.14, no.4, pp.463-483.
Liu, Y.; Liu, X.; Gao, S.; Gong, L.; Kang, C.et al.(2015): Social sensing: a new approach to understanding our socioeconomic environments.Annals of the Association of American Geographers, vol.105, no.3, pp.512-530.
Liu, Y.; Sui, Z.; Kang, C.; Gao, Y.(2014): Uncovering patterns of inter-urban trip and spatial interaction from social media check-in data.PloS One, vol.9, no.1, e86026.
Lu, D.; Weng, Q.(2006): Use of impervious surface in urban land-use classification.Remote Sensing of Environment, vol.102, no.1, pp.146-160.
Ma, L.; Li, M.; Ma, X.; Cheng, L.; Du, P.et al.(2017): A review of supervised object-based land-cover image classification.ISPRS Journal of Photogrammetry and Remote Sensing, vol.130, pp.277-293.
Meng, Y.; Hou, D.; Xing, H.(2017): Rapid detection of land cover changes using crowdsourced geographic information: a case study of Beijing, China.Sustainability, vol.9, no.9, pp.1547.
O'Neill, R.V.; Krummel, J.R.; Gardner, R.H.; Sugihara, G.; Jackson, B.et al.(1988): Indices of landscape pattern.Landscape Ecology, vol.1, no.3, pp.153-162.
Oliver, S.; Gotway, C.(2005): Statistical Methods for Spatial Data Analysis.New York, CRC Press.
Rogan, J.; Chen, D.(2004): Remote sensing technology for mapping and monitoring land-cover and land-use change.Progress in Planning, vol.61, no.4, pp.301-325.
Shaban, M.; Dikshit, O.(2001): Improvement of classification in urban areas by the use of textural features: the case study of lucknow city, uttar pradesh.International Journal of Remote Sensing, vol.22, no.4, pp.565-593.
Sitthi, A.; Nagai, M.; Dailey, M.; Ninsawat, S.(2016): Exploring land use and land cover of geotagged social-sensing images using naive bayes classifier.Sustainability, vol.8, no.9, pp.921.
Sola, J.; Sevilla, J.(1997): Importance of input data normalization for the application of neural networks to complex industrial problems.IEEE Transactions on Nuclear Science, vol.44, no.3, pp.1464-1468.
Wulder, M.A.; White, J.C.; Goward, S.N.; Masek, J.G.; Irons, J.R.et al.(2008): Landsat continuity: Issues and opportunities for land cover monitoring.Remote Sensing of Environment, vol.112, no.3, pp.955-969.
Xing, H.; Meng, Y.; Hou, D.; Cao, F.; Xu, H.(2017): Exploring point-of-interest data from social media for artificial surface validation with decision trees.International Journal of Remote Sensing, vol.38, no.23, pp.6945-6969.
Xing, H.; Meng, Y.; Hou, D.; Song, J.; Xu, H.(2017): Employing crowdsourced geographic information to classify land cover with spatial clustering and topic model.Remote Sensing, vol.9, no.6, pp.602.
Xu, G.; Zhu, X.; Fu, D.; Dong, J.; Xiao, X.(2017): Automatic land cover classification of geo-tagged field photos by deep learning.Environmental Modelling & Software, vol.91, pp.127-134.
Zheng, Y.; Capra, L.; Wolfson, O.; Yang, H.(2014): Urban computing: concepts, methodologies, and applications.ACM Transactions on Intelligent Systems and Technology, vol.5, no.3, pp.38.
 Computer Modeling In Engineering&Sciences2019年5期
- Computer Modeling In Engineering&Sciences的其它文章
- LNA Design for Future S Band Satellite Navigation and 4G LTE Applications
- The Quality Assessment of Non-Integer-Hour Data in GPS Broadcast Ephemerides and Its Impact on the Accuracy of Real-Time Kinematic Positioning Over the South China Sea
- RAIM Algorithm Based on Fuzzy Clustering Analysis
- Exploring Urban Population Forecasting and Spatial Distribution Modeling with Artificial Intelligence Technology
- Monitoring Multiple Cropping Index of Henan Province, China Based on MODIS-EVI Time Series Data and Savitzky-Golay Filtering Algorithm
- Frequency Domain Filtering SAR Interferometric Phase Noise Using the Amended Matrix Pencil Model
