3D Web Reconstruction of a Fibrous Filter Using Sequential Multi-Focus Images
Lingjie Yu , Guanlin Wang Chao Zhi and Bugao Xu ,
Abstract: A fibrous filtering material is a kind of fiber assembly whose structure exhibits a three-dimensional (3D) network with dense microscopic open channels.The geometrical/morphological attributes, such as orientations, curvatures and compactness, of fibers in the network is the key to the filtration performance of the material.However, most of the previous studies were based on materials’ 2D micro-images, which were unable to accurately measure these important 3D features of a filter’s structure.In this paper, we present an imaging method to reconstruct the 3D structure of a fibrous filter from its optical microscopic images.Firstly, a series of images of the fiber assembly were captured at different depth layers as the stage moved vertically.Then a fusion image was established by extracting fiber edges from each layered image.Thirdly, the 3D coordinates of the fiber edges were determined using the sharpness/clarity of each edge pixel in the layered images.Finally, the 3D structure the fiber system was reconstructed through distance transformation based on the locations of fiber edges.
Keywords: 3D reconstruction, sharpness evaluation, fiber web.
1 Introduction
Air pollution has become increasingly a serious concern to the society around the world.According to the Global Air Quality Report released by the World Health Organization (WHO), China’s environmental PM2.5 value in 2016 was four times higher than the recommended value of WHO.Approximately, two million people died each year from airborne particulate matter pollution [Wu (2018)].Source management and terminal filtration are two main approaches that have been used for air pollution control.Since the effective time of taking a source-management measure is relatively long, efficient air filtration has been a research focus worldwide [Wei and Ma (2015)].The existing air filtration technologies mainly include electrostatic dust collection filtration, membrane filtration, and fiber filtration [Bnnett (2016); Lade, Bobde, Mungle et al.(2017)].Of them, fiber filtration has become a mainstream air filtration technology because the 3D network structure of a fiber assembly comprises dense microscopic curved channels which can capture and store airborne particulate matters [Liu, Hus, Lee et al.(2015); Wang, Wu, Jian et al.(2016)].Studies show that the filtration performance of a fiber filter material is directly affected by the morphology of fibers [Kulkarni (2014); Li (2016)].The fiber diameter affects the voids and bulk density between fibers, which determine the filtration efficiency and piezo resistance of the material [Yan, Wang and Li (2013)].The fiber cross-section morphology affects the flow path of dusty airflow [Kulkarni (2014)].The pore size in the web determines the maximum size of intercepted particles [Kim, Ahn and Lee (2008); Matsumoto, Yunoki and Nakamura (2004)].The fiber orientations impact the 3D structure of the curved channels inside a fiber web, which ultimately affects the filtration efficiency [Pradhan and Das (2018)].Therefore, accurately measuring these morphological parameters of a fiber web is one of the keys in improving the filtration performance.
Microscopic imaging is a technology frequently used to measure fiber morphological feature nondestructively [Wu, Li, Li et al.(2014); Li, Yi and Shang (2012)].However, an optical microscope cannot directly obtain the depth information of a target, which leads to a difficulty in abstracting some morphologic information, such as fiber orientations and curved channels inside a fiber web, from captured 2D images.To address the depth problem, some scholars captured multiple sequential images by controlling the continuous movement of the stage in the optical axis (z) direction, then obtained depth information of a pixel according to the focused position at which the pixel has the maximum sharpness, and finally established the 3D surface of the object using the depth map.By using an instant focal stack of nine 2D images, Abrahamsson et al.[Abrahamsson, Chen, Hajj et al.(2013)] proposed a conventional method of producing high-resolution 3D images in multiple colors with single-molecule sensitivity.Moeller et al.[Moeller, Benning and Schonlieb et al.(2015)] proposed to state the depth from focus problem as a variational problem including a smooth but nonconvex data fidelity term, and a convex nonsmooth regularization, which makes the method robust to noise and leads to more realistic depth maps.Based on a synthesis of multi-focus images from multi-view images, Fujii et al.[Fujii, Kodama and Hamamoto (2016)] proposed a novel method for analyzing 3D scene flow accurately at low computational cost as an extension of 2D optical flow estimation.
Based on the concept and the work developed in the past, this research continued to develop a method for reconstructing the 3D structure of a nonwoven web using optical microscopy.A sequence of images of a nonwoven web were firstly captured by scanning the z-direction, a fusion image was then established for extracting fiber edges, the 3D coordinates of the fiber edged were measured based on the focus information, and finally, the 3D structure of the unoccluded section of the fiber net was reconstructed according to the 3D coordinates of the fiber edges.
2 Method
A fiber in a captured microscopic image is the projections of a spatial strip whose depth varies along the longitudinal axis of the fiber but remains almost unchanged transversely.Since the thickness of fiber web exceeds the depth of field of the camera, the captured micro-images display multi-focus phenomenon, meaning that fibers cannot be focused across the entire view area in one image.Projecting the sequential multi-focal layers to a plane to form a fused image is conducive to edge extraction, which needs to take multiple steps.First, a clearness evaluation algorithm is needed to establish a three-dimensional clearness matrix to describe the sharpness value of each pixel at each layer.Then, the maximum sharpness value for each plane position in the depth direction is chosen to form the fused image on which fiber edges cannot be extracted.Finally, the 3D coordinates of the fiber body are calculated through distance transformation using the location of fiber edges.
2.1 Extraction of fiber edges
Considering the complex texture of the entanglement of fibers in the assembly, and the gradient correlation among neighboring pixels, a sharpness evaluation method based on the regional gradient variance was proposed.
S (x, y) is assumed to be the sharpness of the to-be-measured pixel (x, y), Ω represents the local region centered at (x, y), and g (i, j) is the gradient of pixel (x, y), then the sharpness of pixel (x, y) can be expressed as:

Where Num represents the number of pixels in the region Ω, and μ is the average gradient of pixels in region Ω.
Pixel gradient can be calculated using the first-order differential operator - Prewitt operator:

A stepwise diffusion method was adopted to select the sharpness evaluation area Ω.First, the Prewitt operator was used to estimate the pixel clarity for forming a pre-fusion image; on the pre-fusion image.starting from the pixel to be measured, evaluation area gradually diffused in eight directions until the diffusion boundary meets the fiber edge; the evaluation region was finally formed after the diffusion stopped.The process of diffusion is illustrated in Fig.1.
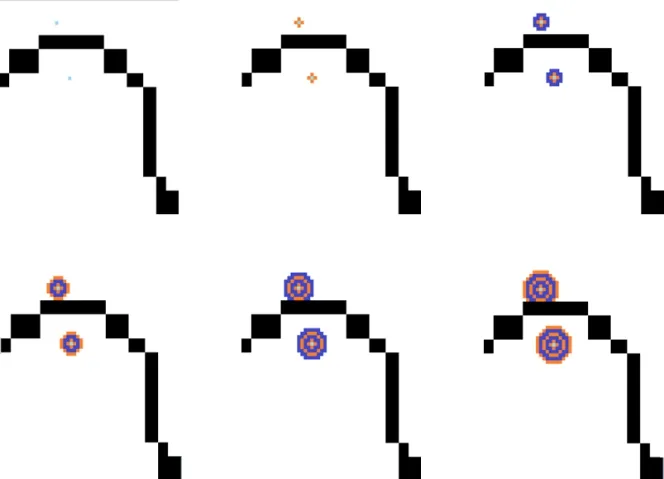
Figure 1: Process of stepwise diffusion
For each plane position (x, y), the layer with the maximum sharpness was selected to project to a two-dimensional space and formed the fusion image.Based on the fusion image, the segmentation and filling hole algorithm was adopted to obtain the binarized image, and the (x, y) coordinates of each edge pixel was extracted according to the binarized image.
By using the above research scheme, a series of multi-focused images with 80 layers were captured as an example, the obtained fusion image was shown in Fig.2.It can be seen from Fig.2 that only edges in the unobstructed area of fiber were extracted successfully, while in the entangled interlaced area, the edge information was lost due to the mutual occlusion between the fibers.
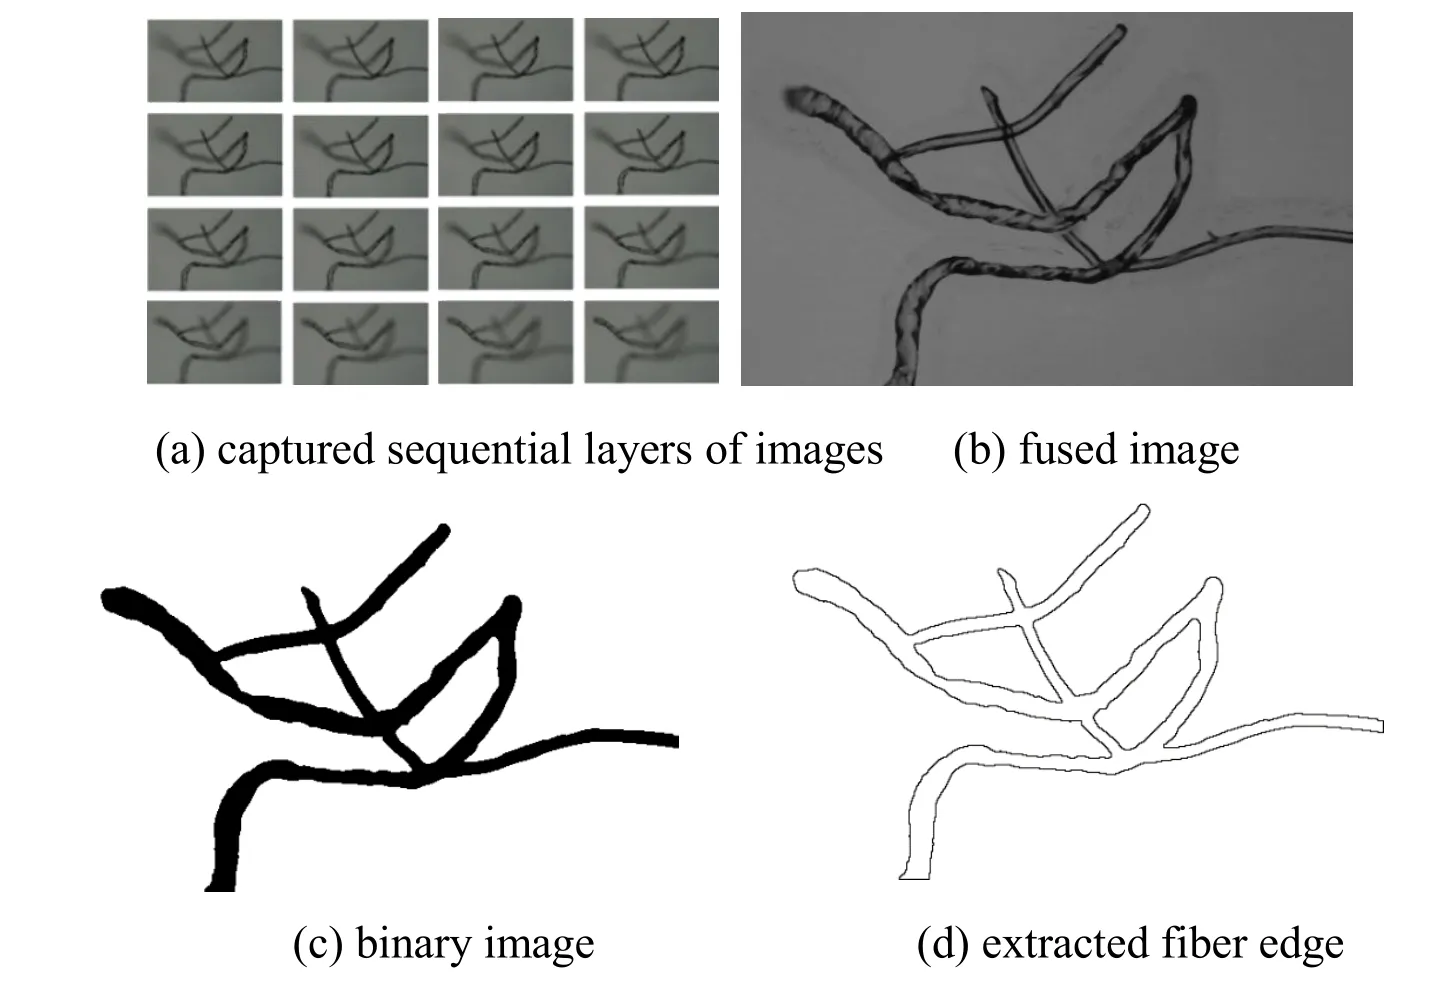
Figure 2: Fiber edge extraction
2.2 Depth measurement of fiber edges
A curved fiber may cross different layers of depth in 3D space, leading to the fact that the depth value of different parts of the same fiber varies.Fiber is a typical curved target with a large ratio of length to fineness.For such kind of target, the change in depth values is mainly reflected in the longitudinal direction of the target, that is, along the edge of fiber.Therefore, to obtain the depth values throughout the fiber edge accurately, we projected fiber targets in the 2D binary image back into 3D space.When the fiber target point fell within the depth of field of the microscopy system, it would leave a projection point in the edge image at corresponding depth.Fig.3 shows the projection points in each edge image at different depths.
Let R the set of fiber projection points in the edge image at certain depth, and card(R) the total number of projection points in the connected area.Set cout_f as the total number of points in the fiber segment.Defining the threshold P, if card(R)/count_f≥P, which means most points in the fiber segment are projected in the certain edge image layer, the fiber segment is considered to be focused at the edge image layer, so the depth value of the edge is the corresponding depth value of the image layer.
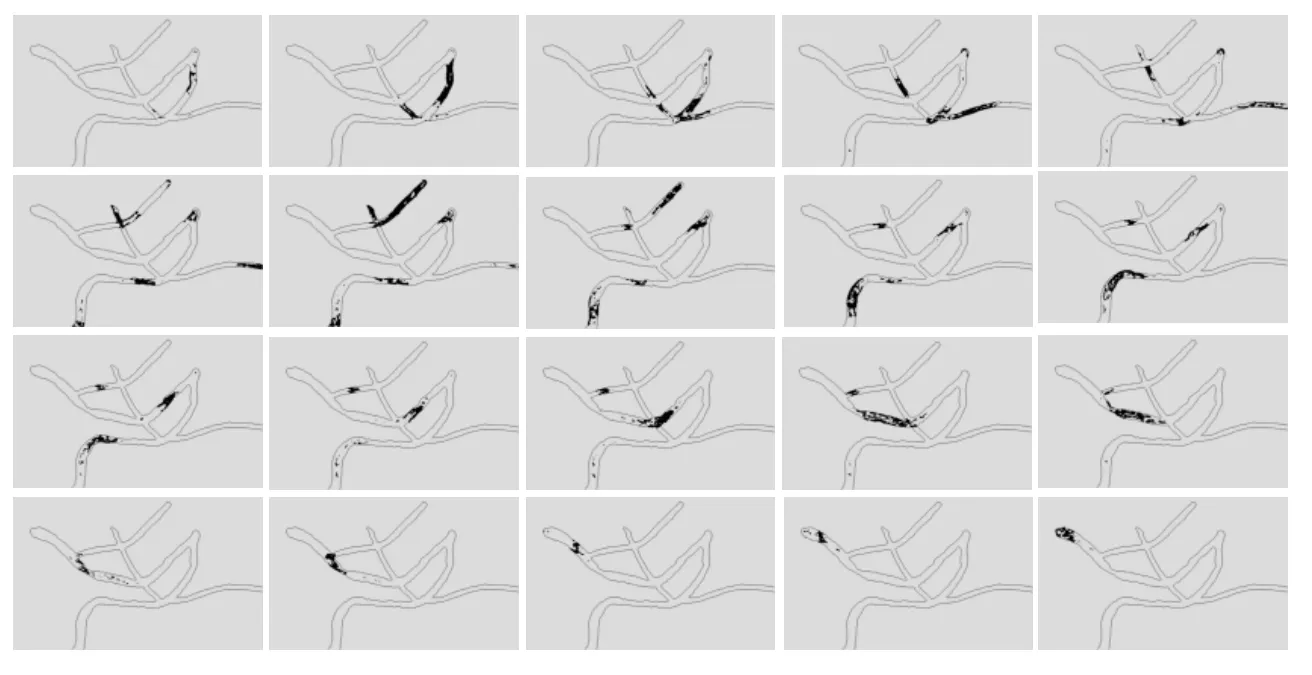
Figure 3: Back-projecting test
Since the depth of field of the microscopy system has a certain range, some fiber segments will be repeatedly focused on multiple layer of depth.In order to acquire the unique depth value of fiber edge, the sharpness of a certain edge point at all edge image layers within its depth of fieldwas calculated and expressed asThe depth at which the maximum value of the sharpness was the unique depth of the edge point, which was expressed as z.Combining the plane coordinates (x, y) of the edge point, the three-dimensional coordinate set of all the fiber edge points in the fiber assemblycan be obtained, in which count_e means the total number of edge points.
2.3 3D reconstruction of fiber surface
Assuming the fiber is a cylinder with a circular cross section, after acquiring the edge point set of all fibers in the assemblythe fiber surface point setand the fiber body point setcan be calculated through distance transformation method.
Taking the above-mentioned 80 sequential multi-focused image layers as experimental objects, the set of three-dimensional coordinates of the fiber bodywere calculated and introduced into the software Geomagic Studio 12 to reconstruct the 3D geological model of the fiber assembly.The result of the reconstructed model is illustrated in Fig.4.
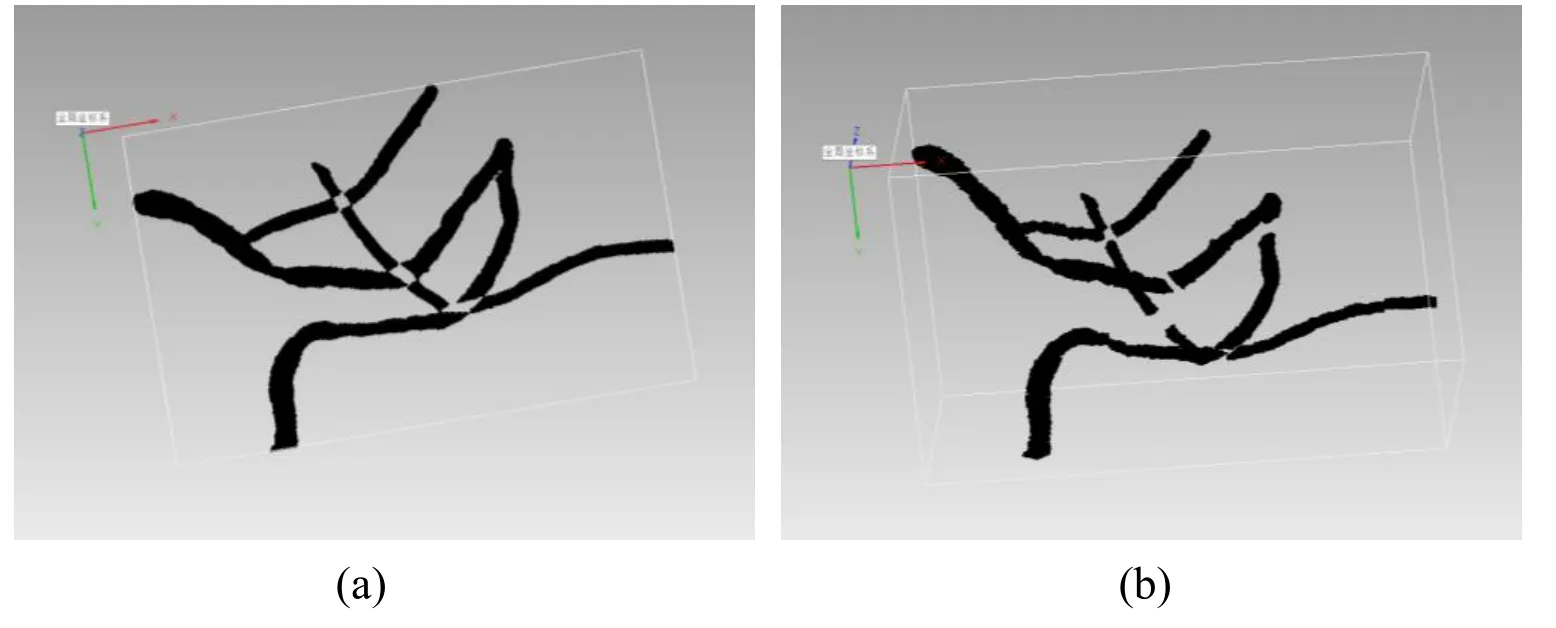
Figure 4: Reconstructed 3D image for fiber system
3 Results and discussion
As an example, a 3D geological model of a nonwoven filtration was reconstructed.Fig.5 exhibits partial of the captured images at different depth layers.Multiple views of the established 3D image are given in Fig.6.It could be seen from Fig.4 and Fig.6 that the reconstructed 3D image can effectively show the spatial distribution and morphology of fibers within the filtration.However, due to mutual occlusion between fibers within fiber assembly, the fiber segments in intersection areas are missing as shown in Fig.4.Fortunately, it will not disturb the calculations of spatial characteristic parameters on the reconstructed fiber network structure.Fiber diameters can be obtained by calculating the maximum inscribed sphere radius inside the fiber segment, and fiber orientations can be obtained by abstracting the three-dimensional point clouds of the axial skeletons of fibers and fitting them into a spatial curve on which the tangential directions of the curves.
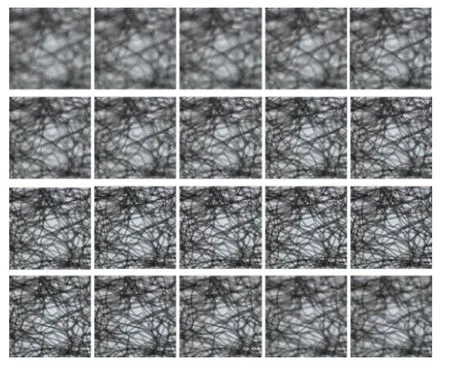
Figure 5: Captured 2D images of nonwoven filtration
4 Conclusion
In this paper, the method to reconstruct a 3D image of a fibrous filter material was introduced.The 3D geometric model was used to obtain several morphological parameters, such as fiber diameter and fiber orientation, which directly affect the filtration performance of a filter material.The sequential multi-focused images of fiber assembly were captured by a light microscope at different depth positions/layers.For each plane position (x, y), the z value which announce the best focus was considered to be the depth value (z).A sharpness evaluation method based on the regional gradient variance was proposed to evaluate the degree of focus for each pixel, and a stepwise diffusion method was adopted to ascertain the sharpness evaluation area.Based on the assumption that fiber is a cylinder with circular cross section, the 3D coordinates of the fiber body were calculated through distance transformation using the 3D location of fiber edge obtained at previous step.
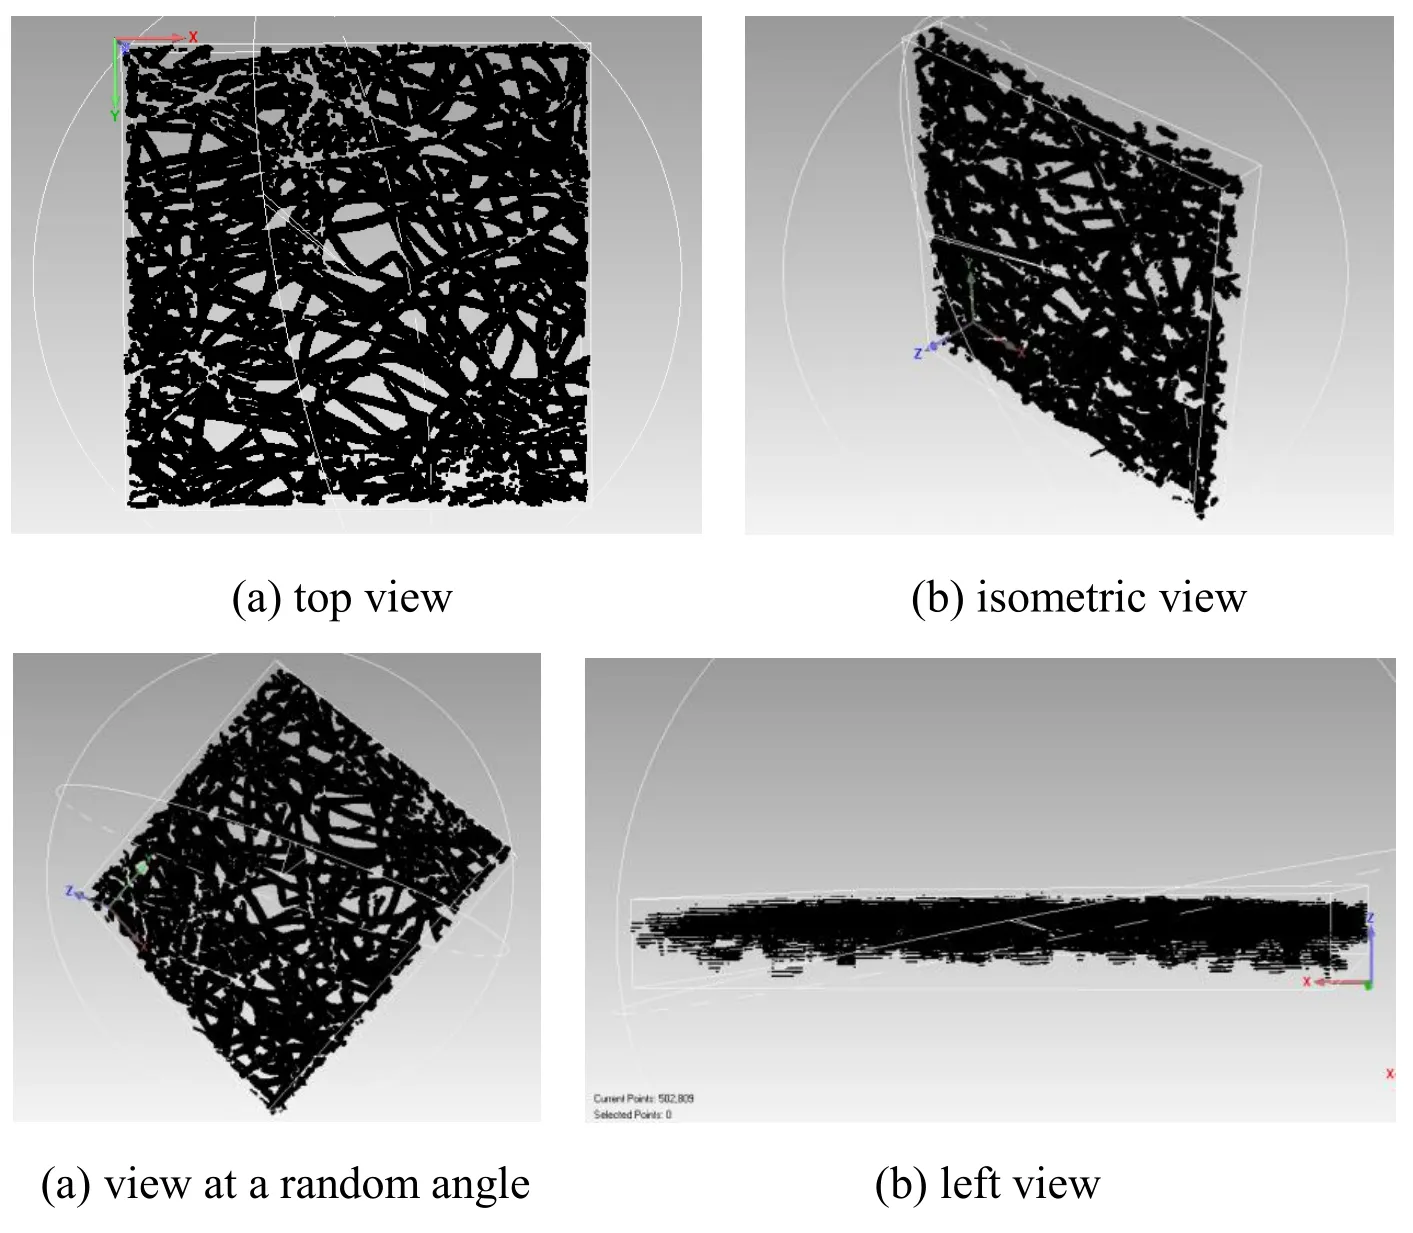
Figure 6: Reconstructed 3D image of nonwoven filtration
Acknowledgement:The authors acknowledge the f inancial support from the Science and Technology Project of Shaanxi, China (Grant No.2018JQ5214) and Scientific Research Program Funded by Shaanxi Provincial Education Department (Program No.18JS039).
References
Abrahamsson, S.; Chen, J.J.; Hajj, B.;Stallinga, S.; Katsov, A.Y.et al.(2013): Fast and sensitive multi-color 3D imaging using aberration-corrected multi-focus microscopy.Nature Methods, vol.10, no.1, pp.60-63.
Bennett, A.(2016): Developments in air & gas filtration technology.Filtration + Separation, vol.53, no.5, pp.30-32, 34-35.
Fujii, H.; Kodama, K.; Hamamoto, T.(2016): Scene flow estimation through 3D analysis of multi-focus images.Proceeding of Visual Communications and Image Processing, pp.1-4.
Kim, G.T.; Ahn, Y.C.; Lee, J.K.(2008): Characteristics of Nylon 6 nanofilter for removing ultra fine particles.Korean Journal of Chemical Engineering, vol.25, no.2, pp.368-372.
Kulkarni, P.S.; Patel, S, U.; Patel, S.U.;Chase, G.G.(2014): Coalescence filtration performance of blended microglass and electrospun polypropylene fiber filter media.Separation & Purification Technology, vol.124, no.124, pp.1-8.
Lade, A.; Bobde, S.; Mungle, N.P.;Jiwtode, V.(2017): Fabrication of automatic air filter cleaning system: a review.International Conference on Science and Engineering for Sustainable Development.
Li, S.; Yi, H.; Shang, S.(2012): Measurement of diameter and scale of cashmere fibers by computer images analysis.Journal of Fiber Bioengineering & Informatics, vol.5, no.1, pp.95-103.
Li, W.; Shen, S.; Li, H.(2016): Study and optimization of the filtration performance of multi-fiber filter.Advanced Powder Technology, vol.27, no.2, pp.638-645.
Liu, C.; Hsu, P.C.; Lee, H.W.; Ye, M.; Zheng, G.Y.et al.(2015): Transparent air filter for high-efficiency PM2.5 capture.Nature Communications, vol.6, pp.6205.
Matsumoto, K.; Yunoki, T.; Nakamura, K.(2004): Effect of fiber diameter, porosity and basis weight on pore size and pore size distribution of stainless steel non-woven fiber filter.Kogaku Ronbunshu, vol.30, no.1, pp.79-86.
Moeller, M.; Benning, M.; Schonlieb, C.;Cremers, D.(2015): Variational depth from focus reconstruction.IEEE Trans Image Process, vol.24, no.12, pp.5369-5378.
Pradhan, A.K.; Das, D.A.(2018): Comparative study on filtration performance of mono-, bi-, and multi-constituent nonwoven air filter media.Journal of the Textile Institute, vol.109, no.11, pp.1-7.
Wang, C.; Wu, S.; Jian, M.; Xie,J.R.; Xu, L.P.et al.(2016): Silk nanofibers as high efficient and lightweight air filter.Nano Research, vol.9, no.9, pp.1-8.
Wei, W.X.; Ma, X.L.(2015): Optimal policy choice for energy structure adjustment and haze management.China’s Population, Resources and Environment, vol.24, no.7, pp.6-14.
Wu, L.L.(2018): WHO releases the latest global air quality report: progress, but more efforts are needed to avoid air pollution reaching dangerous levels.http://www.wpro.who.int/china/mediacentre/releases/2018/20180502-WHO-Issues Latest-Global-Air-Quality-Report/zh/,2018-5-2/2018-7-23.
Wu, Y.; Li, D.; Li, Z.; Yang, W.(2014): Fast processing of foreign fiber images by image blocking.Information Processing in Agriculture, vol.1, no.1, pp.2-13.
Yan, M.; Wang, Z.; Li, X.(2013): Improving filtration performance of electrospun nanofiber mats by a bimodal method.Journal of Applied Polymer Science, vol.128, no.2, pp.1089-1094.
 Computer Modeling In Engineering&Sciences2019年5期
- Computer Modeling In Engineering&Sciences的其它文章
- LNA Design for Future S Band Satellite Navigation and 4G LTE Applications
- The Quality Assessment of Non-Integer-Hour Data in GPS Broadcast Ephemerides and Its Impact on the Accuracy of Real-Time Kinematic Positioning Over the South China Sea
- RAIM Algorithm Based on Fuzzy Clustering Analysis
- Exploring Urban Population Forecasting and Spatial Distribution Modeling with Artificial Intelligence Technology
- Inferring Spatial Distribution Patterns in Web Maps for Land Cover Mapping
- Monitoring Multiple Cropping Index of Henan Province, China Based on MODIS-EVI Time Series Data and Savitzky-Golay Filtering Algorithm
