Application of power law to vertical distribution of longshore currents
Zhen-wei Zhang *,Zhi-li Zou
a School of Civil Engineering and Architecture,Xiamen University of Technology,Xiamen 361021,China
b State Key Laboratory of Coastal and Offshore Engineering,Dalian University of Technology,Dalian 116024,China
Received 1 June 2018;accepted 5 January 2019
Available online 13 April 2019
Abstract The vertical prof iles of longshore currents have been examined experimentally over plane and barred beaches.In most cases,the vertical prof iles of longshore currents are expressed by the logarithmic law.The power law is not commonly used to describe the prof ile of longshore currents.In this paper,however,a power-type formula is proposed to describe the vertical prof iles of longshore currents.The formula has two parameters:the power law index(a)and the depth-averaged velocity.Based on previous studies,power law indices were set as a=1/10 and a=1/7.Depth-averaged velocity can be obtained through measurement.The f itting of the measured velocity prof iles to a=1/10 and a=1/7 was assessed for the vertical longshore prof iles.The vertical prof ile of longshore currents is well described by the power-type formula with a=1/10 for aplanebeach.However,for abarred beach,different valuesof a needed to beused for different regions.For theregion from thebar trough to the offshore side of the bar crest,the vertical prof iles of longshore currents given by the power-type formula with a=1/10 and a=1/7 f it the data well.However,the f it was slightly better with a=1/10 than that with a=1/7.For the data over the trough region of cross-shore distribution of the depth-averaged longshore currents,the power formula with a=1/3 provided a good f it.The formulas with a=1/10 and a=1/7 were further examined using published data from four sources covering laboratory and f ield experiments.The results indicate that the power-type formula f its the data well for the laboratory and f ield data with a=1/10.
Keywords:Waves;Coast;Logarithmic law;Power law;Surf zone
1.Introduction
The signif icant role of wave-induced f low along the shore in coastal processes has been recognized.Considerable research efforts have been devoted to the measurement of longshore currents since 1949(Basco,1983).Laboratory experiments on the shear instability of longshore currents have been carried out(Reniers and Battjes,1997;Ren et al.,2012).Wang and Zou(2015)investigated experimentally the bimodal velocity prof ile of longshore currents over two mild-slope barred beaches.
With regard to the study of longshore currents,most laboratory experiments have been conducted on depth-averaged longshore currents(Reniers and Battjes,1997;Hamilton and Ebersole,2001;Shen et al.,2018).There have also been experimental studies on the vertical structure of longshore currents,such as Visser(1991),Hamilton and Ebersole(2001),Wang et al.(2002),and Zhang and Zou(2012).Visser(1991)used a dye release method to observe the vertical structure of longshore currents on a plane beach.Hamilton and Ebersole(2001)measured the velocity by placing an acoustic Doppler velocimeter(ADV)at different vertical locations on a plane beach.Wang et al.(2002)used the same method as Hamilton and Ebersole(2001)to observe the vertical distribution of longshore currents over a sand beach.A f ield observation of longshore current vertical structure was conducted during the DUCK94 project(Faria et al.,1998)over a barred beach.
It iswell known that thevertical velocity structurefollowsa logarithmic prof ile in open channels.For longshore currents,the vertical prof iles below the wave trough are well described by a logarithmic prof ile in both laboratory(Zhang and Zou,2012;Wang et al.,2002)and f ield conditions(Faria et al.,1998),but the application of the logarithmic law depends on the accurate measurement of the friction velocity and the apparent roughness of the sea bed.Faria et al.(1998)demonstrated that none of the commonly used empirical relations for za/z0(zais the apparent roughness height,and z0is the physical roughness height)can accurately predict the apparent roughness.Zhang and Zou(2012)argued that values of friction velocity are in accordance with the results given by empirical formulas in magnitude.Thus far friction velocity and apparent roughness have been diff icult to determine accurately(Faria et al.,1998).The logarithmic law cannot be easily used for the practical prediction of vertical distribution of longshore currents.
Despite numerous investigations of the power law velocity prof iles of open channels(Cheng,2007)and tidal f lows(Zhang et al.,2016),no investigations and analyses have been carried out on the prof iles of longshore currents based on the power law.The present study investigated the vertical distribution of longshore currents experimentally with a focus on developing a power-type formula for the vertical distribution of longshore currents.
2.Experimental setup
A detailed description of the experimental setup is presented in Zhang and Zou(2012).The experiment was performed at the State Key Laboratory of Coastal and Offshore Engineering at Dalian University of Technology.The wave basin had a length of 55 m,a width of 34 m,and a depth of 0.7 m.Two concrete beaches were constructed:a plane beach with a slope of 1:40 and a barred beach formed by superimposing a bar on the plane beach.
Unidirectional oblique incident waves,both regular and irregular,were generated by a multi-paddle-type wave maker.Table 1 gives the wave conditions for the experiment,where T is the wave period;H is the incident wave height(signif icant wave height for irregular waves);ξ0is the surf similarityparameter withξ0=tanβ(H0/L0)-1/2,where H0is the wave height,L0isthewave length,and tanβisthebeach slope;and xbstands for the wave breaking point for the plane beach.For the irregular wave case,the breaking point was assumed to be the point where the measured wave height began to decrease at thehighest rate.Thespilling breaker wasobserved in the plane beach experiment,while the plunging breaker wasobserved in the barred beach experiment on the seaward side of the bar.The longshore uniformity and measurement repeatability of longshore currents were examined by Zhang and Zou(2012),and are thus omitted here.

Table 1Wave conditions.
3.Power law
In this section, we propose a simple formula, the power law,to describe the vertical structure of longshore currents
3.1.Theoretical background
The theory of the similarity principle proves that the logarithmic law and the power law for the mean velocity distributions in developed turbulent shear f low have equally rigorous theoretical foundations,although they are based either on a complete self-similarity assumption or an incomplete self-similarity assumption(Barenblatt,2014).Therefore,it is justif iable to use either the logarithmic law or the power law to describe the vertical structure of longshore currents.
Here we give a brief description of derivations of the two laws,which are based on the similarity principle(Barenblatt,2014).It is assumed that the mean velocity gradient depends,in principle,on the following kinematic quantities:the friction velocity v*,the distance from a point to the water bottom z,the kinematic viscosityν,and the bottom roughness height ks.By means of dimensional analysis,the following expression can be obtained:

whereζis the local relative roughness andζ=z/ks;ςis the local Reynoldsnumber andς=v*z/ν;Re isthef low Reynolds number and Re=,where V is the depth-averaged velocity,and h isthestill water depth;andφisthedimensionless function.The asymptotic expression forφcan be obtained by lettingζ→∞,ς→∞,and Re→∞.There are two hypotheses for this analysis.One is the complete self-similarity assumption(Barenblatt,2014),which assumes that the functionφ tends toward a f inite limitφ→1/κ,whereκisthevon Karman constant.Another istheincompleteself-similarity assumption,which assumes that no limit of functionφexists,and thatφ shows a power-type asymptotic behavior ofφ~Bζa,where B is a constant and a is the power index.From the f irst hypothesis,the universal logarithmic law follows directly with the functionφreplaced by its asymptotic expression and integration:

where D isthe integration constant.Similarly,from the second hypothesis,the power law results in

where the constants C and a are dependent on the f low Reynolds number.The results above show that the derivations of Eqs.(2)and(3)are equally rigorous,but they rest on different basic assumptions.
The f itting of the measured velocity prof iles to the logarithmic law Eq.(2)was assessed by Zhang and Zou(2012).Below,investigation of the application of the power law Eq.(3)is described.In applying this law,ksneeds to be replaced by h.This yields

Integrating Eq.(4)from z=-h to the still water level with D=0 gives C=(1+a)
V/v*,where
V can be determined by positioning the ADVs approximately one-third of the water depth above the bed.Then
V is def ined as

Substituting C into Eq.(4)yields

Eq.(6)is the power-type formula adopted in this study for f itting the vertical prof ile of longshore currents.The advantage of this formula is that it only depends on V instead of v*and ks,as the logarithmic law does.As pointed out above,this is theadvantageof thisformulaover thelogarithmic law,since V can be obtained easily with a theoretical method or through experimental measurement.In this study,linear interpolation was used to determine V from the measurement points inside the bottom layer.The value of a needs to be determined by f itting thisformulato the measured data.It iswell known that,for a tidal current,a is normally between about 1/7 and 1/10(Dyer,1971),so in the following subsections,we examine whether this is also applicable for the longshore current case.The cross-shore distributions of the longshore currents over barred and plane beachesare different.For a barred beach,the longshore current velocity usually has two peaks,while for a plane beach the longshore current velocity only has one peak.Therefore,we discuss the applicability of the power law for plane and barred beaches separately.
Since the oscillation of surface elevation affects the f low abovethewavetrough level,thepower law needsto beapplied below the wave trough level.Therefore,the whole water column isdivided into two layers,theupper layer above thewave trough level(the surface layer)and the lower layer below the wave trough level(the bottom layer),where Hrmsis the root mean square wave height andstands for the mean water level(Fig.1).The modif ied vertical prof ile of longshore currentswithin the surface layer,Vsfc(z),is applied:

where V′(z)is the power law prof ile as in Eq.(6),and P(η)representsthecumulativesurface elevation probability density function(pdf)following the Gaussian distribution pdf.
To check the f itting accuracy,we introduce the following standard variance(σe)as the accuracy measure:

where xmiis the current speed measured at level i,xciis the computed current speed at level i,and N is the number of elevation points where current measurements were conducted below the wave trough.In this study,the results given by the power law were judged acceptable ifσe≤0.15.We chose three error levels to describe the distribution of f itting errors,σe≤0.05,0.05<σe≤0.15,andσe>0.15,in order to check the performance of the power-type formula.The divergence degree of f itting errors for plane and barred beaches were investigated.Table 2 provides the percentages of f itted data with f itting errors below these three error levels.A related discussion is provided in the following subsections.
3.2.Results for plane beach
As with the logarithmic f itting(Zhang and Zou,2012),the vertical prof ile of the longshore current is divided into two layers,the lower layer below(bottom layer)and the upper layer above z=(surface layer).The f low vertical distribution in the lower layer is described by Eq.(6),and that in the upper layer is described by Eq.(7),with V′(z)calculated by Eq.(6).
For regular wavecases,Fig.2(a)showsthedistribution ofσeversus the ratio x/xbwith a=1/10 and a=1/7,where x stands for the distance from the still water shoreline.The values ofσegiven by thepower law formula Eq.(6)with a=1/10 are lower than those with a=1/7.Withσe≤0.15,the average values of σeare0.0573 and 0.0815for a=1/10 and a=1/7,respectively.

Fig.1.Illustration of surface layer and bottom layer.
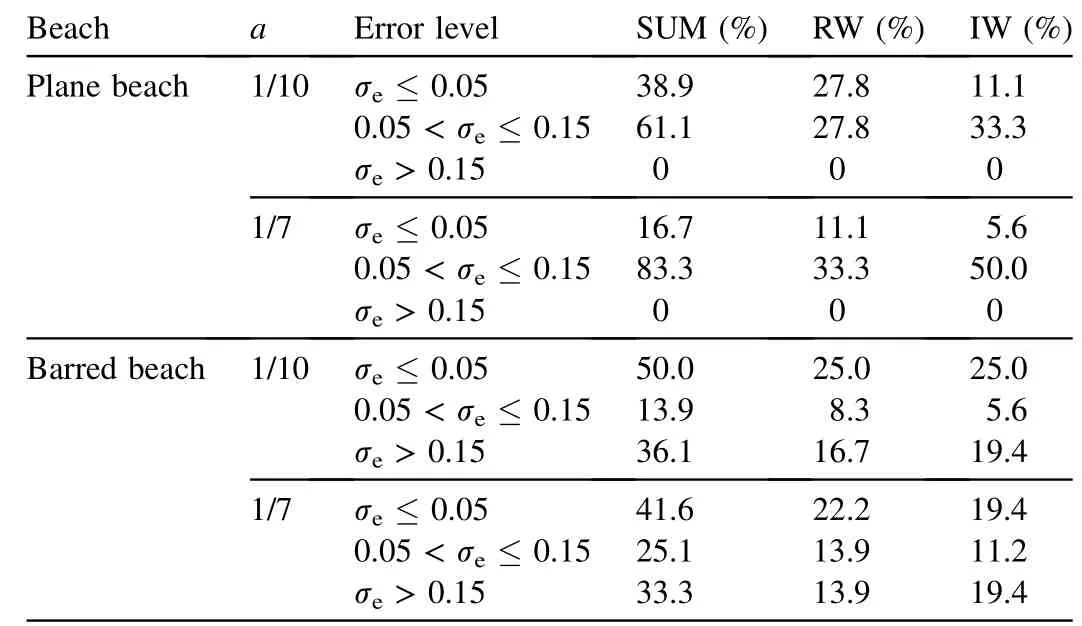
Table 2Percentages of f itted data with f itting errors below three error levels.
The fact that the former is lower than the latter means that a=1/10 can provide a better f it of the data than a=1/7.This conclusion can also be drawn from the fact that the percentage of the f itted data withσe≤0.05 is 27.8%for a=1/10 and 11.1%for a=1/7,asshown in Table2.Thelarger valuesofσeoccur mainly for the smaller magnitudes of longshore current,which have a maximum value of 0.132 when the maximum velocity prof ile is 0.1 m/s.The values ofσeincrease with increasing offshore distance(x/xb).
Fig.2(b)shows the values ofσefor irregular wave cases.The values ofσehave a similar variation trend to those of regular wave cases,as discussed above,and are less than 0.15 for all runs.The values ofσefor a=1/10 are less than those for a=1/7.The average values ofσeare 0.0832 and 0.0898 with a=1/10 and a=1/7,respectively,which are a little bit larger than those of regular wave cases(σe=0.0573 and σe=0.0815 for a=1/10 and a=1/7,respectively).The values ofσeless than 0.05 account for 11.1%of all runs and have an average value of 0.0129.The percentage of irregular wavesbelowσe=0.05 islessthan the corresponding value for regular wave cases(27.8%),and the mean value ofσeis greater than the corresponding value for regular wave cases(0.0313).Therefore,using the power law with a=1/10 for irregular waves does not provide as good a f it as for regular waves,but can still provide better estimations of the vertical prof ileof longshore currents.Asfor regular waves,thef it with a=1/10 is better than that with a=1/7.The values ofσeincrease with increasing offshore distance(x/xb)and reach their maximum at x/xb=1.
Fig.3 shows the vertical prof ile of longshore currents from the measurements and f itting with Eq.(6)with a=1/10 for all thewave conditions listed in Table 1.When the power index is 1/10,the computed result is in agreement with the measured data and the maximum value ofσeis 0.132 for regular wave conditions.As shown in Fig.2,the value ofσeis rather small,so we can assume that this formula can estimate the vertical prof ile of longshore currents for the plane beach well.Table 3 shows the values ofσeproduced by logarithmic f itting for the plane beach.The values ofσeare less than 0.04 and 0.07 for regular and irregular waves,with averagevaluesof 0.0109 and 0.0243,respectively.Thus,the logarithmic law provides better f itted results than the power law.
3.3.Results for barred beach
Since the location and ratio of the two peaks are controlled by the bar(Wang and Zou,2015),we introduce the relative distance x/xbaras the horizontal coordinate in the following f igures,where xbaris the distance from the bar crest to the shoreline.One feature of the f low over thebarred beach isthat the f low over the bar crest isstrongly affected by oscillation of the free surface,and the whole water depth over the bar crest becomes the surface layer.The measured wave height is almost equal to thelocal water depth.Thus,thevertical prof ile of longshore currents over the bar crest is expressed by the improved power law given by Eq.(7)with V′(z)calculated by the power law formula Eq.(6).The data from the two ADVs below the still water level are used to compute the depthaveraged velocity V.
Another feature of the f low over the barred beach is that therearetwo peaksof longshorecurrents:thef irst peak isover the bar crest(with x/xbarranging from 0.9 to 1.0 in this experiment),and the second peak isnear the shoreline(around x/xbar=0.25),as shown in Fig.4(a).The measured locations of the vertical prof ile of longshore current are shown in Fig.4(b).The locations of the two peaks of longshore current velocity remain unchanged for different wave heights,wave types,and wave periods(Wang and Zou,2015).The data f itting demonstrates that this feature affects the application of the power law,and different values of a need to be used for different regions,such as at the measured location x=3.5 m

Fig.2.Values ofσe for regular and irregular waves over plane beach.

Fig.3.Vertical prof iles of longshore currents for regular and irregular waves.

Table 3Values ofσe given by logarithmic f itting for plane beach.

Fig.4.Depth-averaged longshore current and measured locations of vertical prof ile of longshore current.
where the power formula with a=1/3 f its data well,as shown in Fig.5.For the region from the bar trough to the offshore side of the bar crest(x=4.0 m,x=4.5 m,and x=5.0 m)and theminimum depth wherethelocation of thevertical prof ileof longshore current was measured(x=2.0 m),a=1/10 and a=1/7 can provide a good f it.However,the f it is slightly better with a=1/10 than with a=1/7,asshown in Fig.6.For the data over the trough region of the cross-shore distribution curve of depth-averaged longshore currents,x=2.5 m,x=3.0 m,and x=3.5 m,using a=1/10 and a=1/7,cannot providea good f it,so we need to use other valuesof a,such as a=1/3.The power-type formula can provide a good f it with a=1/3 for some measured locations,as shown in Fig.5.This demonstrates that the f itting of the power law to the vertical distribution of longshore currents is affected by the presence of the second peak of longshore currents over the barred beach.This situation is different from the case of the plane beach discussed in the previous section,and the presence of the bar is shown to have a strong effect not only on the crossshoredistribution of longshore currentsbut also on thevertical distribution of longshore currents.
The f it is much worse for the measuring points located at the offshore side of the bar(x=5.5 m and x=6.0 m).The small magnitude of longshore currents over this region may be the cause of the bad f it,because the measured velocity is more widely scattered over the region.Thus,for these measuring points,neither the power law nor the logarithmic law is applicable,as shown in Fig.7.
The f irst wave breaking occurs on the offshore side and on the top of the bar,followed by a nonbreaking area in the bar trough and then the second breaking near the water line over the barred beach(Wang and Zou,2015).Turbulence induced by breaking waves modif ies the vertical distribution of longshore currents.The momentum mixing produced from wave breaking-injected turbulence results in a more uniform velocity prof ile.Fredsoe and Deigaard(1992)and Church and Thornton (1993)argued that this would result in an increased bed shear stress.As a result,the vertical gradient of themean current near thebed isincreased,and amore uniform prof ile can be expected throughout most of the water column.The shear stress given by logarithmic f itting tends to increase f irst and then decrease(Zhang and Zou,2012).The maximum value occurs near the top of the bar.Therefore,the vertical prof ileof longshorecurrentshasan obviousincreasein current speed from the bottom in the region of the bar trough(x=2.5 m,x=3.0 m,and x=3.5 m)and offshore side of the bar(x=5.5 m and x=6.0 m).
Here,we f irst discuss the features mentioned above through the distribution of the values ofσefor different values of a.The results are shown in Fig.7.It can be seen that for both regular and irregular waves with a=1/10,the larger values ofσe,from 0.15 to 5.0,occur at the measuring points with x/xbar=0.5,x/xbar=0.6,x/xbar=0.7,and x/xbar=1.1,corresponding to the trough region of the crossshore distribution curve of the depth-averaged longshore current,but with a=1/3 the values ofσeare reduced obviously.This means that the power law with a=1/3 should be used for thisregion.With a=1/10 and a=1/7,thevaluesof σeat the measuring points from the bar trough to the offshore side of the bar crest(x/xbar=0.8,x/xbar=0.9,x/xbar=1.0,and x/xbar=1.1)are both very low.To show this in detail,Table 2 gives the percentages of f itted data whose f itting errors are below the three error levels.Forσe≤0.05,the percentage with a=1/10 is larger than that with a=1/7 for regular and irregular waves,whereas forσe≤0.15 the percentage with a=1/10 is less than that with a=1/7 for regular waves or irregular waves.None of these results can provide a consistent conclusion about whether a=1/10 or a=1/7 is better.Therefore,we need to f ind other ways of evaluating that,such as the average results shown in Fig.6,which presents the distribution ofσeover the measuring pointsfor thecasesofσe≤0.15 and their averagevaluesover the data set.It can be seen that the average error values for a=1/10 are lower than those for a=1/7,which are 0.0477 and 0.0542 for regular waves and 0.0397 and 0.0566 for irregular waves,respectively.Thus,a=1/10 is better than a=1/7 according to this result.

Fig.5.Vertical prof iles of longshore currents with a=1/10 and a=1/3.

Fig.6.Values ofσe for regular and irregular waves over barred beach.

Fig.7.Values ofσe given by power law f itting and logarithmic f itting over barred beach.
For the purpose of discussing the reason for the generation of f itting errors withσe,we also provide the f itting errors produced by the logarithmic law,as shown in Fig.7.It can be seen that,with a=1/10 and a=1/3,both the power law and the logarithmic law provide a good f it.However,when the power law cannot provide a good f it,the logarithmic law still provides a good f it except for the measuring points that have much wider data scattering.These measuring points are located at x=2.5 m and x=5.5 m for BRT1H5,x=2.5 m for BIT1H8,and x=6.0 m for all wave cases,and are considered useless for data f itting,as shown in Fig.5.Thus,they were not considered in the error analysis described above.
Fig.8 shows the vertical prof ile of longshore currents measured and predicted by the power law Eq.(6)with a=1/10 or a=1/3(located at x=2.5 m and x=3.0 m).The measured and calculated values are in agreement.
4.Applications to other results
As shown in Figs.3 and 8,the power law can be used to f it the vertical prof ile of longshore currents measured in the experiment.In this section we describe the application of this law to laboratory data and f ield experiments produced by other studies,including Visser(1991),Hamilton and Ebersole(2001),DUCK94(Faria et al.,1998),and Wang et al.(2002),in order to examine the overall performance of the power-type formula.
4.1.Visser's experiment(1991)
Theexperimentswereperformed in a34.0-m-long,16.6-mwide,and 0.68-m-deep wave basin in the Civil Engineering Faculty of Delft University of Technology.The beach slopesin consideration were 1:10 and 1:20.Only regular waves could be produced.The data sets from Visser's experiment 3(with a wave height of 8.9 cm,a wave period of 1.00 s,and a water depth of 40.1 cm)and experiment 4(with a wave height of 7.8 cm,a wave period of 1.02 s,and a water depth of 35.0 cm)were used.The incident wave angle wasθ=15.4°for both wave cases.An active external circulation system driven by a pump was used to maintain the water circulation.The current velocities were measured by dye tracking at three vertical levels:the surface,mid-depth,and near the bottom(i.e.,1.0 cm above the bottom).
The power index could be considered a=1/10.The depthaveraged velocity was determined as follows:

where vsurface,vmid-depth,and vbottomarethecurrent velocitiesat the surface,mid-depth,and near the bottom,respectively.
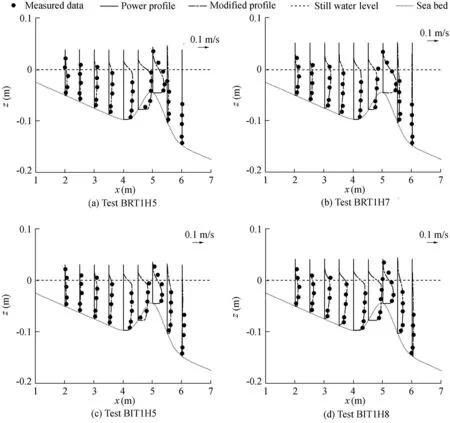
Fig.8.Vertical prof iles of longshore currents for regular and irregular waves.
Fig.9 showsthevaluesofσegiven by Eq.(8)with a=1/10 and a=1/7.As shown in Fig.9,the average values ofσeare 0.286 and 0.435 for a=1/10 and a=1/7,respectively.The values ofσeare much greater than those in the present experiment.This may have been caused by the inaccurate measurement in longshore currents through the simple technique of dye injection.Fig.10 shows the measured data and the calculated vertical prof iles of longshore currents.The calculated prof ilesdeviated from themeasured data,especially near the surface.

Fig.9.Values ofσe for Visser's experiment.
4.2.Hamilton's experiment

Fig.10.Vertical prof iles of longshore currents for Visser's experiment.
This experiment was performed in a basin with a length of 50 m,a width of 30 m,and a depth of 1.4 m at the Coastal and Hydraulics Laboratory of the U.S.Army Engineer Research and Development Center.The model beach had a length of 31 m,a width of 21 m,and a slope of 1:30.The still water depth at the wave generators was 0.667 m.The longshore velocity measurements from Test 6N(regular wave)and Test 8E(irregular wave)were selected.The incident wave height was 0.189 m for Test 6N and 0.233 m for Test 8E.The wave period and incidence angle were,respectively,2.5 s and 16.6°for both cases.An active recirculation system was employed and the velocity distribution was obtained at each ADV for six vertical locations.
Hamilton's experimental results indicate that in the inner surf zone there was a slight increase in current speed with distance from the bed for regular and irregular wave cases,a result similar to that of the present study.
Fig.11 shows the values ofσecalculated from Eq.(8)with a=1/10 and a=1/7.All the values ofσeare less than 0.15 for both a=1/10 and a=1/7.The maximum value ofσeis 0.117 at x/xb=0.741 with a=1/10 for Test 6N.The mean values ofσeare 0.0397 and 0.0628 for a=1/10 and a=1/7,respectively.As shown in Fig.11,when a=1/10 the calculated values ofσeare less than 1/7.Fig.12 shows the vertical prof ile of longshore currents calculated by the power-type formula.The results are consistent with the measured data.
4.3.DUCK94 experiment
The measurements described here come from the comprehensive nearshore DUCK94 experiment conducted during October 1994 at the U.S.Army Corps of Engineers Field Research Facility(FRF)in Duck,North Carolina,which is located on the Outer Banks.The beach was a two-bar system,with the near bar being 30-120 m offshore and a secondary bar with a lower amplitude being 300-400 m offshore.The mean foreshore slope of the beach was approximately 0.08(1:12),and the slope offshore of the bars was approximately 0.006(1:170).The beach condition approximated a steady state,with straight and parallel contours.The data selected here for analysis were from October 10 through 12,three strong longshore current periods.The observations spanned the entire surf zone.A logarithmic prof ile was used to f it the measured data and obtain well def ined results.The electromagnetic current meter(EMS)elevations above the bed were 23,42,68,101,147,179,224,and 257 cm.

Fig.11.Values ofσe for f ixed bed.
Fig.13 shows the values ofσegiven by Eq.(8)with a=1/10 and a=1/7.It can be seen from the f igure that the values ofσeare less than 0.15 for all measuring positions,except at x=171 m and x=224 m for October 12.The values ofσewith a=1/7 are a bit smaller than those with a=1/10.Therefore,the power law formula gives better predictions with a=1/7 than with a=1/10.The mean values ofσeforσe≤0.15 are 0.0617 and 0.0502 with a=1/10 and a=1/7,respectively.Since the difference is small,a=1/10 was used to represent the DUCK94 f ield project.Fig.14 shows that the results given by the formula f it the measurements.
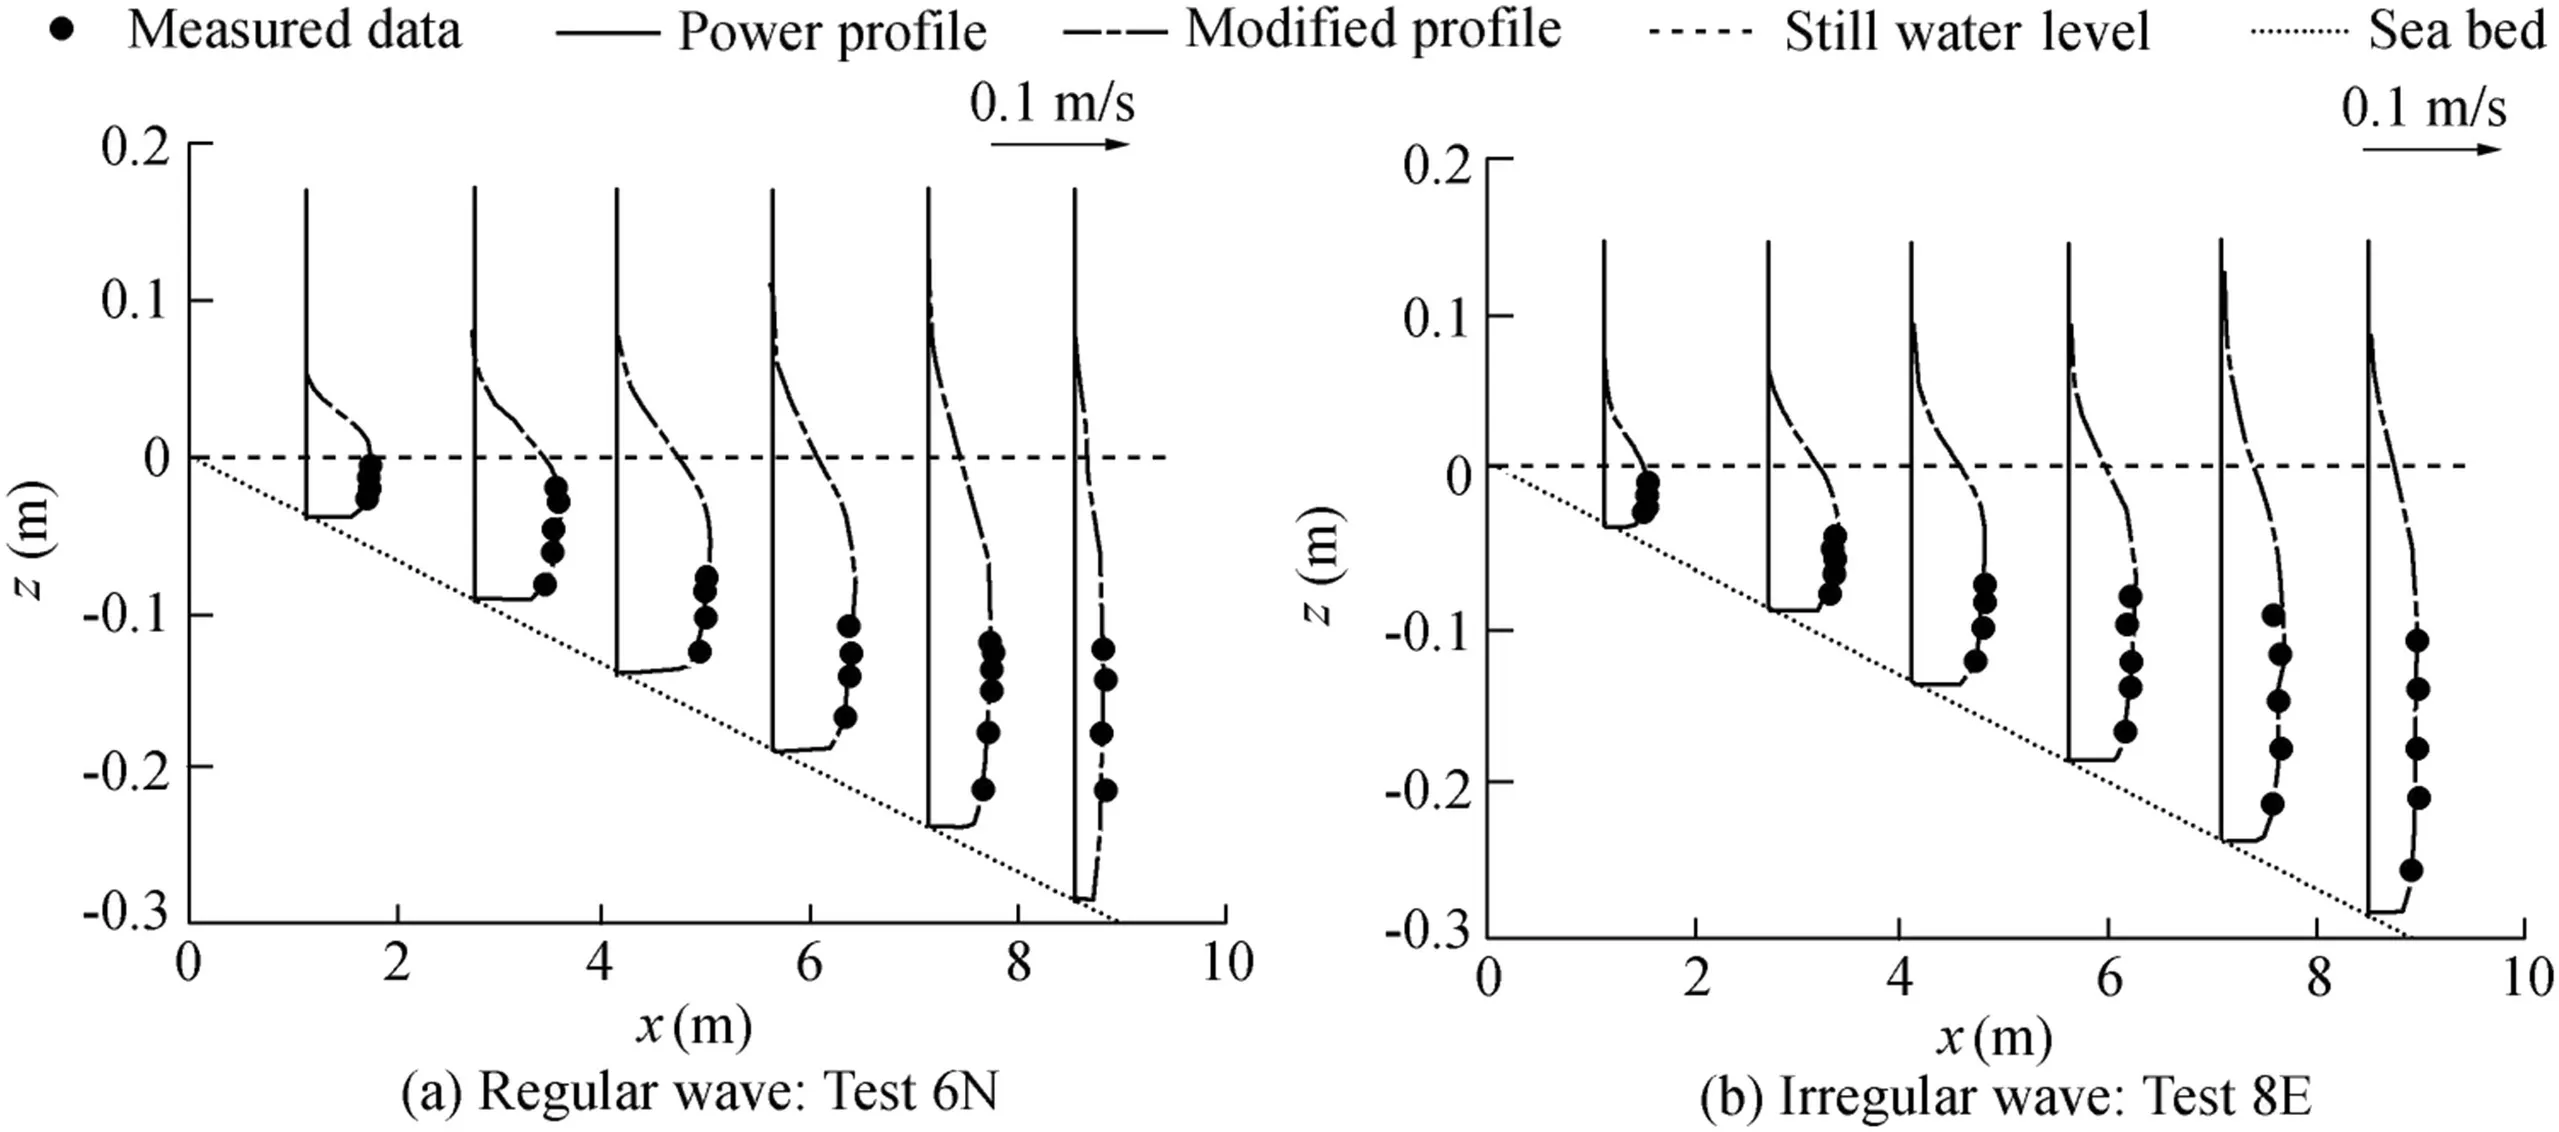
Fig.12.Vertical prof iles of longshore currents for Hamilton's experiment.
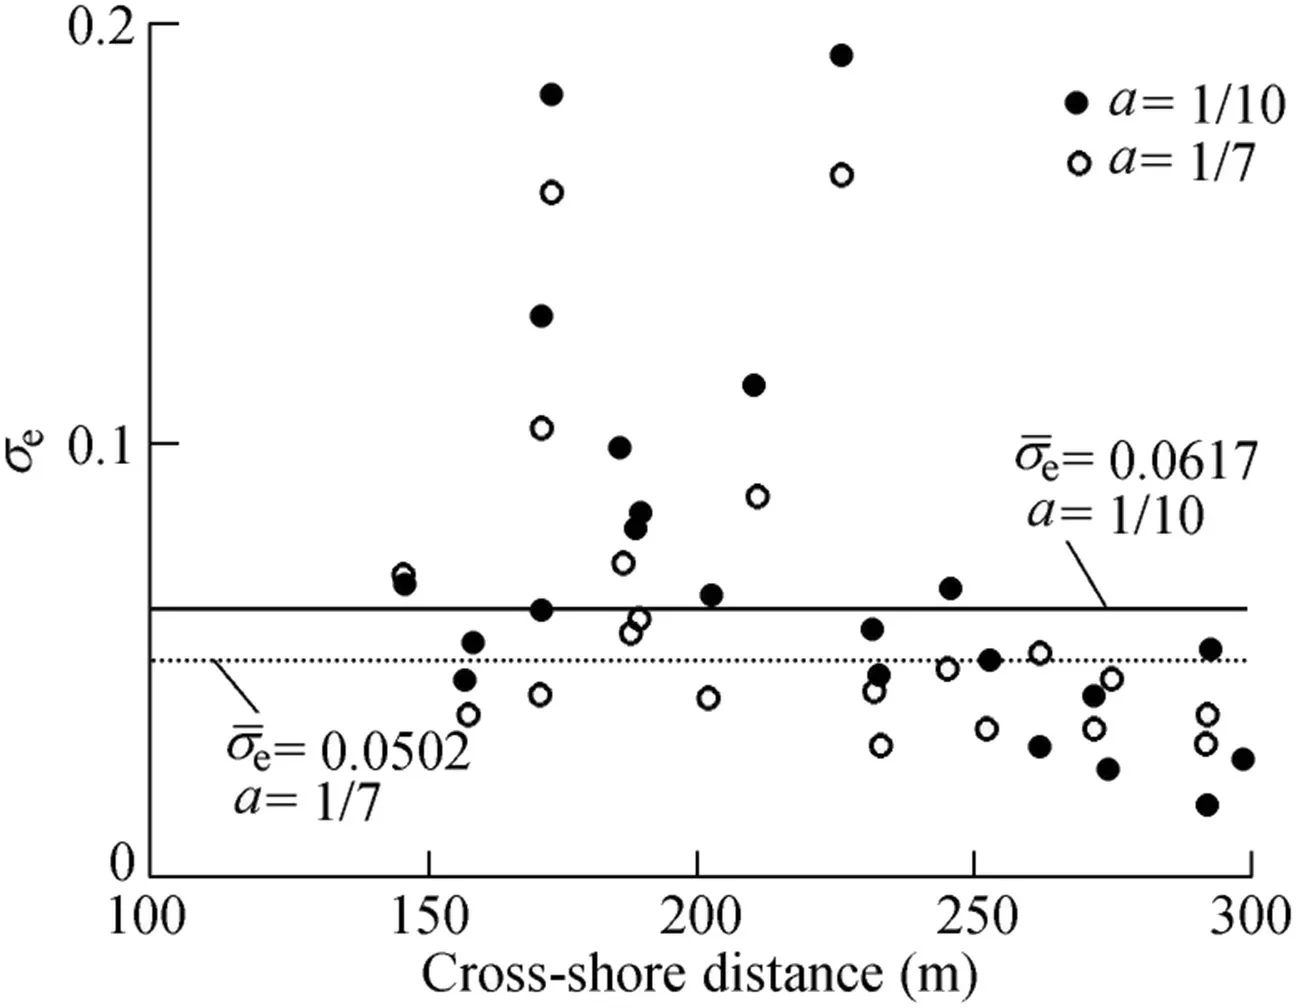
Fig.13.Values ofσe for DUCK94.
4.4.Experiment of Wang et al.(2002)
This experiment was performed at the Coastal and Hydraulics Laboratory of the U.S.Army Engineer Research and Development Center.Detailed description of the large-scale sediment transport facility(LSTF)is presented in Hamilton and Ebersole(2001).The unidirectional,long-crested irregular waves were produced and wave generatorswere oriented at 10°with respect to the shoreline.The data sets from test cases T1h(with awaveheight of 0.26 m and awaveperiod of 1.5 s)and T3g(with a wave height of 0.27 m and a wave period of 3.0 s)were used.The sand beach was approximately 25 cm thick,placed over a planar concrete base and extended 27 m alongshore and 18 m cross-shore.The velocity distribution was obtained at each ADV for eight vertical locations.

Fig.14.Vertical prof iles of longshore currents for DUCK94.
For this experiment,only the data outside the bottom boundary layer were used.The formula suggested by Sleath(1987)was used to calculate the boundary layer thickness.Fig.15 showsthevaluesofσewith a=1/10 and a=1/7.The mean values ofσeless than 0.15 are 0.0899 and 0.0770 for a=1/10 and a=1/7,respectively.Since the difference is small,a=1/10 isrecommended.If a=1/10,the percentages are 62.5%and 37.5%forσe≤0.15 andσe>0.15,respectively.The percentage is 25%withσe>0.15 for the spilling case.The magnitudes of the longshore current prof ile are rather similar under both the spilling and plunging breakers,but the spilling case generateslarger errors with most runs,as shown in Fig.15.The reason may be that the turbulence induced by the spilling breaker is less intense than that induced by the plunging breaker,and results in a large amount of vertical velocity prof ile variation.Thus,a larger value of a should be used,i.e.,a=1/3.For the larger error runs,if a=1/3,thevaluesofσewill belessthan 0.15.Fig.16 shows that the prediction of the longshore currents is acceptable.
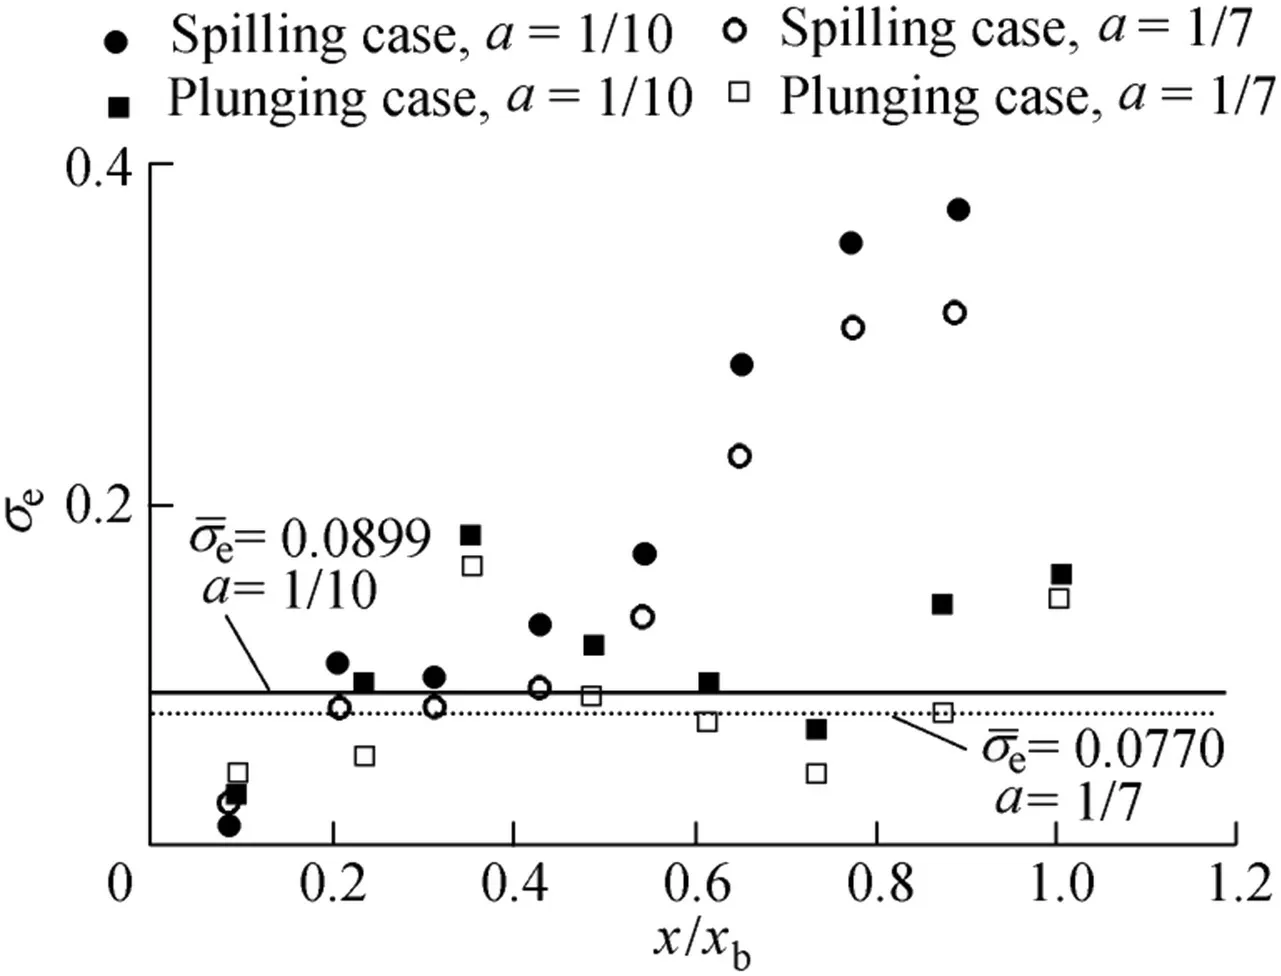
Fig.15.Values ofσe for LSTF.
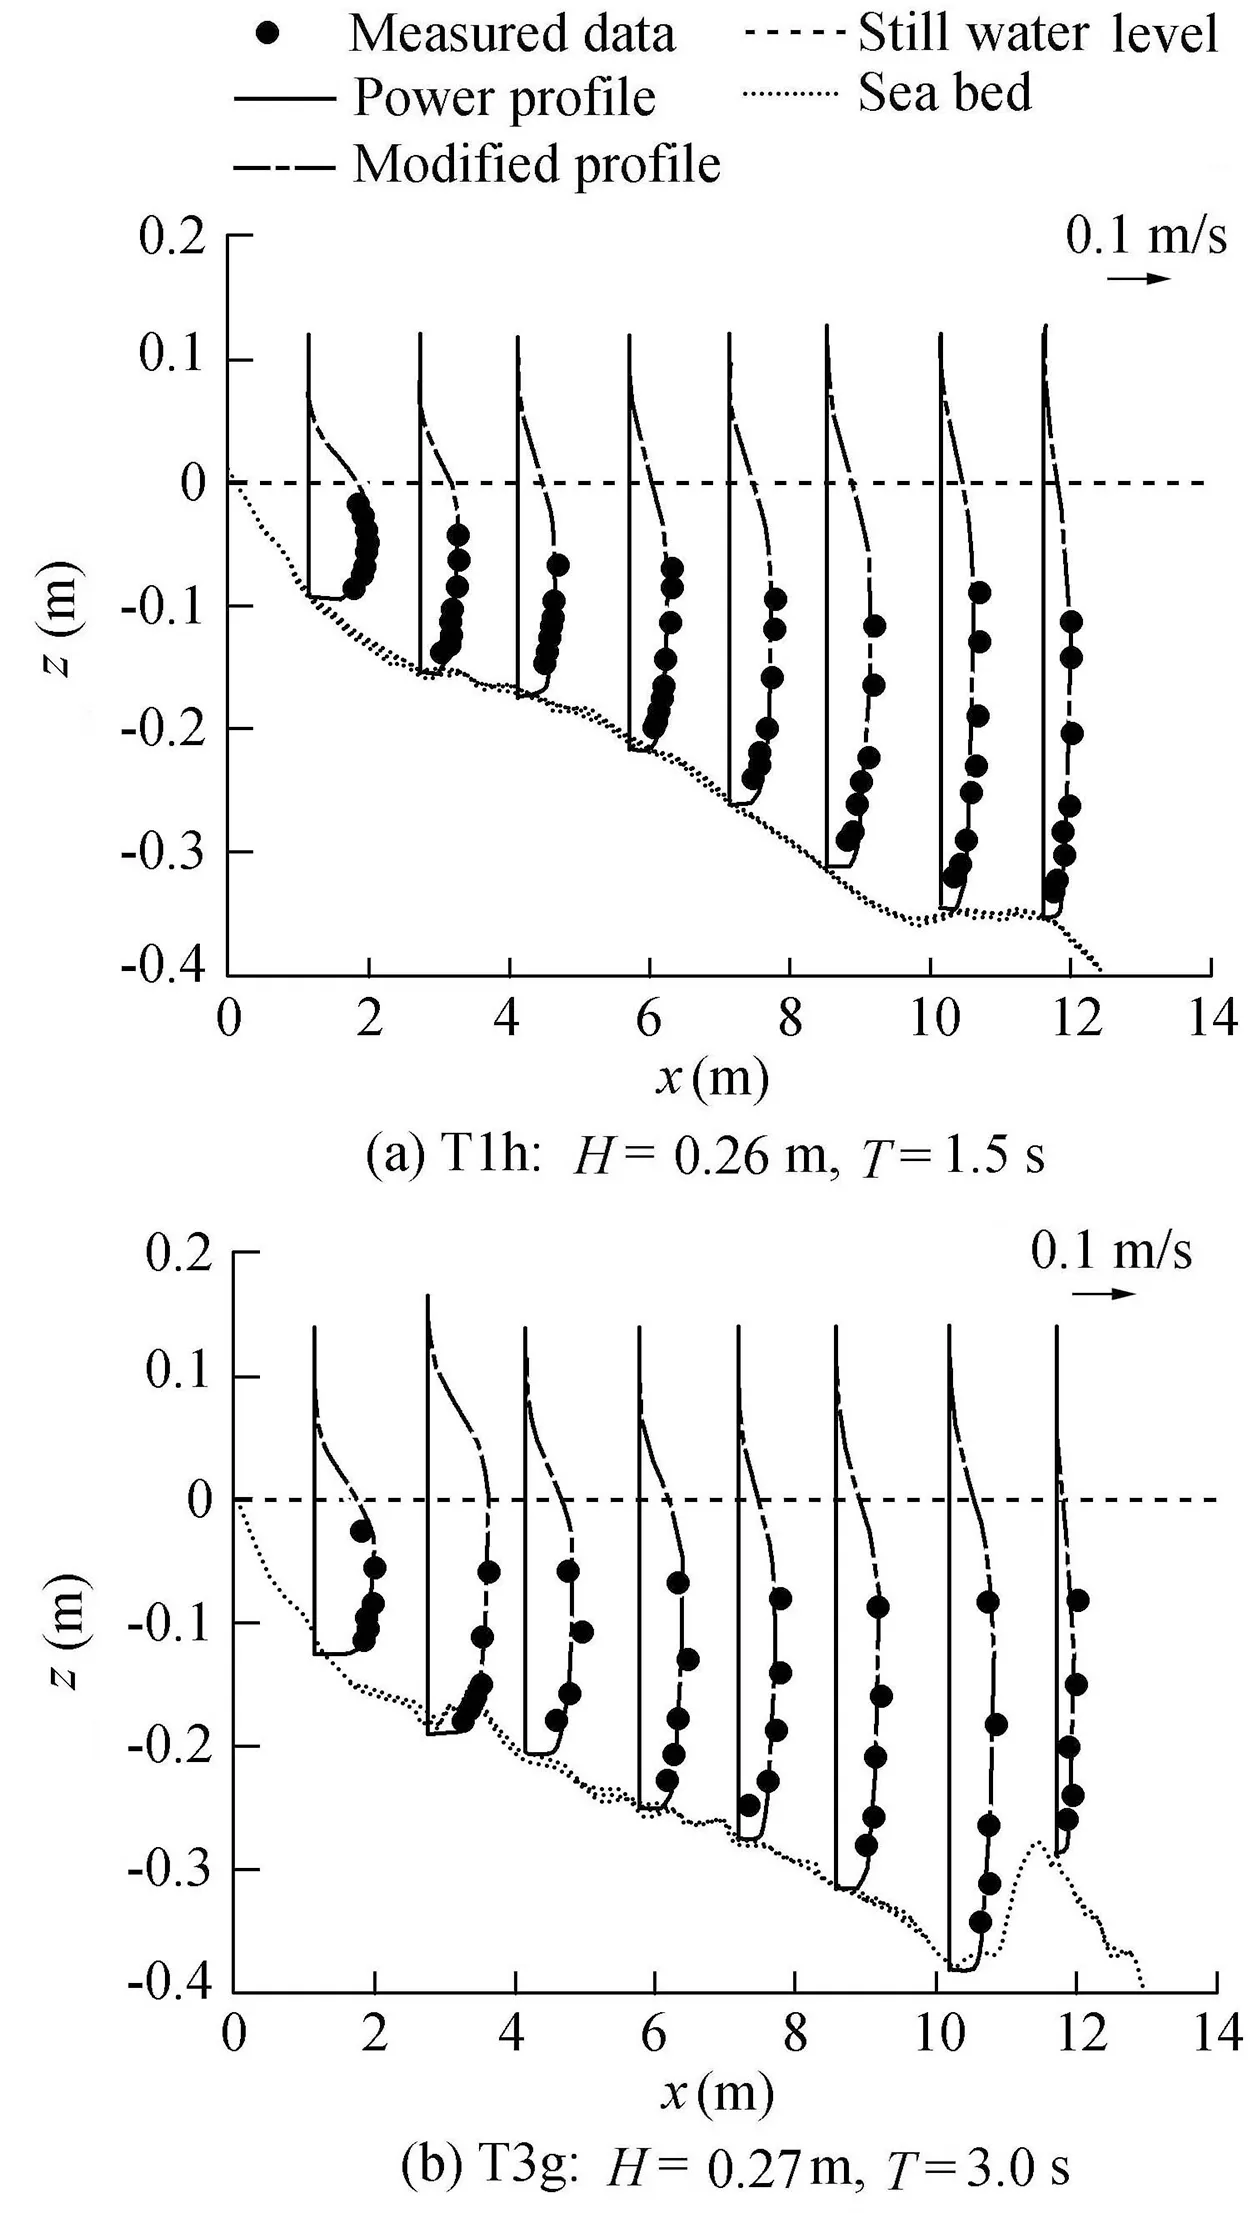
Fig.16.Vertical prof iles of longshore currents for LSTFmovable-bed experiment.
5.Conclusions
We performed a series of laboratory tests to determine the vertical prof ile of longshore currents over plane and barred beaches.The theory of the similarity principle proves that the logarithmic law and the power law for the mean velocity distributions in developed turbulent shear f low have equally rigorous theoretical foundations.In this study,a power law of the velocity prof ile was developed,and the measured velocity prof iles were used to determine the power index of this function.The only parameter contained in the formula is the depth-averaged velocity V,which can be determined through measurement,so it is easily used for the computation of the vertical prof ile of longshore currents.
The data f itting shows that a value of a=1/10 can provide a good f it for a plane beach.However,for a barred beach,different a values need to be used for different regions:for most parts of the region from the bar trough to the offshore side of the bar crest,a formula with a=1/10 and a=1/7 can provide a good f it;for the other parts,the region between the bar trough(x=4.0 m)and x=2.0 m,for which the measurement was performed at x=2.5 m,x=3.0 m,and x=3.5 m,the formula with a=1/3 can provide a good f it.
To investigate the overall performance of the power-type formula,formulas with a=1/10 and a=1/7 were applied to a wide range of laboratory and f ield experiments.The formula with a=1/10 produced reasonably good estimations of the vertical prof ile of longshore currents for laboratory and f ield data.
 Water Science and Engineering2019年1期
- Water Science and Engineering的其它文章
- Computational investigation of hydraulic performance variation with geometry in gabion stepped spillways
- Treatment of hydroxyquinone-containing wastewater using precipitation method with barium salt
- Modeling river water quality parameters using modif ied adaptive neuro fuzzy inference system
- Evaluation of copper removal eff iciency using water treatment sludge
- Biosorption of Ni(II)ions from aqueous solution using modif ied Aloe barbadensis Miller leaf powder
- Modeling water resources under competing demands for sustainable development:A case study of Kaligandaki Gorge Hydropower Projectin Nepal
