
Modeling river water quality parameters using modif ied adaptive neuro fuzzy inference system
2019-05-18 07:37:04ArminAzdHojtKrmiSeedFrzinSyedFrhdMousviOzgurKisi
Water Science and Engineering 2019年1期
Armin Azd ,Hojt Krmi ,*,Seed Frzin ,Syed-Frhd Mousvi ,Ozgur Kisi
a Faculty of Civil Engineering,Semnan University,Semnan 35131-19111,Iran
b Faculty of Natural Sciences and Engineering,Ilia State University,Tbilisi 0162,Georgia
Received 16 May 2018;accepted 18 November 2018
Available online 11 April 2019
Abstract Water quality is always one of the most important factors in human health.Artif icial intelligence models are respected methods for modeling water quality.The evolutionary algorithm(EA)is a new technique for improving the performance of artif icial intelligence models such as the adaptive neuro fuzzy inference system(ANFIS)and artif icial neural networks(ANN).Attempts have been made to make the models more suitable and accurate with the replacement of other training methods that do not suffer from some shortcomings,including a tendency to being trapped in local optima or voluminous computations.Thisstudy investigated the applicability of ANFISwith particle swarm optimization(PSO)and ant colony optimization for continuous domains(ACOR)in estimating water quality parameters at three stations along the Zayandehrood River,in Iran.The ANFIS-PSO and ANFIS-ACOR methods were also compared with the classic ANFISmethod,which uses least squares and gradient descent as training algorithms.The estimated water quality parameters in this study were electrical conductivity(EC),total dissolved solids(TDS),the sodium adsorption ratio(SAR),carbonate hardness(CH),and total hardness(TH).Correlation analysis was performed using SPSS software to determine the optimal inputs to the models.The analysis showed that ANFIS-PSO was the better model compared with ANFIS-ACOR.It is noteworthy that EA models can improve ANFIS'performance at all three stations for different water quality parameters.©2019 Hohai University.Production and hosting by Elsevier B.V.This is an open access article under the CC BY-NC-ND license(http://creativecommons.org/licenses/by-nc-nd/4.0/).
Keywords:Water quality parameters;ANFIS;Evolutionary algorithm;Particle swarm optimization;Ant colony optimization for continuous domains
1.Introduction
Rivers and surface f lowing waters have always been considered important natural resources.Normally,communities,industrial centers,and agricultural areas are established alongside the water resources.Human activities have introduced numerous types of pollution into natural water resources.Pollution has reached dangerous levels in the water resources of many parts of the world.The majority of governmentsare concerned about the quality of their environment with one key factor being the natural water quality(Adriaenssens et al.,2004;Azad et al.,2018b).Water quality is analyzed through its chemical,physical,and biological parameters(Dogan et al.,2009).
Water quality is a measure of the usefulness of water resources.For instance,salt and sodium contents are two detrimental water quality parameters for agriculture.These two parametersaffect thewater adsorption rateof the soil,and therefore negatively affect plant growth.They determine the suitability of the water for irrigation.The next important parameter in water quality is water hardness.A high degree of water hardness may cause indigestion and digestive problems.This parameter is important in urban drinking water and also in industry.
Owing to several benef its,scholars have tended toward application of artif icial neural network(ANN)and adaptive neuro fuzzy inference system(ANFIS)methods to model water quality(Olyaie et al.,2015;Orzepowski et al.,2017).The researchers who have applied these methods have reported high accuracy compared to empirical or regression studies.Whereas a linear relationship is assumed between actual and estimated values in the statistical methods applied to water quality studies,ANN can depict a nonlinear relationship stemming from the real properties of the ecosystem(May and Sivakumar,2009).Also,many studies using artif icial intelligence as a method to predict parameters have been conducted in different areas(Barzegar et al.,2017;Nadaf Fahmideh et al.,2017;Nguyen et al.,2017).These methods have been used for weather forecasting and estimation of environmental and hydrological processes(Wu and Chau,2011;Emamgholizadeh et al.,2014;Wang et al.,2014;Ay and Kisi,2017;Heidarzadeh,2017;Nie et al.,2017;He et al.,2018;Kisi et al.,2019).
While classic soft computing models,such as ANFIS and ANN,have various advantages(Kisi et al.,2019),there are some problems with them that weaken their ability,especially in modeling complex hydrological phenomena.Classic models,especially ANFIS,are mostly trained by gradient approaches and back propagation.Although these methods train the system appropriately in many occasions,the performance of the model can be improved by avoiding the weaknessesof thesemethods,such astheir tendency to causevalues to be trapped in local optima,their use of local search methods,over-f itting,and weak performance whenever the structure becomes complex.The evolutionary algorithm(EA)is a method of training the system,which not only has many benef its of classic methods but also does not suffer from the abovementioned problems.The EA system provides better training,and as a result,the quality of modeling is def initely improved.During recent years,some EA methods have been used to model various hydrological and environmental phenomena(Olyaie et al.,2015;Nie et al.,2017;Kisi et al.,2017a,2017b,2019).The properties of these methods are different.Therefore,the most appropriate method should be selected with respect to the problem in hand.
Jalalkamali(2015)predicted spatiotemporal groundwater quality parameters using ANFIS with a genetic algorithm(GA),and ANFIS with particle swarm optimization(PSO).The results suggested that both models have acceptable eff iciency in the prediction of chloride concentration,electrical conductivity(EC),and pH.Tabari(2016)predicted daily runoff of the Taleghan River,in Iran,with a hybrid model(fuzzy theory and direct search optimization algorithm).The results showed that the suggested model showed a strong performance in prediction of daily runoff.In a similar study,Kisi et al.(2017a)improved the ANN performance in modeling groundwater parameters with PSO and a differential evolution(DE)algorithm.The results showed that ANN-DE and ANN-PSO were able to model suff iciently the sodium adsorption ratio(SAR)and EC.In another study,Kisi et al.(2017b)predicted the groundwater-level f luctuations with two hybrid models(ANN-PSO and ANN-GA).The results showed that GA and PSO performed strongly in optimizing the ANN structure to predict the groundwater-level f luctuations.Azad et al.(2018a)reported that the ant colony optimization for continuous domains(ACOR)algorithm showed reasonable performance in predicting river f low prediction.According to the report,DEprevented over-f itting and being trapped in local optima phenomenon.Kisi et al.(2019)used EA in order to train classic ANFIS to predict groundwater quality parameters.The results showed that PSO performed well in improving the ANFISperformance.
According to the literature review,ANFIS has performed suitably in modeling water quality parameters.However,due to the use of least squares and gradient descent as training algorithms,the abovementioned problem will occur,and as a result,the quality of modeling will decrease.
The objectives of the present study included(1)application of EA in training of ANFIS for prediction of water quality;(2)using ANFIS and its improvements with two heuristic algorithms,namely PSO and ACOR,for estimation of water quality parameters at three stations on the Zayandehrood River,namely at Eskandari(upstream),Musian(middle reaches),and Varzaneh(downstream),as the water quality changes signif icantly between these three stations;(3)comparison between ANFISand its two modif ied models,one with PSO(ANFIS-PSO)and the other with ACOR(ANFIS-ACOR);and(4)selection of the best algorithm for training ANFIS.This is the f irst study that compared the ability of ANFIS-PSO,ANFIS-ACOR,and classic ANFIS models in modeling water quality.
2.Materials and methods
2.1.Study area and data collection
The Zayandehrood Basin is located in the central part of Iran,with longitudes 50°24′E to 53°24′E and latitudes 31°11′N to 33°42′N,an area of 41500 km2,and an elevation ranging from 1466 to 3974 m above mean sea level.The average annual precipitation in the study area varies between 1500 mm in the west and 50 mm in the east,with an average value of 140 mm.Average annual maximum,minimum,and mean temperaturesare42°C,12.5°C,and 14.5°C,respectively.The climate of the basin is semi-arid.Potential annual evapotranspiration in the region is 1900 mm.The average annual natural f low of the Zayandehrood River is about 900 million m3.This river originates on the eastern slopes of the Zagros Mountain Range and travels about 350 km eastward before ending in the Gavkhuni Swamp(Fig.1),southeast of Isfahan(Rezaei et al.,2013).The water quality at Eskandari Station is completely different from that at Musian and Varzaneh stations.For example,the mean EC changes from 496μS/cm at Eskandari to 23470μS/cm at Varzaneh.Therefore,the Zayandehrood Basin is a good case for estimating the ability of the EA method in improving the performance of ANFIS.It is noteworthy that these differencesare due to the entrance of agricultural,industrial,and urban runoff and wastewater into the river.
In this study,data of water quality parameters over a 14-year period(2001-2015)were obtained from the Isfahan Regional Water Authority.These data included EC,total dissolved solids(TDS),SAR,carbonate hardness(CH),total hardness(TH),pH,and concentrations of sodium(Na+),chlorine,carbonate,bicarbonate(HCO-3),sulfate,magnesium,and calcium.

Fig.1.Sketch of Zayandehrood River.
2.2.Adaptive neuro fuzzy inference system
Fuzzy set theory was f irst introduced in 1965 to provide a mathematical formulation for incomplete or imprecise information,concepts,or systems.The formulation can be used for reasoning,inference,control,and decision-making(Zadeh,1965).ANFIS was f irst proposed in 1993 as an attempt to combine the capabilities of a fuzzy system and the numerical capabilities of a neural network to provide a framework for powerful modeling(Jang,1993).ANFIS uses a learning algorithm of theneural network and fuzzy logic systemsin order to provide a nonlinear depiction of the input-output relationship.
In the present study,three fuzzy generation methods,grid partitioning(GP),subtractive clustering(SC),and fuzzy cmeans clustering(FCM),were used for generating the basic fuzzy inference system(FIS).Results showed that the FCM had the best ability to predict the water quality parameters of river f low(Mirrashid,2014;Azad et al.,2019).Therefore,the FCM method was selected for optimizing the simple ANFIS structure.Optimum values of step-size decrement,initial increment,epochs,initial step size,and number of clusters were 0.95,1.10,400,0.01,and 10,respectively.Thesevalueswereselected after trying different numbersand they had the best results.Available data were divided into two parts:70%were used for training and 30%were used for testing.
2.3.Hybrid model of ANFISand PSO
PSO is a heuristic algorithm based on the stochastic optimization method that was f irst introduced by Eberhart and Kennedy(1995).Characteristics such as low computational volume,easy implementation,non-dependence on problem situations,high convergence speed,global search capability,the ability to solve complex issues,and the ability to escape from local optima have led to the use of PSOfor solving many of the optimization problems(Taormina and Chau,2015).Also,the classic training methods of ANFIS,such as gradient descent-based methods,do not have the appropriate ability to train ANFISfor modeling some phenomena with high natural turbulence.Their poor performance is due to the probability of being trapped in local optima,the high computational volume,and some other problems.For modeling water quality,PSO might beasuitablemethod for optimization and training of the mentioned model.
The PSO method considers each solution a particle in the search domain.Each particle has a f itness value that is being validated by a f itnessfunction to be optimized.Particle i has a position in the d-dimensional spaceof theproblem that isto be solved and its t th iteration is shown in Eq.(1).Thevelocity of particle i(V),which directs its movement and its t th iteration is shown in Eq.(2).Each particle uses a memory represented by vector P(Eq.(3))to remember the best position it has achieved in each iteration.

Each particle is updated after each iteration with two best values.The f irst value is the best solution(pbest).The second value is the best position achieved within the population.This value is the global best(gbest).PSO pursues this value.After determining the pbest and gbest,the position and velocity of each particle are updated using Eqs.(4)and(5).

where C1and C2are the learning factors,which control the displacement of a particle(particle displacement)after each iteration,and normally,C1=C2=2;r1and r2are two random numbers,which have a range[0,1];W is the inertia weight,which gets an initial value ranging within[0,1],and Pgis the position related to the best particle among other members.
In PSO,the population is initialized by random solutions.The f itness of the population is recalculated iteratively up to the point of reaching the termination condition with pbest,gbest,position,and velocity updated in every iteration.The system,f inally,yields gbest and its f itness value.The termination condition may bedef ined,for example,asachieving the maximum number of iterations or arriving at a certain f itness value for gbest.
In this study,PSO was used for optimizing and training ANFISin order to predict the water quality parameters of theZayandehrood River.Estimation of these parameters by ANFIS-PSO had six stages:
(1)Loading the input and output data to the system:First,the ratio of training and testing stagesis determined.Then,the best values of the parameters of PSO are determined,such as the number of iterations,the initial population size,the learning rate,the lower and upper bounds of velocity,the global and personal best learning coeff icients(gbest and pbest),the intended error,and other relevant parameters.
(2)Estimating thevalue of the mentioned parametersby the system(in the zero iteration).
(3)Generating an FISand optimizing it with the suggested method:First,an FIS is generated using one of the SC,GP,and FCM methods.After that,the selected FIS is optimized with the proposed method(PSO)according to the following steps:(a)According to the problem purpose,an initial population size is generated and a variance and average amount are set for water quality parameter data.(b)The best personal and global experience are updated,and Eq.(4)is used for calculation of the updated velocity for each particle.(c)The new position of each particle is updated using Eq.(5).(d)The value of E is calculated with Eq.(6):where QTargetand QModelare theobserved and predicted values of the water quality parameter,respectively,and E is the difference between the observed and predicted values.If the E value reached the acceptable error,then the process goes to stage(4).Otherwise,setting the counter(counter+1):If the counter is greater than the maximum number of maxiter(maximum iteration),the optimization and training is stopped and the model goes to stage(4).Otherwise,the model returns to stage(3)and the new variance and average values of the output parameter were calculated using the latest data.

(4)Choosing the last average and variance values as the optimal calculation of the output parameters.
(5)Using thebest valuesto predict the SAR,EC,and TH of the Zayandehrood River.
(6)Modeling water quality parameters and evaluating the system performance using some error indices such as the coeff icient of determination(R2)and root mean square error(RMSE).
It is noteworthy that optimal values of inertia weight,maximum iteration,the inertia weight reduction factor,population size,and personal and global best learning coeff icients were 1,1000,0.99,100,2.1,and 2.1,respectively.
2.4.Hybrid model of ANFISand ACOR
Ant colony optimization(ACO)is one of the most useful algorithms for optimizing environmental and hydrological problems.This method was f irst introduced by Dorigo(1992).ACO is a probabilistic technique for solving computational problems that can be reduced to f inding good paths through graphs.In theprocessused by antsto search for food,each ant leaves a trace that is called pheromones.When the source of food and the path of an ant in that direction are found,the pheromone is strengthened.Thus,the remaining ants become aware of the correct path(optimal route),and the most appropriate route for getting food and optimizing the problem is determined.
Despite performing well in optimizing discrete problems,ACO has a low ability to optimize continuous problems.It is notable that hydrological and environmental problems are often continuous.Socha and Dorigo(2008)introduced ant colony optimization for continuous domains(ACOR)in order to increase ACO's ability to optimize continuous problems.
The fundamental idea underlying ACORis the shift from using a discrete probability distribution to using a continuous one,that is,a probability density function(PDF)(Socha and Dorigo,2008).The process of running ACORis composed of three steps.First,before giving an in-depth description of the ACORalgorithm,we should select the most suitable PDF.Several PDFs were tested for it and Gaussian PDF showed the best performance.Therefore,it was chosen as the PDF in this study.Second,pheromone information of ACO is stored in combinatorial optimization.In each iteration,an ant utilizes some values as a discrete probability distribution when selecting a component to be added to the existing partial solution.The selection of the ant isnot restricted to a f inite set in continuous optimization.Consequently,it is diff icult to provide the pheromone as a table.An alternate approach must be adopted.Finally,the ACORversion of the three major algorithmic components of the ACO metaheuristic is outlined(Socha and Dorigo,2008).
Despite the low convergence speed,ACORhas an acceptable performance for optimizing continuous problems.This algorithm usestheglobal search technique,escapesfrom traps in local optima,and has a suff icient ability to optimize problems with specif ic complexities.These reasons make this algorithm an appropriate option for optimizing and training ANFIS.In the modif ied model(ANFIS-ACOR),like PSO,the algorithm tries to propose the best variance and average values.It is notable that optimal values of population size,maximum iteration,power factors of pheromone(α)and heuristic(β),conversion ratio f itness to pheromones(Q),and evaporation of pheromones(Roh)were 45,350,1.6,1,10,and 0.02,respectively.
3.Results and discussion
Table 1 provides the water quality statistics of three main stations along the Zayandehrood River(i.e.,Eskandari(upstream),Musian(middle reaches),and Varzaneh(downstream))in Isfahan Province,Iran.From this table,it can be seen that there is a high degree of difference between Varzaneh and Eskandari(or Musian).Statistical measures such as coeff icient of determination(R2),root mean square error(RMSE),mean absolute percentage error(MAPE),and delta percent(δ)were used to explain the results of the analyses.Eqs.(7)-(10)are the respective formulations of these four measures:

Table 1Water quality parameters at designated stations.
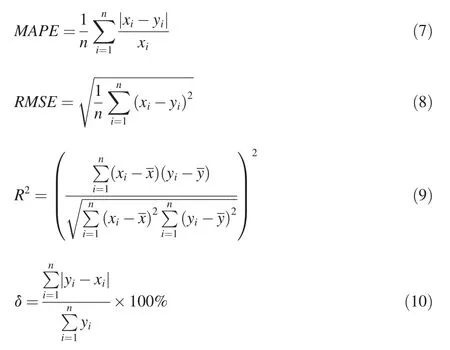
where xianddenote the observed and estimated values,x anddenotethemean observed and estimated valuesobtained from ANFIS and its two improved models,and n is the number of data points.
Three models,ANFIS,ANFIS-PSO,and ANFIS-ACOR,were coded in MATLAB R2014a software.Data analysis was performed on 14 years'worth of historical water quality data from 2001 to 2015.The historical dataweremadeavailableby the Water Authority of Isfahan Province.
A set of parameters was selected for training ANFIS.Linear regression analysis was performed with SPSSsoftware on the existing parameters including TDS,EC,pH,HCO-3,Cl-,SO2-4,Mg2+,Na+,K+,CO2-3,Ca2+,CH,and TH.Tables 2-4 show the results of the analysis conducted on the data from Eskandari,Musian,and Varzaneh stations.The performance of each model was analyzed based on the statistical indicators of their predicted parameters.Because of a high linear relationship between EC and TDS,only one of them was used when appropriate.Table 5 shows the model inputs selected for each parameter.The most and least effective parameters are also included in this table.Three input parameters that have the highest correlations with the output were selected for each model.It is noteworthy that three parameters were considered as the inputs for all targets(EC,TDS,SAR,CH,and TH).A small number of inputs were considered here because of the needed memory space and also the computation volume in the classic ANFISmethod.
3.1.Electrical conductivity
Table 5 shows that TH,Cl-,and Na+have the highest correlations with EC.They were used as model inputs for the Zayandehrood River.Performance indices of each ANFIS model are reported in Table 6.According to the average statistics derived from three stations,ANFIS-ACORwas judged to be the best model for predicting EC(mean R2was 0.96,mean MAPE was 5.52,and meanδwas 4.91%).ANFIS-PSO(mean R2was 0.93,mean MAPE was 5.80,and mean δwas 5.59%),and ANFIS(mean R2was 0.79,mean MAPE was 9.84,and meanδwas 9.70%)ranked second and third,respectively.
The average change of EC estimates at different stations ranged from 495μS/cm at Eskandari Station to 23470μS/cm at Varzaneh Station.It is noteworthy that the jump in EC at Musian Station is due to the entrance of the Segzi drainage canal into the downstream reaches of the Zayandehrood River.The classic ANFIS model performed poorly in estimation of EC.Introduction of improved algorithms modif ied the results to an acceptable level.PSO performed better in the training step,while ACORperformed better in the testing step.Only the performance of the best model,i.e.,ANFIS-ACOR,is illustrated in Fig.2 for the testing step.
3.2.Total dissolved solids
The average change of TDSestimates at different stations ranged from 322 mg/L at Eskandari Station to 15094 mg/L at Varzaneh Station.The similarity of EC and TDS trends is an indication of a highly linear relationship between these two parameters.A comparison between input valuesand estimated values of these two parameters at different stations resulted in a signif icance level of 0.65.Tables 2-5 show that TH,Na+,and Cl-are the elements with the most signif icant effect on ECand TDSestimates,while pH isthe least effectiveelement at Eskandari Station and Musian Station.

Table 2Correlation coeff icients between water quality parameters of Eskandari Station.

Table 3Correlation coeff icients between water quality parameters of Musian Station.
When comparing the performance of the models for each station,ANFIS-ACORranked second while ANFIS-PSO had the best accuracy for Eskandari Station.In the case of Musian Station,performance analysis of the models ranked ANFISACORas the best predictive model(R2=0.98,RMSE=3.55,and MAPE=3.54),ANFIS-PSO ranked second(R2=0.97,RMSE=3.94,and MAPE=4.42)and ANFIS ranked third(R2=0.95,RMSE=4.36,and MAPE=5.24).At Varzaneh Station,ANFIS-PSO ranked f irst(Table 6).It is noteworthy that the poorer performance of ANFIS compared to ANFISPSO and ANFIS-ACORintroduced EA as a reliable method.On the other hand,a weak performance of ANFIScould have been due to trapping in the local optimum.
Due to space limitation in this article,only scatter plots of ANFIS-PSO are shown in Fig.3 because it generally performed better than ANFIS-ACORin predicting TDS.

Table 4Correlation coeff icients between water quality parameters of Varzaneh Station.

Table 5Input parameters for each station.
3.3.Sodium adsorption ratio
The average change of the estimated SAR at different stations ranged from 0.318 at Eskandari Station to 27.460 at Varzaneh Station.Tables 2-5 show that Na+is the most effective element for SAR estimates while pH and CH are the least effective elements.Analysis of the results obtained at Eskandari Station indicated that ANFIS-PSO was the best predictive model(R2=0.99,RMSE=0.10,MAPE=5.46,andδ=4.40%).ANFIS-ACORranked second(R2=0.98,RMSE=0.13,MAPE=9.67,andδ=9.23%)and ANFIS ranked third(mean R2was 0.94,mean RMSE was 0.13,mean MAPE was 8.72,and meanδwas 10.20%)(Table 6).ANFISACORwas rated higher than ANFISbecause of having more favorable indicators in spite of higher MAPE.
Analysis of the results obtained at Musian Station indicated that ANFIS-ACORwas the best predictive model and it had similar accuracy to that of ANFIS-PSO.ANFIShad theweakest performance.Analysisof theresultsobtainedat Varzaneh Station produced asimilar outcometothatof Eskandari Stationwithone exception:ANFIS performed better than ANFIS-ACOR(R2values are 0.92 and 0.97 for ANFIS-ACORand ANFIS,respectively;and RMSE valuesare1.52and 1.21for ANFIS-ACORand ANFIS,respectively)(Table 6).This could be due to the capability of the classic and the suggested methods to model phenomenain differentsituations.Based on previousstudies,and as explained earlier,classic ANFIS faces problems whenever the structure becomes complex or there are some complex inputs.Where there are some suitable inputs,classic ANFIS has an acceptableperformance(Azad etal.,2018a).Inthepresentcase,inputs used for modeling Eskandari Station(Na+,TDS,and)showed low linear regression with the output.Therefore,itisexpected thatthemodif ied ANFISwould perform better(Table 5).However,at Varzaneh Station,inputs had suitable linear regression with the output.Therefore,it was easier modeling,and,as a result,classic ANFISshowed a better performance.Fig.4 shows the scatter plots for the ANFIS-PSO model,which produced superior results compared to the other models.
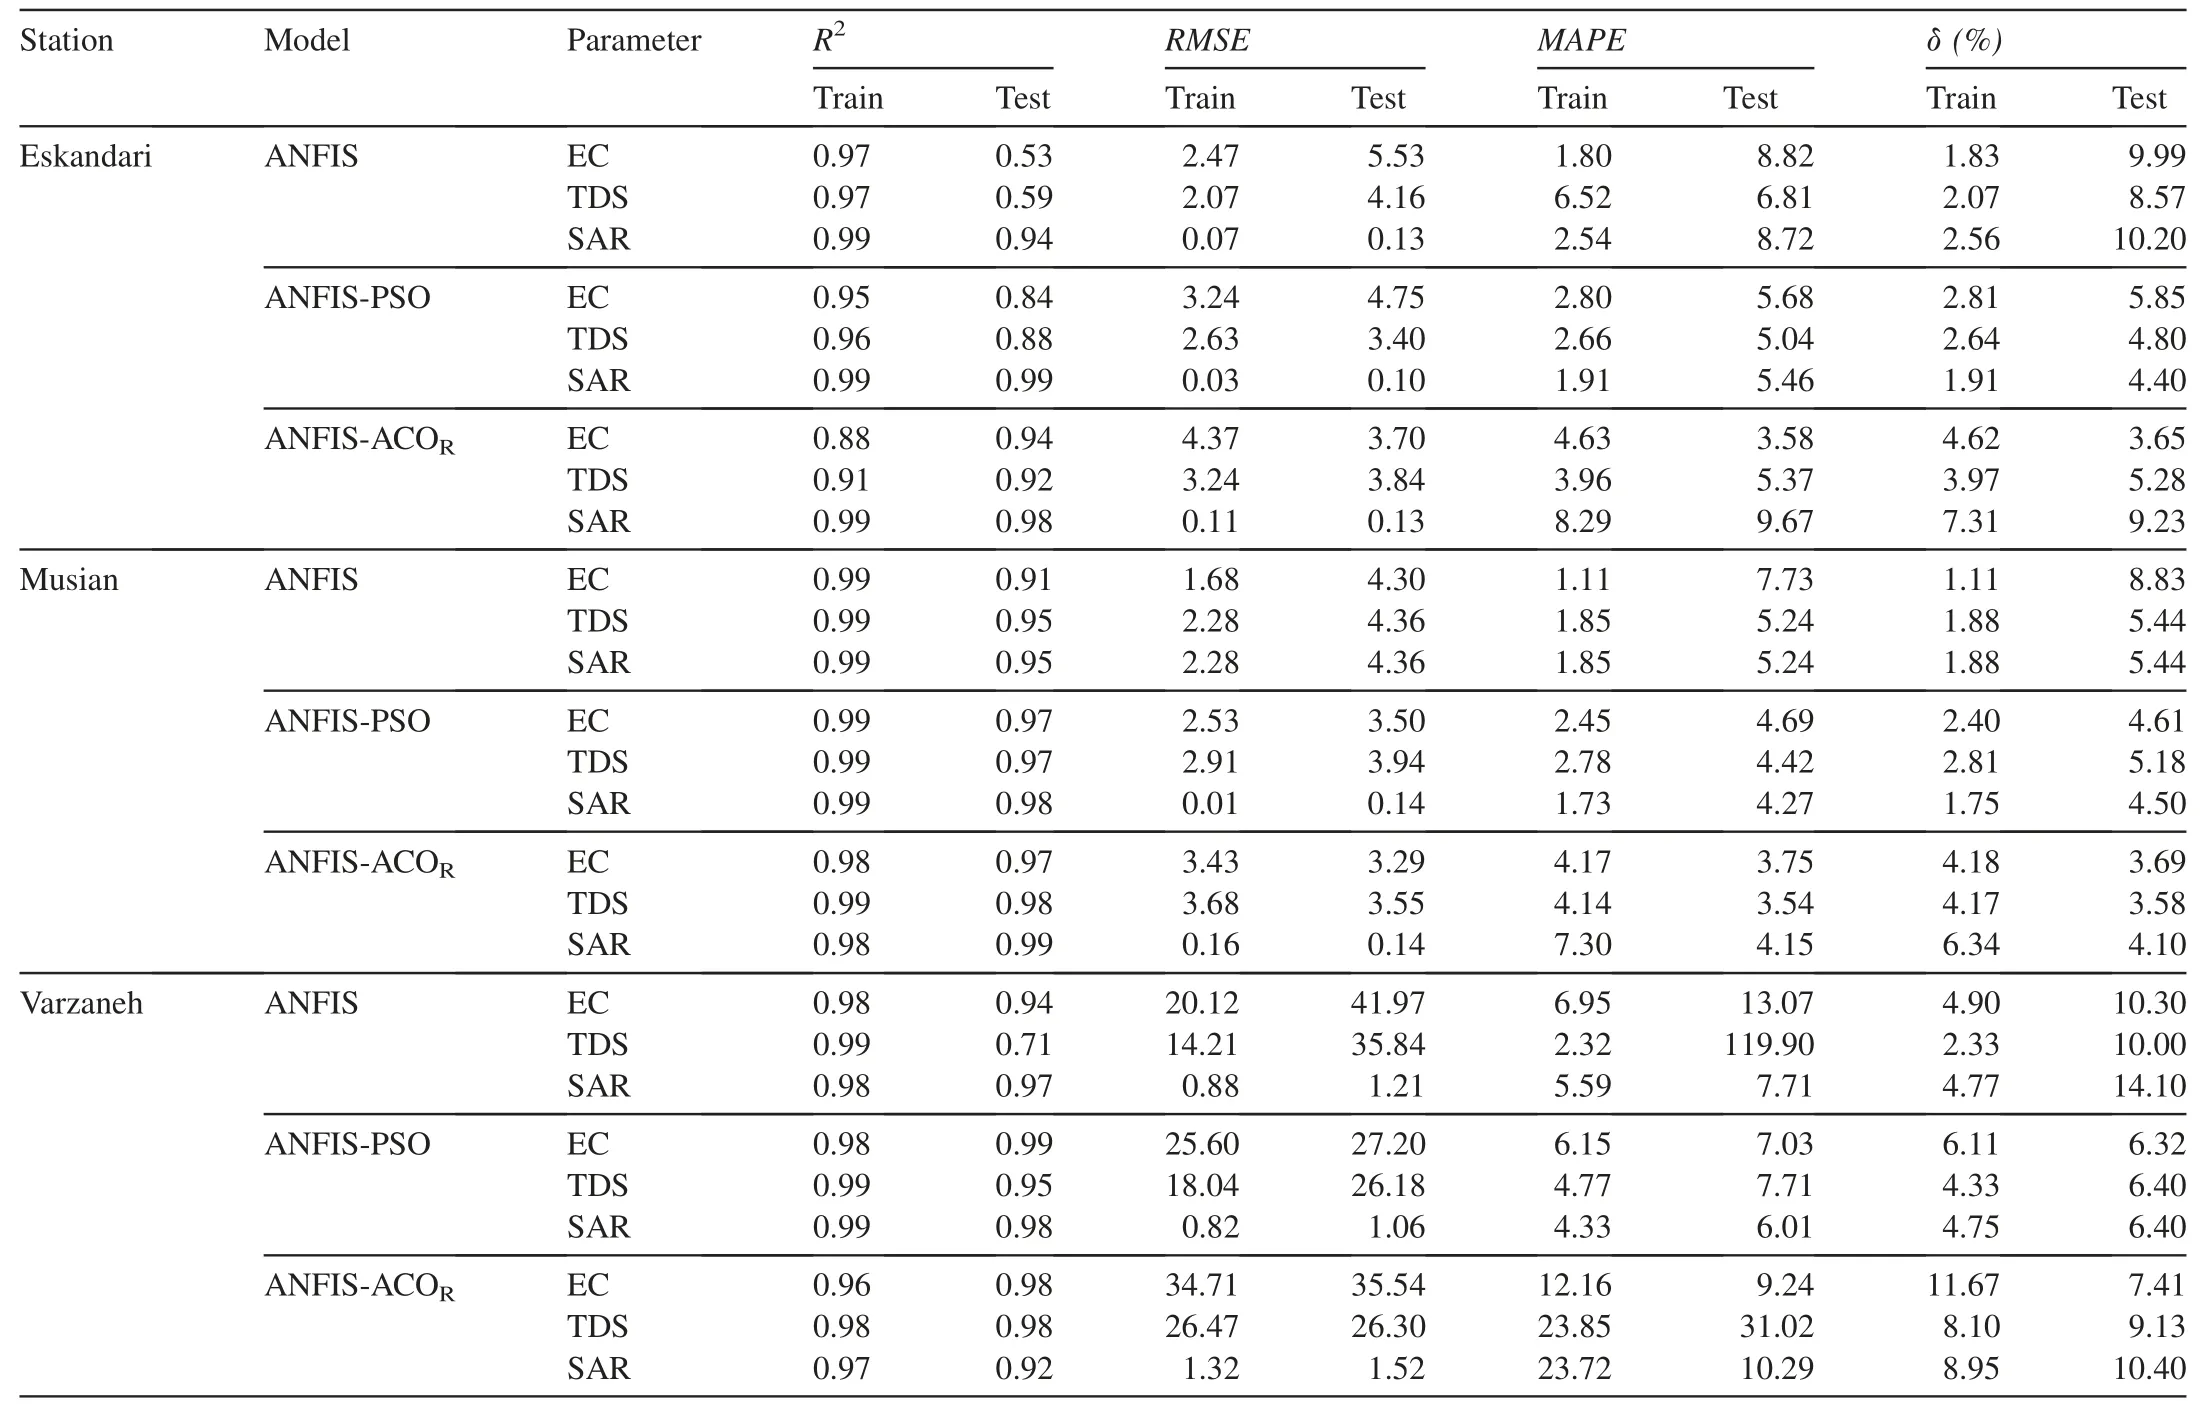
Table 6Performance indices for EC,TDS,and SAR.
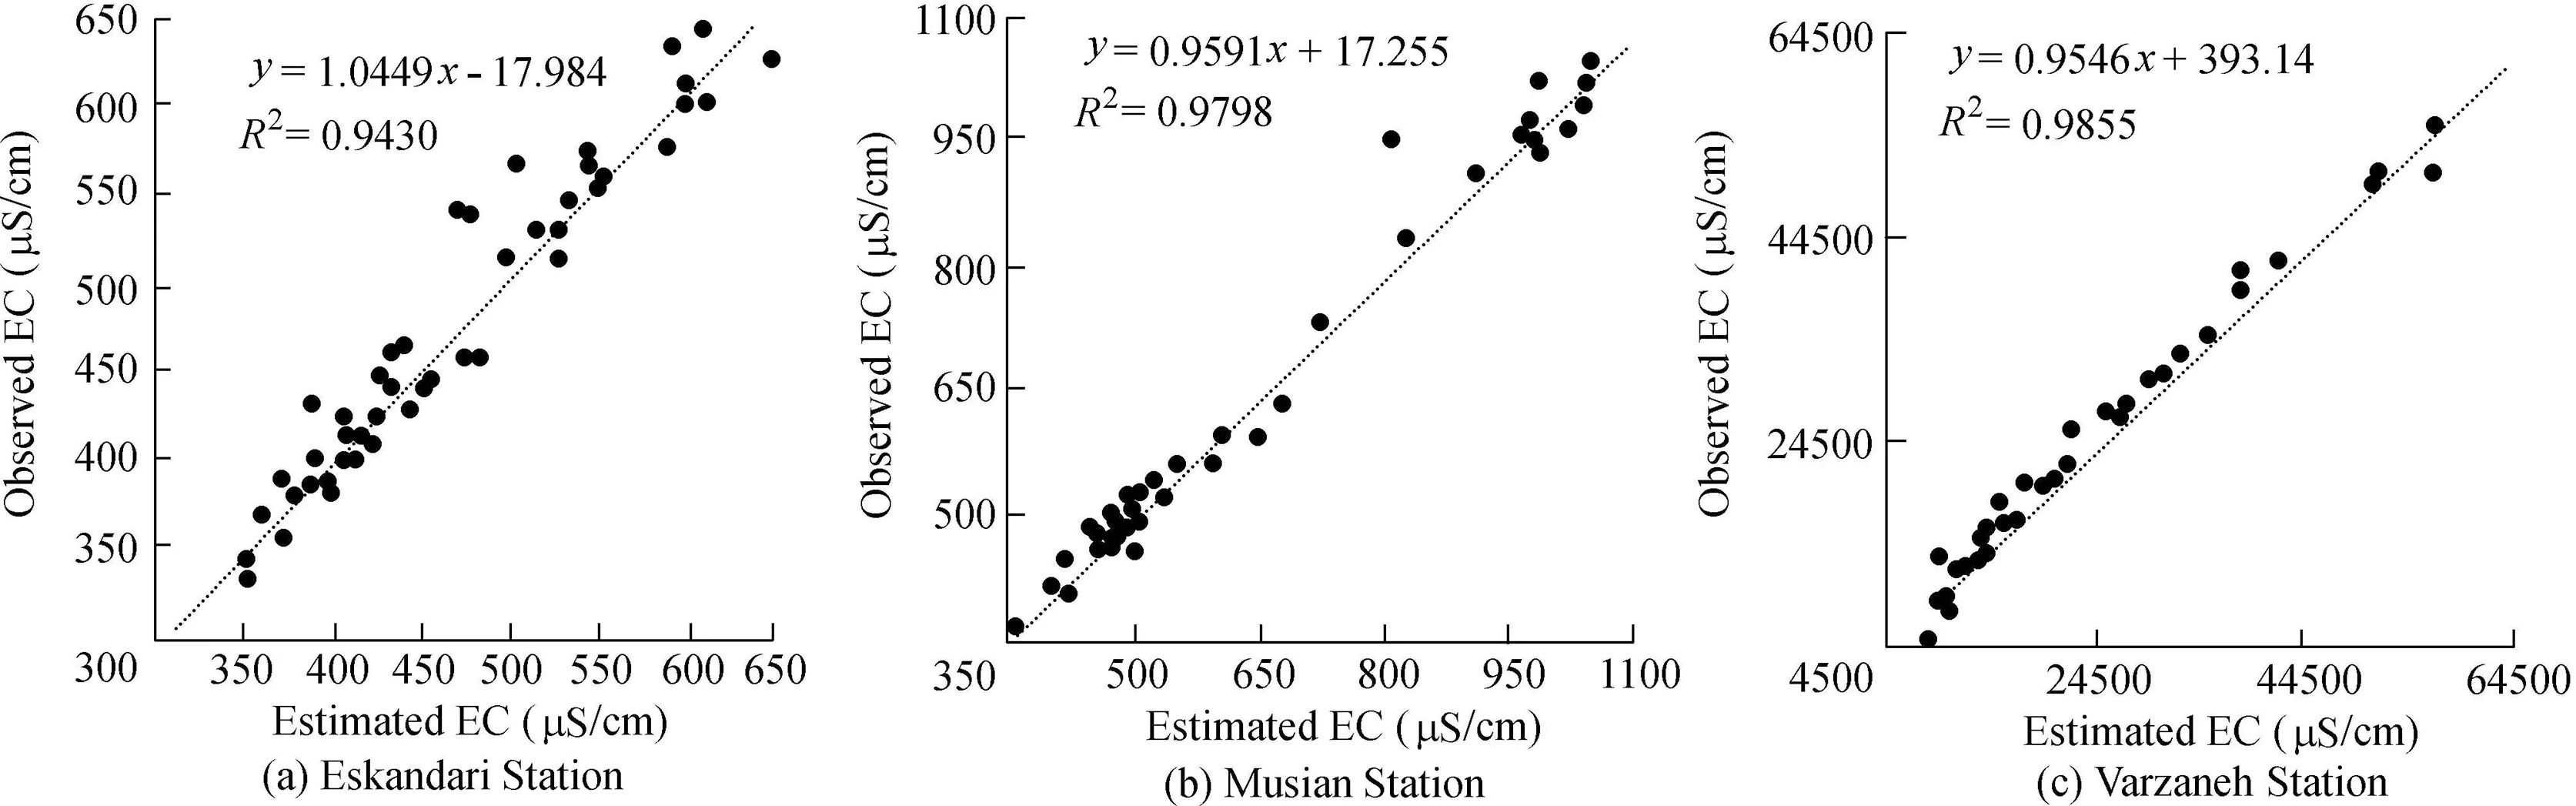
Fig.2.Scatter plots of observed and predicted EC of river water using ANFIS-ACOR model.
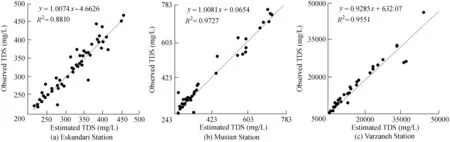
Fig.3.Scatter plots of observed and predicted TDSof river water using ANFIS-PSO model.
3.4.Carbonate hardness(CH)and total hardness(TH)
TH showed an increasing trend along the river similar to EC and TDS.On the other hand,CH was the only parameter that remained relatively constant along the river:1.90 meq/L at Eskandari Station and 1.83 meq/L at Varzaneh Station.Also,the average change of the estimated TH at different stations ranged from 2.30 meq/L at Musian Station to 34.01 meq/L at Varzaneh Station.The correlation coeff icients(Table 5)showed that,at Eskandari Station and Musian Station,had the strongest effect on CH,whilehad the weakest effect.Likewise,EC had the strongest effect on TH,while pH had the weakest effect.
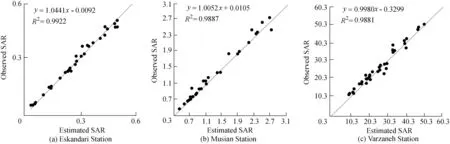
Fig.4.Scatter plots of observed and predicted SAR of river water using ANFIS-PSO model.
Table 7 reports the performance indices of the applied models in predicting both CH and TH.ANFIS and its two improved models performed poorly in the estimation of TH when compared to other parameters.This could be because of the performance of classic and hybrid models with regard to different inputs and structures.In this case,as in the previous one,because inputs,except HCO-3for CH and ECfor TH,did not show very good linear regression with the outputs,TH and CH(Tables 2-5),the models did not perform well.As described,it was expected that the modif ied models would show better results.
At Eskandari Station,ANFIS-ACORproduced the most accurate prediction for both CH and TH parameters when the performances of different models were compared.ANFIS-ACORranked better compared to ANFIS-PSO in the prediction of CH because of more favorable indicators,in spite of higher RMSE(RMSE values are 0.11 and 0.07 for ANFIS-ACORand ANFIS,respectively).ANFIS-ACORproduced more accurate predictions at Musian Station compared to other models.Prediction of CH at Varzaneh Station was similar to that at other stations.However,ANFISwas judged to be the best model for the prediction of TH(R2=0.99,RMSE=0.41,and MAPE=1.75).ANFISACORranked second(R2=0.99,RMSE=0.72,and MAPE=2.69)and ANFIS-PSO ranked third(R2=0.98,RMSE=0.76,and MAPE=2.80).
4.Conclusions
The analysis carried out in this study showed that SAR and CH were the two parameters with the most accurate estimation at the three stations for different water quality conditions along the Zayandehrood River,in Iran.The estimations of EC were relatively satisfactory in most of the cases,except at Eskandari Station in the testing phase,which provided poor results.TDS estimates were similar to EC estimates.The poorest estimates belonged to TH.The correlation coeff icients indicated that the best input elements for EC,SAR,TDS,CH,and TH estimates were Cl-,Na+,HCO-3,and EC,respectively.For most of the parameters,the suggested hybrid models provided appropriate results and were able to improve the performance of classic models such that at Eskandari Station ACO improved R2,RMSE,and MAPE of EC from 0.53,5.53,and 8.82 to 0.94,3.70,and 3.58,respectively,as well as enhancing R2,RMSE,and MAPE of TH from 0.57,0.37,and 8.23 to 0.92,0.26,and 3.82,respectively.Comparison of the results obtained from improved algorithmsshowed that PSOgenerally provided more satisfactory results during the training stage and ACORprovided more satisfactory results during the testing stage.The overall results of the analysis revealed that evolutionary algorithmsimproved theperformanceof ANFISin predicting water quality parameters of the Zayandehrood River.
Some research could be carried out on several topics,including(1)using modif ied algorithms to improve other kindsof soft computing modelsthat suffer similar weaknesses;(2)using the proposed hybrid models to estimate other water quality parameters such as DO,BOD,and nitrate;and(3)comparing these modif ied hybrid models with other physical and artif icial intelligence models.

Table 7Performance indices for CH and TH.
 Water Science and Engineering2019年1期
- Water Science and Engineering的其它文章
- Application of power law to vertical distribution of longshore currents
- Computational investigation of hydraulic performance variation with geometry in gabion stepped spillways
- Treatment of hydroxyquinone-containing wastewater using precipitation method with barium salt
- Evaluation of copper removal eff iciency using water treatment sludge
- Biosorption of Ni(II)ions from aqueous solution using modif ied Aloe barbadensis Miller leaf powder
- Modeling water resources under competing demands for sustainable development:A case study of Kaligandaki Gorge Hydropower Projectin Nepal