
Modeling water resources under competing demands for sustainable development:A case study of Kaligandaki Gorge Hydropower Projectin Nepal
2019-05-18 07:35:48RakeshSahukhalTriRatnaBajracharya
Water Science and Engineering 2019年1期
Rakesh Sahukhal *,Tri Ratna Bajracharya
a Energy,Environment Research and Development Centre,Lalitpur 44602,Nepal
b Institute of Engineering,Department of Mechanical Engineering,Tribhuwan University,Lalitpur 44600,Nepal
Received 17 March 2018;accepted 28 November 2018
Available online 21 March 2019
Abstract The challenges posed by climate change require that the quantity and quality of water resources in Nepal be managed with sustainable development practices.The communities around the Kaligandaki Gorge Hydropower Project in the Myagdi District of Nepal depend on river f low for most of their rural and agricultural needs.Without a sustainable development plan,thegrowing population of the region,conf ined in an area with declining water resources,will face serious challenges to economic growth.Meteorological data show increasing annual average rainfall at a slight rate of about 0.284 mm/year,with erratic annual percentage change in rainfall in the area.The mean and minimum temperatures show decreasing trends at therates of 0.05°Cand 0.14°Cper year,respectively.An assessment of the impactson water availability for domestic and irrigation usage in the face of competing demands caused by the hydropower development project in the Kaligandaki Gorge was undertaken.The water demand and supply modeling were conducted using the water evaluation and planning(WEAP)model,based on dischargedatafrom the Kaligandaki River,which were obtained from the Department of Hydrology and Meteorology,Nepal.Theavailabledata from 2001 to 2003 were used to estimate the model parameters while the stability of these parameters was tested with a validation period from 2004 to 2007.The performance of the model was assessed through statistical measures of calibration with the root mean square error and coeff icient of determination,whosevalueswere0.046%and 0.79,respectively.Two scenarioswerecreated in addition to thebasecasescenario:the discharge decrement scenario and new irrigation technology scenario.Analysis showed that a prioritization of demands will be necessary in the area in the near future for the purpose of sustainability of water resources,due to climate change impacts.
Keywords:Climate change;Competing demands;Sustainable development;Hydropower project;WEAP
1.Introduction
There is considerable evidence that climate change is already affecting Southeast Asia (Christensen and Lettenmaier,2007).Scientists from the Intergovernmental Panel on Climate Change(IPCC)report an increasing trend in mean surface air temperature in Southeast Asia over the past several decades,with an increase of 0.1°C-0.3°C per decade recorded between 1951 and 2000(ADB,2009).Rainfall has been trending downward,heavy precipitation events have risen signif icantly from 1900 to 2005,and the number of tropical cyclones has grown higher from 1990 to 2003(Christensen and Lettenmaier,2007).Climate change is exacerbating water shortages in many areas,constraining agricultural production and threatening food security.Finding suff icient supplies of water has become a major challenge(Sophocleous,2000).The demand for and the supply of water for irrigation will be inf luenced not only by changing potential and actual evaporation,as well as runoff at the watershed and river basin scales,but also by a concomitant increase in futurecompetition for water with non-agricultural users,due to population and economic growth(Rosenzweig et al.,2004).High mountain water resource systems are particularly sensitive to climate change(Schaef liet al.,2007).
There are three major river systems in Nepal.The Kaligandaki River forms a large portion of the Gandaki river system.The Kaligandaki River source is located at the Nhubine Himal Glacier in the Mustang region of Nepal,at an elevation of 6268 m.The Kaligandaki Gorge represents a typical run-of-river type system,like most other hydropower projects in Nepal.The proposed hydropower project component lies on the left bank,with the Mustang and Myagdi districts covering its head works and a certain length of tunnel alignment in Lete and Kunjo rural municipalities,in the Mustang District.The surge shaft,penstock alignment,and power house areas are to be located in Gadpar and Gharap in Narchyang Rural Municipality,in the Myagdi District.The zone of impact from the Kaligandaki Gorge Hydropower Project includes four rural municipalities,Lete and Kunjo in the Mustang District,and Dana and Narchyang in the Myagdi District.
Hydropower represents Nepal's most essential water-based infrastructure.Hydropower development clashes with other competing water uses like agriculture and industrial demands for urban and rural development.Proper planning needs to be done to ensure that demand is met and supply is suff icient without stressing the already susceptible resources.
The Kaligandaki Gorge Hydropower Project is a typical peaking run-of-river(PRoR)project and provides ample opportunity to study the impact of changing climatic parameters on water variability for the project and other basic water demands of communities around the area.Climate projections show that potential change in precipitation and temperature brought about by climate change could affect runoff.The International Center for Integrated Mountain Development(ICIMOD)has studied the impact of projected climate change on the hydrological regime of some river basins in the Himalayan region and shown a clear difference between the basins dominated by the summer monsoon and those dominated by winter precipitation.This in turn affects the potential water utilization and the benef its of hydropower development or of continuing to operate a hydropower plant.This paper quantif ies the implications for agricultural and domestic water demands of the rural municipalities in the project area caused by development of the Kaligandaki Gorge Hydropower Project,under the condition that water requirements of hydropower are met throughout(Pathak,2010).Industrial demands werenot analyzed,asthe region hasnegligibledemandsin this sector.
The main objective of this research project was to assess and recommend measures to control the impacts of climate change on water resources with competing water uses in the Kaligandaki Gorge Hydropower Project area in Nepal.The specif ic objectives included the following:
(1)Conducting a trend analysis of climatic parameters(temperature,precipitation,and discharge)in order to assess the effects of climate on water availability.
(2)Addressing water management challenges and developing a scenario for proper allocation of resources at the installation siteof the Kaligandaki Gorge Hydropower Project.
2.Methodology
2.1.Climate data analysis
Daily rainfall data from three nearby stations(Jomsom,Lete,and Ranipauwa)from 1985 to 2014 were used for analysis during the study.Secondary data regarding the rainfall were taken from the Department of Hydrology and Metrology(DHM)in Kathmandu,Nepal.The optimum number of stations required for the study was based on statistical principles holding that a certain number of rain gauge stations are necessary to give average rainfall within a certain percentage error.The optimum number of rain gauge stations(N)was obtained with the following equation(Campozao et al.,2014):
where E is the allowable percentage error in the estimate of basic mean rainfall,and Cvis the coeff icient of variation of rainfall based on the existing rain gauge stations and is determined as follows:

where Pmrepresents the mean annual rainfall and Pm=,where n is the number of existing rain gauge stations and Piis the normal annual rainfall at existing rain gauge stations;andσis the standard deviation,which is given by
The error estimate while using only one rain gauge station would be10%whilethat using four rain gaugestation would be 4%.For the sake of accuracy in various practical purposes,three stationswere used to minimize the error level to only 5%.
For temperature analysis,the maximum,mean,and minimum monthly temperature data recorded by DHM at the Lete Station for thelast 17 yearswere analyzed.Monthly discharge data from the Kaligandaki River were measured at the intake of the hydropower site by Hydro Solutions Private Limited for the period from 2001 to 2007.These data were used for modeling and analysispurposes using thewater evaluation and planning(WEAP)model.
2.2.Modeling framework and input
The WEAP model is a data-driven system that is customized to a specif ic river basin through agraphical user interface.Its usage has been growing in multi-disciplinary settings that require effective integrated water resource management(IWRM)models to clarify complex issues that can arise.Effective IWRM models address two distinct systems that shape the water management landscape.Factors related to the bio-physical system,namely climate,topography,land cover,surface water hydrology,water quality,and ecosystems shape the availability of water and its movement through a watershed.Factors related to the socioeconomic management system,driven largely by human demand for water,shape the ways available water is stored,allocated,and delivered within or across watershed boundaries(Yates et al.,2005).
The WEAP model offers a choice of three methods to simulate basin hydrological processes,namely an irrigation demand-only method,a rainfall-runoff method,and a soil moisture method(SEI,2005).The rainfall-runoff method adopted in this study is similar to the irrigation demand-only method,in that it determines evapotranspiration for irrigated and rain-fed crops using crop coeff icients,as in the irrigation demand-only method.The remainder of rainfall not consumed by evapotranspiration is simulated as runoff to a river.
Monthly discharge data from 2001 to 2007 at the intake site of the Kaligandaki Gorge Hydropower Project were used to calibrate and validate the WEAP model.The baseline hydrological data as well as precipitation in and around the Kaligandaki River were obtained from the Department of Hydrology and Meteorology,Nepal,which provided the naturalized streamf low and rainfall estimates used in the WEAP model.Naturalized streamf low data were used as the main hydrological input.Rainfall data were used to estimate net evaporation from reservoirs,groundwater recharge,and inter-annual variation in irrigation demand.Net evaporation from the reservoirs(the difference between monthly evaporation and precipitation)was computed from rainfall and estimates of potential open water evaporation data.
2.3.Discharge calibration
For calibration,f low data from 2001 to 2003 were used to estimate the model parameters while the stability of these parameters was tested with a validation period from 2004 to 2007(Fig.1).After modeling inputsweremadeunder thebase casescenario and calibration,water demand and supply for 20 yearswere simulated in WEAP.Calibration involved changing assumptions about the pattern of historic demand,altering demand priorities,and considering environmental f low requirements,in order to improve the f it between simulated and observed discharge.Theeff iciency resultsfor model validation are provided in Table 1.WEAP optimizes water allocation,based on a-priori def inition of priorities.The only objective function used in the calibration was percentage error in the average annual f low.Otherwise,only subjective criteria were used:specif ically,visual comparison of the simulated and observed time series and mean monthly f lows.Through observation of the demand forecasts,other scenarios were set up for further analysis of the water situation in the research area.
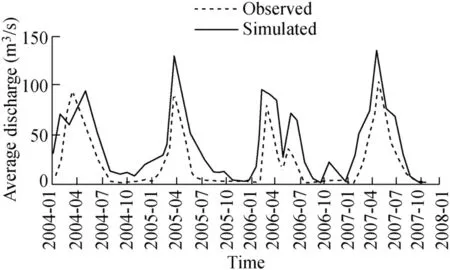
Fig.1.Validation of discharge data in WEAP(2004-2007).
The analysis showed that the values of RMSE and R2were 0.046%and 0.79 for discharge,respectively,i.e.,the calibration shows a good f it to the trend of observed discharge over the validation period.However,there are some differences in the observed and simulated values.The reason for these deviations might be errors in the amount and distribution of precipitation over the watershed or errors due to other factors that the model did not account for.
In the A2 and B2 scenario modeling of Dokan Lake,Pilesjo and Al-Juboori(2016)found a decrease in inf low and outf low of the lake during the period from 2002 to 2012,with a decrease in average annual rainfall.A lot of simplif ications were made with only the mean discharge f low used as a factor inf luencing hydropower generation.However,in our research,the site head,maximum turbine f low,plant factor,and generation capacity of the turbine were considered as well.
2.4.Scenarios
The base case or reference scenario was set as 2007,the f inal year for which f low data were available.Demands were projected for rural use by multiplying the population by the per capita use rate.The population was projected up to the year 2027 using an annual growth rate of 1.22%(Lemma and Velde,2017).Thus,therural demand increased throughout the analysis period while the area of agricultural land and the types of crops were assumed to stay the same during the base case scenario.Discharge data taken at the intake were entered under the river head f low in a monthly time series for the base year 2007.
The discharge decrement scenario was developed to approximate the A1 scenario of the Intergovernmental Panel on Climate Change's report for policymakers(IPCC,2000),which describes a future of very rapid economic and population growth that peaks in the 2050s.In our case,the discharge decrement scenario modeled the changes in demand coverage due to a decrease in river discharge in the future.Under the discharge decrement scenario,the population growth factor has been set as 1.5%which resulted in subsequent growth in domestic demand.Theagricultural water demand isincreasing aswell due to the increment of irrigation demand by 5%every f ive years.

Table 1Eff iciency results for model validation.
The new irrigation technology scenario was modeled after the B2 scenario of the IPCC's summary report for policymakers,which describes local solutions for economic,social,and environmental sustainability.This scenario was modeled based on the discharge decrement scenario by improving irrigation eff iciency from 50%to 80%to simulate eff iciencies that can be attained by sprinkler and drip irrigation methods.The irrigation water requirement was set as increasing at rates of 5%every f ive years,assuming increasing needs of food supply and due to rapid population growth rate,which was also set at 1.5%.
The baseline information of the project site used for setting up the WEAPmodel was obtained through a literature survey(Table 2).The annual per capita water use of Nepal is 890 m3.Of this,3.43% is attributed to annual domestic usage(30.53 m3per capita)while the rest is attributed to irrigation usage(854.40 m3per capita)(CBS,2001).Key assumptions were added during modeling to replicate the monthly domestic and irrigation usage variations.The coeff icients of domestic variation for different monthswere 0.90 for January,February,and December;1.00 for March,April,May,September,and October;1.10 for June;and 1.15 for July and August.The coeff icients of monthly irrigation variation were 2 for January and February;5 for March,April,and May;10 for June;15 for July;20 for August;25 for September;4 for October and November;and 3 for December.These coeff icients were decided from team discussion and through analysis of the farming months of the different crops cultivated in the area.
The domestic needs in the area include water demands for household purposes and animal husbandry.The animals regularly farmed or herded are buffaloes,pigs,goats,and sheep.Regular crops grown in the area include maize,wheat,and potatoes.The farming times for the crops are provided in Table 3.These basic crops are not so water-intensive compared to other crops grown in the area such as chilies,onions,garlic,pumpkin,squashes,and salad crops.The most water-intensive crops grown in the area include rice,citrus fruits,especially oranges,apples,pears,and mangoes.
3.Results and discussion
3.1.Climate trend analysis
Nepal receives nearly 80%of its annual precipitation during the months of June to September in most locations(NCVST,2009).Distribution of rainfall around the Kaligandaki Gorge Hydropower Project area is not uniform either.Elevation as well as topography of mountains within the area play major rolesin the uneven rainfall distribution(Kumar and Santosh,2015).The 30 years of daily data available(1985-2014)for the area near the project site show that 62%of rainfall occursduring monsoons,with 25%in pre-monsoon period followed by 8%and 5%in post-monsoon periods and in the winter,respectively.
In a PRoR project like the Kaligandaki Gorge Hydropower Project,electricity generation will vary along with precipitation patterns,which means dry seasons may require a substitute source in order for the demands to be met.In a reservoirbased hydropower station like that in Kulekhani,on the other hand,usage of water accumulated during monsoon allows for electricity generation throughout the year.
Asillustrated in Fig.2,precipitation around the project area peaks from June to August and is highest during July.Winter months beginning from November and ending in January receive the lowest amount of precipitation.
The monsoon normally starts in the second week of June and continues until the fourth week of September.The monsoon is the main source of rainfall at the project site,as in other regions of Nepal.The large amount of rainfall within a short period causes f lash f loods,landslides,soil erosion,and sedimentation in hilly and mountainous regions,and inundation of the plain areas(Bajracharya et al.,2011).
There is no signif icant change in annual precipitation in Nepal(APN,2007).This study shows that the annual average rainfall around the Kaligandaki project site is increasing at a slight rate of about 0.2846 mm/year measured at the Lete Station(Fig.3).The rainfall and corresponding years are represented by the y-and x-intercepts of the trendline produced from available annual average rainfall data.This conforms with the slight increase in the precipitation rate as seen in the study based on data from the Andhi Ghat Station,in the Mustang District(Bajracharya et al.,2011).
Annual temperatures in Nepal are reported to be increasing and the impacts of warming have already been observed in the Himalayan glaciers.The average annual temperature in Nepal is increasing steadily with a current annual rate of 0.06°C(Karki et al.,2009).Temperature data measured at the Lete Station(from 1998 to 2014)show decreasing minimum and mean annual temperatures(Fig.4).The maximum temperature is increasing,albeit very slightly.

Table 2Baseline information for WEAPmodeling.

Table 3Crop calendar.
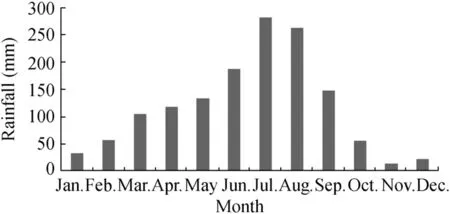
Fig.2.Monthly rainfall distribution at Lete Station.
3.2.Modeling results
Following calibration of available discharge data,f low data were modeled for 20 years up to the year 2027 based on parameters in the base case scenario.The discharge of the Kaligandaki Gorge shows a decreasing trend,which is particularly noticeable following the year 2014.In 2027,discharge during the peak monsoon month,i.e.,August,is only 84.3 m3/s,compared to 133.3 m3/s during the base case year(Fig.5).This can be attributed to the reduction in glacier melt and the decreasing precipitation trend.Such reduction could have a signif icant impact on the generation of a power plant.
In their modeling of Dokan Lake in Iraq,Pilesjo and Al-Juboori(2016)found that,by the year 2050,hydropower generation would decrease by 5%-10%in total due to runoff changes,which would have negative effects on the energy sector and the future production of electricity in Iraq.Reduction by 5%-10%means a substantial decrease of electric power generation in the Dokan Power Plant by 20-40 MW.
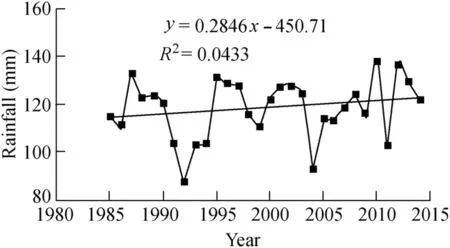
Fig.3.Annual average rainfall at Lete Station.
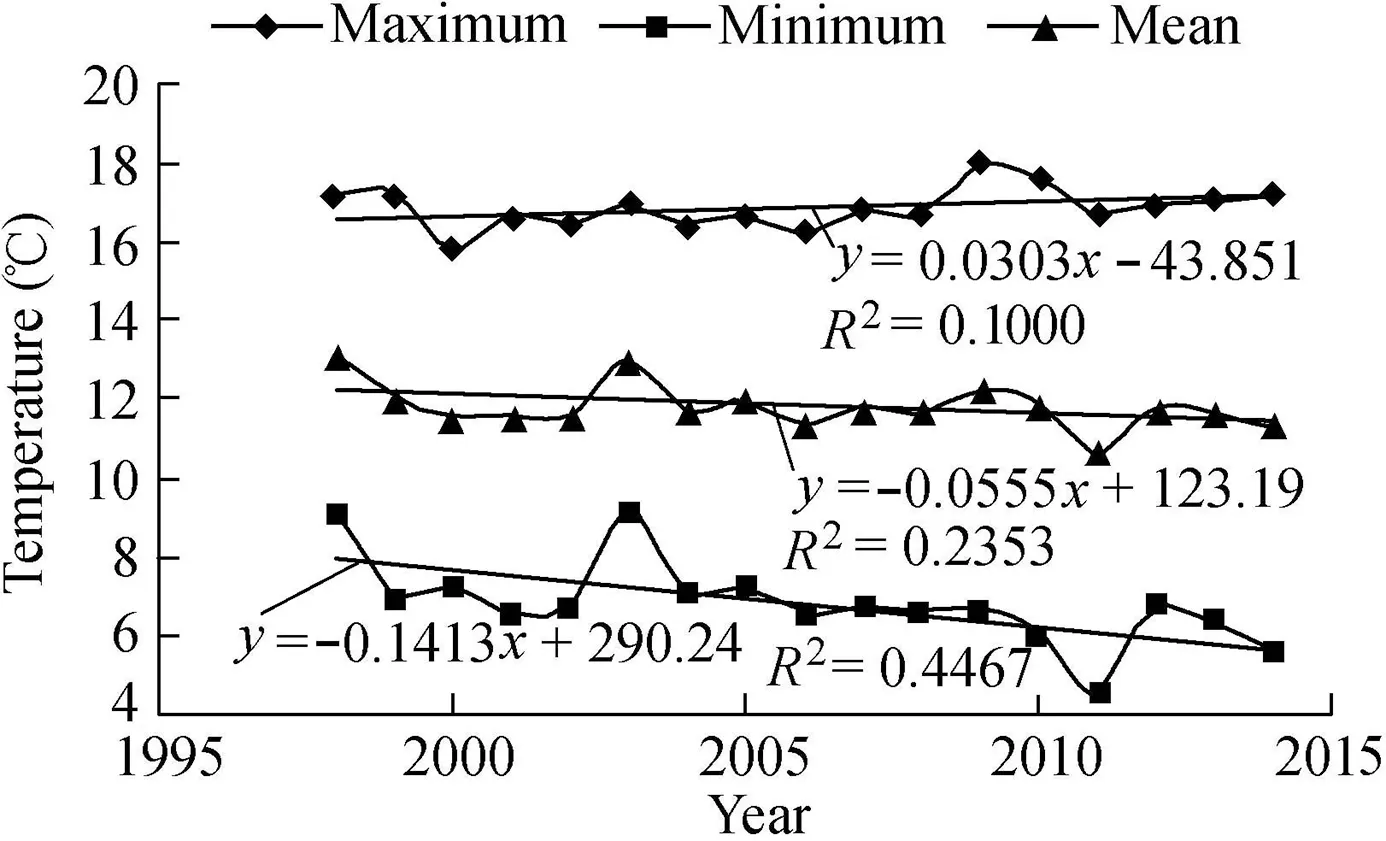
Fig.4.Maximum,mean,and minimum temperatures at Lete Station.
In our model the total water demand for the base case scenario for 2007 is 400×103m3.Agriculture is the most water-intensive demand since it alone requires more than 250×103m3,the other types of demands being for domestic uses in the four rural municipalities.Water demand from the base case to f inal year 2027 will rise due to the population growth(1.22%).The f inal year's water demand is more than 456×103m3.The agricultural demand at this point is over 265×103m3.Under the current base case scenario,the demand coverage for both domestic and irrigation needs were met at 100%.
In terms of demand coverage in the discharge decrement scenario,agriculture faces a shortfall in supply from the year 2019 during the months of September and October,when water-intensive crops are planted.In terms of supply preferencedomestic demand hasbeen assigned ahigher priority of 1 and agriculture is prioritized next with priority set as 2.Thus,in case of a water shortage,agriculture is less prioritized than domestic demand.Thus,agriculture falls short of supply by about 15%for the month of August in the year 2027,even though the domestic demands are being met.
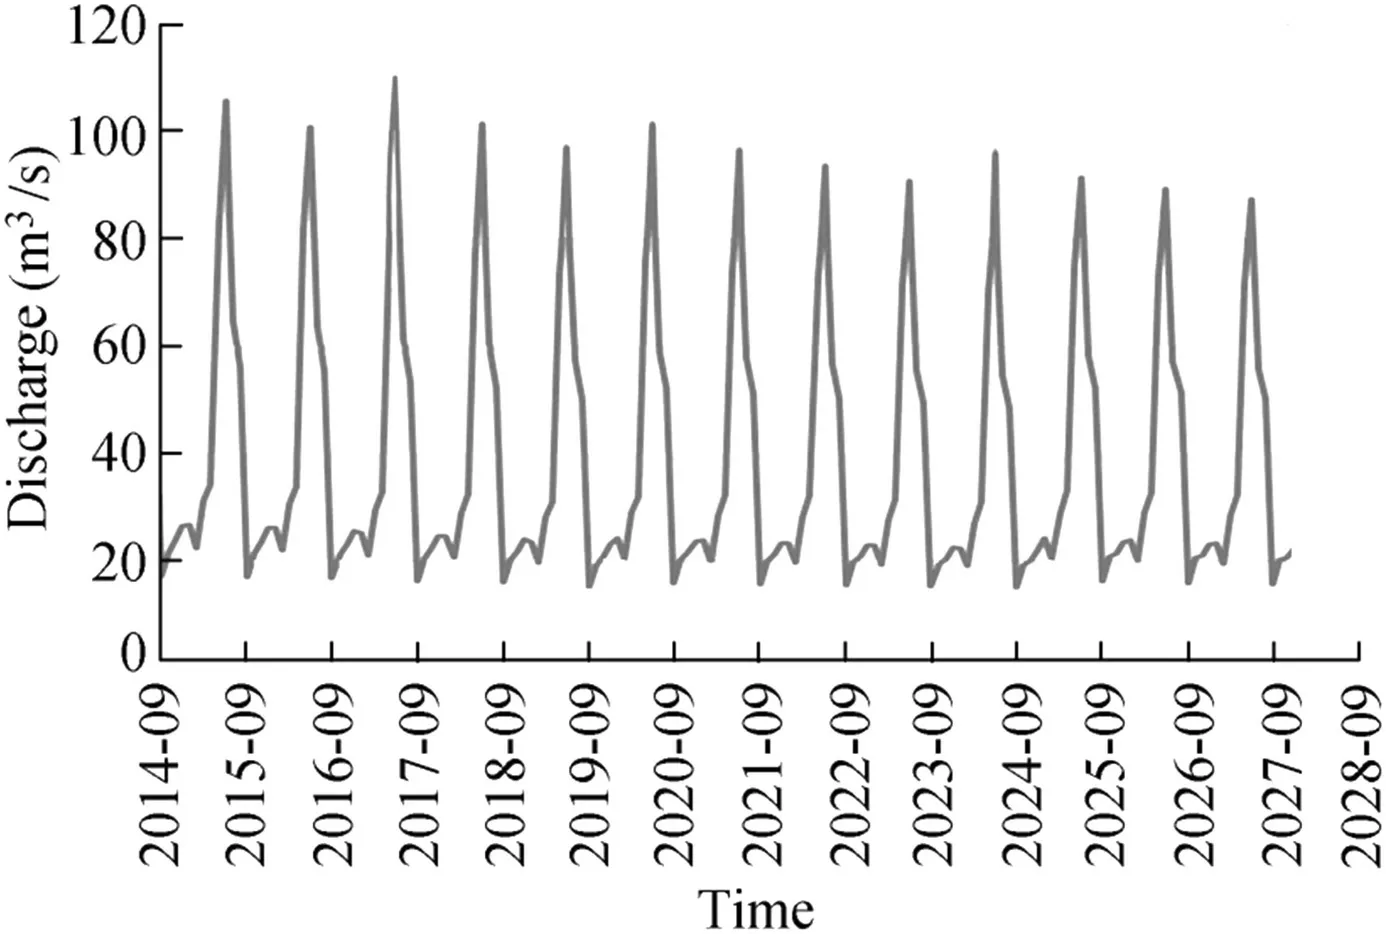
Fig.5.Discharge projection up to 2027.
The total agricultural demand for the region under the discharge decrement scenario for the year 2027 is over 664×103m3.The15%def icit in demand coverage just before August translates to a def icit of around 8×10³m3,as can be inferred from Fig.6.Most of the water-intensive crops are grown during the months of July to October in the area,which results in more water use during these months.

Fig.6.Total unmet demand in discharge decrement scenario.
The analysis of potential climate change scenarios has demonstrated the possibility of lessstreamf low being available to meet increasing demand.The simulations show that the projected demands are not being met and the shortages can be large.The range of unmet demands is limited due to lower inf lows and higher demands.In order to prevent large failures in the water resources system,decision makers and water managers will need to change their current water management practices in order to mitigate the negative effects of having less available water.In this study a single new irrigation technology scenario was used(Fig.7).
The new irrigation technology scenario sees an increase in previousirrigation eff iciency of 50%-80%.Such atechnology may be either sprinkler or deep-root drip irrigation technology.In comparison to the discharge decrement scenario,the agricultural demand decreasesin thisnew scenario,assuming such is the impact of new smart irrigation practices.The annual irrigation demand for the base case scenario for 2007 is the same as in the scenario described above:250×103m3.The f inal year's demand is about 478×103m3,which is a radical drop from the discharge decrement scenario demand of 664×103m3.

Fig.7.Unmet demand comparison in different scenarios.

Fig.8.Agricultural water demands in different scenarios.
In the discharge decrement scenario,total unmet demand for theyear 2027 is4%of the total agricultural demand.Of the 17×103m3of unmet demand,8×103m3is for the month of August alone.In the new irrigation technology scenario,the def icit for August 2027 isreduced to just over 2×10³m3.The def icits are not completely negated as the population growth for the scenario(1.5%)is more than the current growth rate of 1.35%and the increment of agriculture is 5%per year.On top of that the model predicts a decrease of discharge as well.
Under the discharge decrement scenario,the 5%increment in agricultural demand means the water demand has an increasing trend.The projected water demand for the year 2027 is 664×103m3,which is signif icantly greater than the 265×103m3water demand seen in the base case scenario(Fig.8).
Introduction of a new irrigation technology that improves the overall irrigation eff iciency from 50%to 80%comes into practice,in our model,in 2017.There is a general decrement in annual irrigation demands from there on.The annual irrigation water demand for theyear 2027 is 478×103m3,which is signif icantly lower than the demand in the discharge decrement scenario.
In the new irrigation technology scenario,the annual unmet demand for the year 2027 is 17×103m3,which is signif icantly lower than the unmet demand of 29×103m3in the discharge decrement scenario(Fig.9).The results of the simulation for the new irrigation technology scenario indicate that improving irrigation eff iciency leads to lower values of unmet demand,indicating a reduction in water stress in the agricultural sector.It should be noted that this mitigation scenario will last less than 5 years(under the best case for implementation)and might be considered to be insignif icant.

Fig.9.Unmet agricultural water demands in different scenarios.
Thef low curveof theanalyzed period showsthat thef low is decreasing and not in onepattern.Forecasting of theyear 2027 shows a sharp decline in discharge,which will have acute repercussions in the water supply for communities’needs,as well as in hydropower generation.Changes in hydrology of riversare seen asa major impact of climatechangeresulting in anomalies in hydro resources,which could be critical to areas of competing water uses.The minimum and mean temperatures of the site show decreasesof 0.05°Cand 0.14°Cper year,respectively,though the maximum temperature is increasing,albeit very slightly(0.001°C per year).There is a general increasing trend in precipitation of about 0.284 mm per year.However,the percentage change in rainfall shows the erratic nature of rainfall or the shift in rainfall seasons,which increases the hydrological impacts and challenges.The WEAP model developed for the research site,taking into consideration the agricultural and domestic demands,showsincreasing demand due to population growth and anthropogenic activities.The total water demand in the reference(base case)scenario for 2027 is 456×103m3,of which the agricultural demand alone accounts for over 266×103m3.In the discharge decrement scenario,this demand increases to 664×103m3,of which therearedef icitsof over 29×103m3.With the new irrigation technology that increases the overall agricultural eff iciency from 50%to 80%,the annual agricultural demand is 478×103m3and the unmet demand is reduced to 17×103m3.Introduction of a new technology has proven eff icient in reducing the overall agricultural demand that would otherwise go signif icantly unmet.However largescale immediate implementation of such technology will be diff icult in practice.
The integrated water strategy has formulated three phases of strategic goals for development of water-related infrastructure in Nepal up to the year 2027.One of the outputs of the strategy isto develop eff icient irrigation for optimal use of irrigable land in Nepal.Projections under this strategy show that by 2027 the irrigation demand for Nepal will grow by 185%from 13×106m3in 2002 to 37×106m3(Thapa,2007).In the new irrigation technology scenario,the annual irrigation demand of 250×103m3hasrisen to 478×103m3,which is a growth of around 91.2%.
In a similar study for the Mekong River Basin,Beilfussand Triet(2014)found that the combined effects of hydropower development and climate change would reduce ecosystem benef its considerably.The rural poor are especially vulnerable to these changes because their livelihoods are more directly dependent upon ecosystem services.The Kaligandaki Gorge Hydropower Project,on the other hand,may not have such an extent of impacts,as it is not a reservoir-based system.
4.Conclusions
Therainfall distribution around the region isuneven and the basin has insuff icient gauging systems.The discharge and rainfall-recording network should be enhanced for more intensive collection of the data most essential for hydrologic models and other types of detailed hydrological study.Due to data limitations,only domestic and agricultural needs of the communities were considered in modeling.These are also the two most important water demanding sectors in the region.Nevertheless,the model shows a potential short-supply situation in the future.Mitigation measures for avoiding such occurrences include adoption of new technologies and prioritization of supply.Changes in the hydrology of the Kaligandaki River mean that improvements in the present hydropower resourcesfor water recycling and/or development of micro dams for storage at the hydropower site are good options for ensuring the supply for hydropower systems as well as meeting the demand of nearby communities.Construction of new plants with better technology(and higher eff iciencies)is another alternative worth considering.Meanwhile,the communitiescould use the water from the reservoir for both their domestic and irrigation needs,which would also ensure the minimum level required for hydropower operation.
The results described in this paper are preliminary and based on many assumptions.In cases where the simulations have been verif ied,the model results are reasonable.Nevertheless,the current results must be treated with caution.In the coming months,the model should be ref ined using improved estimates of streamf low in the major tributaries and better estimates of irrigation demand for all schemes.Future studies of cumulative impacts should focus on the full range of economic and social sectors,with wider spatial coverage to include multiple development projects affecting the system.
 Water Science and Engineering2019年1期
- Water Science and Engineering的其它文章
- Application of power law to vertical distribution of longshore currents
- Computational investigation of hydraulic performance variation with geometry in gabion stepped spillways
- Treatment of hydroxyquinone-containing wastewater using precipitation method with barium salt
- Modeling river water quality parameters using modif ied adaptive neuro fuzzy inference system
- Evaluation of copper removal eff iciency using water treatment sludge
- Biosorption of Ni(II)ions from aqueous solution using modif ied Aloe barbadensis Miller leaf powder