
On-site stormwater detention for Australian development projects:Does it meet frequent f low management objectives?
2019-05-18 07:35:30RodneyRonldsAlexRowlndsHongZhng
Water Science and Engineering 2019年1期
Rodney Ronlds *,Alex Rowlnds ,Hong Zhng
a School of Engineering and Built Environment,Griff ith University,Gold Coast 4216,Australia
b Michael Bale&Associates Pty Ltd.,Gold Coast 4216,Australia Received 21 June 2018;accepted 24 December 2018
Available online 1 April 2019
AbstractOn-site stormwater detention(OSD)is a conventional component of urban drainage systems,designed with the intention of mitigating the increase to peak discharge of stormwater runoff that inevitably results from urbanization.In Australia,singular temporal patterns for design stormshavegoverned theinputs of hydrograph generation and in turn the design processof OSD for thelast threedecades.Thispaper raisesthe concern that many existing OSD systems designed using the singular temporal pattern for design storms may not be achieving their stated objectives when they are assessed against a variety of alternative temporal patterns.The performance of twenty real OSD systems was investigated using two methods:(1)ensemblesof design temporal patternsprescribed in thelatest version of Australian Rainfall and Runoff,and(2)real recorded rainfall data taken from pluviograph stations modeled with continuous simulation.It is shown conclusively that the use of singular temporal patterns is ineffective in providing assurance that an OSD will mitigate the increase to peak discharge for all possible storm events.Ensemble analysis is shown to provide improved results.However,it also falls short of providing any guarantee in the face of naturally occurring rainfall.
Keywords:Stormwater detention;Frequent f low management;Temporal patterns;Runoff routing;Continuous simulation;South East Queensland
1.Introduction
1.1.Stormwater detention in Australian catchments
Australia is a country known for extreme weather conditions,including high-intensity rainfall and f lash f looding.Due to lifestyle,economic,and logistic factors,Australia is experiencing signif icant and planned urbanization recently in the coastal or riverine areas that are subject to a high risk of f lood inundation.This presents a concern for engineers and planners,as development within and surrounding the f loodplain has the known potential to result in changes to f lood behavior,including f low path locations,f low rates,velocities,f lood levels,f lood extents,channel erosion,and duration of f looding(Poff et al.,1997).
There have been several attempts by researchers and authorities to mitigate the impact that urbanization can have on catchment hydrology.Effectively reducing theimperviousness of a developed catchment has been promoted as one of the potential solutions(Booth and Jackson,1997;Horner at al.,1999;Hatt et al.,2004;Taylor,2005;Walsh et al.,2005).However,reducing the imperviousness in high-density urban development to a degree to achieve regional hydrologic neutrality is not always considered to be a feasible and effective solution.The concept of stormwater volume control has prevailed as one of the preferred means to control the effect of urbanization on catchments and downstream regions associated with urban development(Phillips,1987;Phillips et al.,2016).
One of the most common forms of stormwater volume management adopted in engineering practice is on-site stormwater detention(OSD),which involves the use of tanks or basins at a development-site scale.These systems are designed using hydrograph theory to delay and reduce the peak discharge of a development site to a desired level,typically to match the peak discharge under pre-development conditions.
The use of OSD originated from American studies(Poertner,1976)that were adapted to Australian conditions(Phillips,1987).The f irst time for local governments in Australia to adopt OSD measures was in Sydney in the early 1980s(O'Loughlin et al.,1995).In South East Queensland,OSD is currently required to restrict the peak discharge for 39.35%,18.13%,10%,5%,2%,and 1%annual exceedance probability(AEP)events to pre-development conditions,in order to achieve the performance outcome of“no adverse impacts on stormwater f looding or the drainage of properties external to the subject site”(CGC,2018).
1.2.Peak discharge management objectives for frequent storm events
OSD is used for stormwater volume management to achieve two primary objectives:controlling discharge in frequent storm events and mitigating f lood in rare storm events.Achieving both of these objectives with one OSD system is a challenge and requires the specif ication of a storage volume and outlet conf iguration that are effective for all possible storm events within the range of design event probabilities(Phillips,1995).
This study was focused on frequent f low management objectivesthat require the use of OSD to reduce the discharge of development-site runoff during storm events with a frequent probability of recurrence,between the AEP range of 39.35%and 10%.The theory supporting these objectives relates to the stability of watercourse embankments and the requirement for impervious developments to avoid changes to the frequency,depth,and velocity of runoff(Bledsoe,2002;Shuster et al.,2005;Hawley et al.,2017;Vietz and Hawley,2019).
Increases in peak stormwater discharge are not the only outcome of urbanization that has detrimental effects.Increases in the volume of runoff will also contribute to elongated hydrographs with extended time periods of bankfull f low and increased probability of coincident hydrograph peak in downstream waterways.OSD with peak f low design objectives does not address these issues,which is the reason for recent developments in distributed detention as part of a catchmentwide network(Kaini et al.,2007;Travis and Mays,2008;Ravazzani et al.,2014;Tao et al.,2014;Duan et al.,2016;Bellu et al.,2016;Shuster and Rhea,2013;Su et al.,2010)and research into the phenomenon known as“regional effect”that results from multiple detention systems in series(McCuen,1974;Bennett and Mays,1985;Ferguson and Deak,1994;Saunders,2006;Ronalds and Zhang,2017).This study was limited to peak discharge management objectives for frequent storm events,in accordance with current practice in the case study area.
1.3.An era of over-reliance on determinism
For the last three decades,the development of design event hydrographs in Australia has followed a prescriptive procedure,largely directed by the seminal works of Pilgrim and Canterford(1987)in the guide of Australian Rainfall and Runoff,referred to below as ARR1987.For each storm event,the process has resulted in a deterministic outcome:a singular hydrograph for a certain probability and duration.Following the average variability method(Pilgrim and Cordery,1975),rainfall depth inputs are obtained from intensity-frequencyduration charts and applied to a singular temporal pattern relevant to the duration and probability of the design event to generate a hydrograph.This simplistic approach has been widely criticized for its inability to manage parameter uncertainty or account for the probabilistic nature of key variables except for the rainfall depth(Wood,1976;Rahman et al.,2002;Kuczera et al.,2006;Nathan et al.,2003).
Temporal patterns of rainfall are known to exhibit a wide variability in their observed values,and the use of mean or median values of these variables has shown to be insuff icient to represent real-world hydrograph predictions in modeling(Caballero and Rahman,2014a,2014b).A new trend toward the consideration of multiple temporal patterns for the hydrologic modeling of each design storm event has therefore emerged in recent years.Developed methods include sampling of historic temporal patterns(Loveridge and Rahman,2014)as well as artif icial disaggregation of rainfall totals using multiplicative random cascade models(Mu¨ller and Haberlandt,2018).
In the latest Australian Rainfall and Runoff(Ball et al.,2016),referred to below as ARR2016,a probabilistic array of multiple temporal patterns is recommended,considering either a Monte-Carlo sampling process or an ensemble of ten temporal patterns that are made available to practitioners.Temporal patterns are contained in a national database,including suitable samples of data from real recorded rainfall events throughout Australia that are created using the Bureau of Meteorology's pluviographic data from 2290 pluviograph stations across Australia(Loveridge et al.,2015b).
A serious question has emerged from this evolution:whether we can rely on our OSD systems that have been designed and constructed using deterministic methods to achieve their stated objectives?
2.Case study
2.1.South East Queensland
South East Queensland,Australia,has a temperate subtropical climate with high rainfall intensities and a rainfall pattern that concentrates rainfall in summer months.In this region,urban development is governed by the local city council's development guidelines that broadly mandate OSD for all the development sites.OSD is therefore a key consideration for new developments,requiring the installation of tanks,basins,or other systems capable of holding volumes of stormwater in accordance with site-based engineering design calculations.
Currently,numerical runoff routing methods are recommended to design OSD systems in South East Queensland(IPWEA,2017).Simplif ied alternatives known as deemed-tocomply solutions are also available to designers who wish to avoid numerical methods,albeit the over-simplif ication of these methods presents issues associated with both accuracy and effect(Ronalds and Zhang,2017;Ronalds et al.,2017).
2.2.Example of development sites
Twenty real examples of urban development sites were assessed in thisstudy.The areasof the sitesrange from 405 m2to 4367 m2.Thetimeof concentration of thepeak discharge,tc,and the percentageof theimperviousareaof thesitesin thepreand post-development scenariosare summarized in Table1.All the development sites are located in the South East Queensland region,with OSD systems designed,approved,and constructed using the design principlesof ARR1987.All thesitesconsist of a single catchment contributing to runoff in both pre-and postdevelopment scenarios.
3.Ensemble analysis
3.1.Hydrologic modeling methodology
The Queensland Urban Drainage Manual(IPWEA,2017)gives designers the option to use numerical runoff routing methods to create hydrographs and assess OSD systems.Acceptable alternatives include RAFTS (Aitken,1975),RORB(Laurenson et al.,2010),the watershed bounded network model(WBNM)(Boyd et al.,1993,1996,2012),PCDRAIN(Badini,2018),and DRAINS(O'Loughlin and Stack,2014).DRAINSwasselected for thepresent study,which used the time area method for catchment routing and level pool routing for OSD systems.Recent revisions of DRAINS have also included the ability to assess ensembles of temporal patterns in accordance with ARR2016.
The methodology of ensemble analysis was to revisit the hydrologic modeling of each development sitein Table1 using the ensemble of ten temporal patterns and techniques provided by ARR2016.The hydrograph yielding the peak discharge closest to the median of results of the ensemble was taken as the accepted result in both pre-and post-development scenarios.An OSD system was considered to be successful in achieving its objectives when the peak discharge in the postdevelopment scenario was equal to or less than that in the pre-development scenario.
3.2.Performance of OSD
Inthegraphspresented below,thebaseline(0%deviationline)meansthat theachieved detention outletf low rateof asitein the post-development scenario is equal to the value in the predevelopment scenario.The percentage deviation indicates the extent of failure(negative results)or over-attenuation(positive results),whichwasobtained fromthemodelingof sitesand OSD systemsusing ensemblemethods.Thehorizontal axisrepresents the frequency of the design storm in termsof AEP.
For the ten smaller sites(with an area less than 1400 m2),the results presented in Fig.1 identify a clear pattern in which OSD systems achieve and exceed the stated objectives for rare storm events with lower AEP values.However,they fail to achieve attenuation objectives for frequent storm events with larger AEP values.OSD systems exceed objectives by up to 20%in rarestorm events,but fail in achievement of objectives by up to 20%in frequent storm events according to values of attenuation.
For thetenlarger sites(withanarealarger than 1400 m2),the resultspresented in Fig.2 identify an exaggeration of theresults shownin Fig.1,with OSDsystemsexceedingobjectivesby up to 20%in rare events and failing in achievement of objectives by almost30%infrequenteventsaccordingtovaluesof attenuation.
Figs.1and 2alsoshow aprevalenceof failureinachievement of objectivesfor afrequenteventwiththe AEPvalueof 39.35%,with f ifteen out of twenty development sites unable to achieve the objectives.

Table 1Summary of hydrologic parameters of development sites.
3.3.Correlation between peak discharge and detention objectives
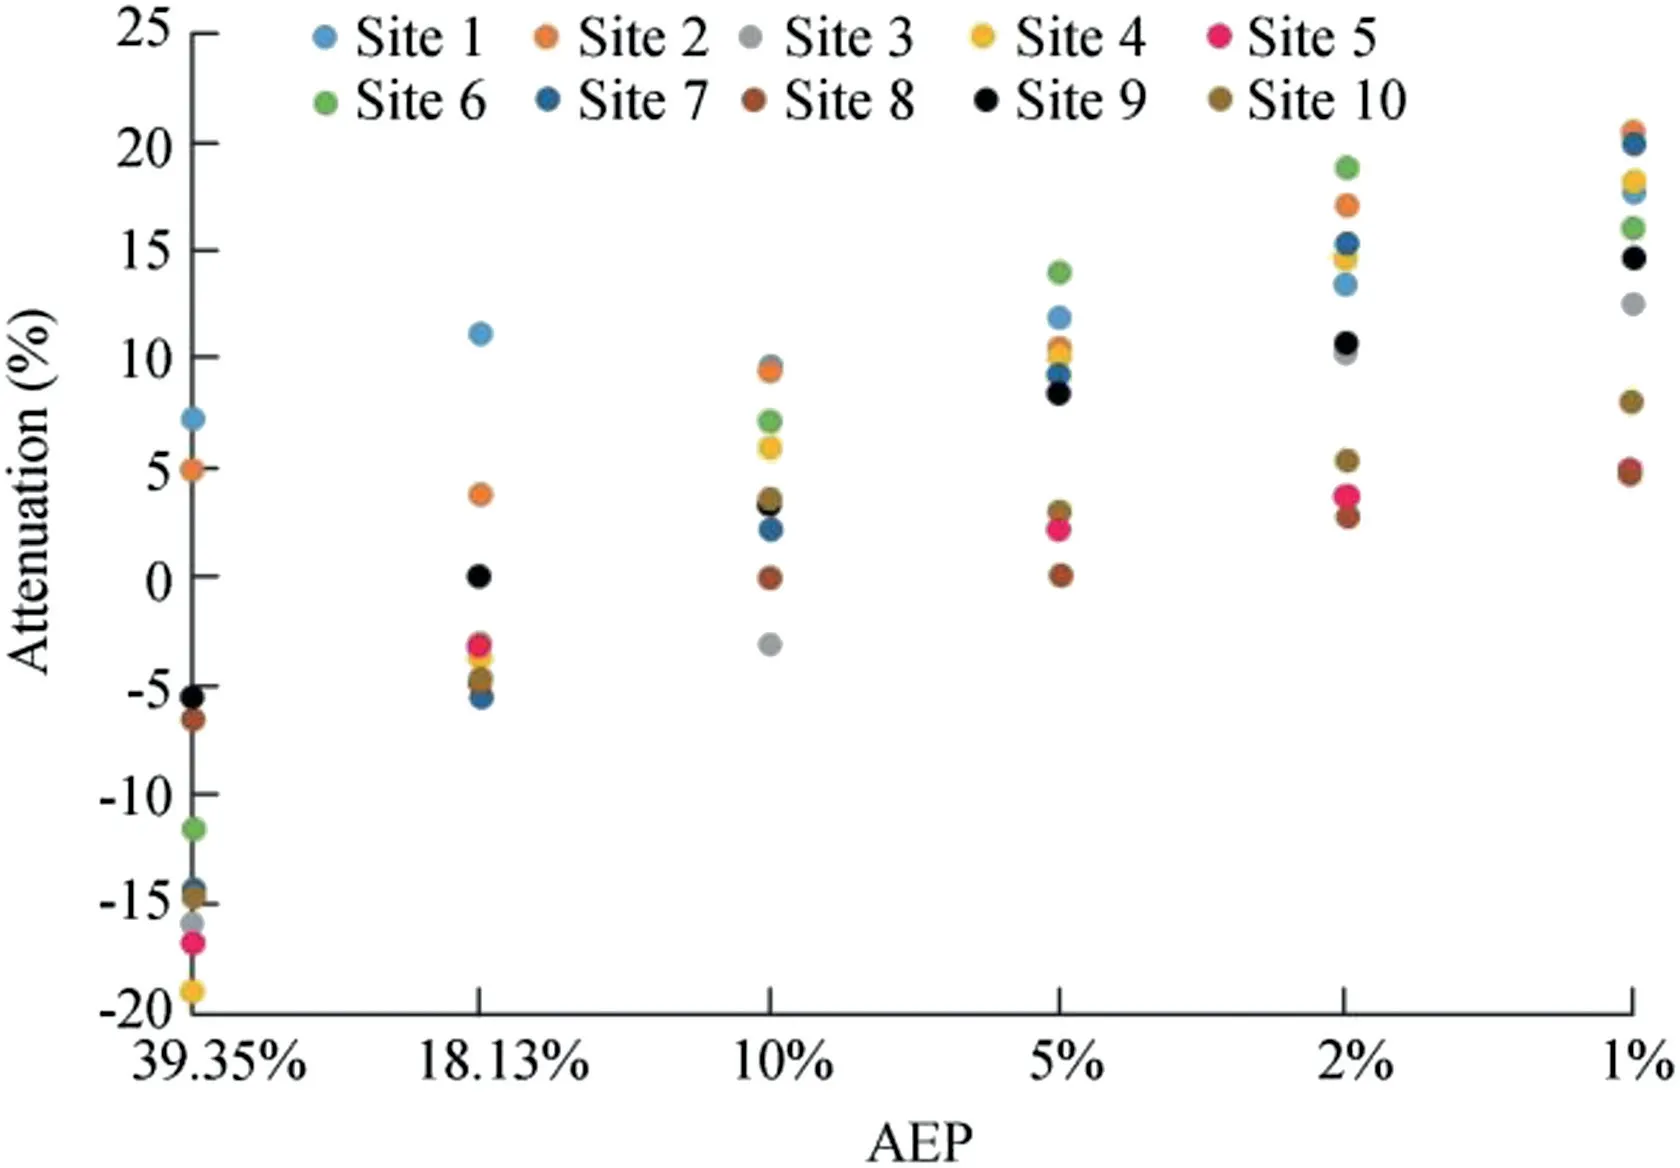
Fig.1.Performance of OSD systems at small sites.
Fig.3 is presented to address the potential for a simple link to be drawn between changes to peak discharge by means of the ARR1987 and ARR2016 methods and the patterns of OSD performance that have been identif ied.The f igure shows the results for different development sites with different AEPvalues,indicating the percentage deviation of the peak discharge calculation by the ARR2016 method(without OSD),in comparison with the result of the ARR1987 method.
It is almost unanimously demonstrated that the ARR2016 method resultsin areductionof peak dischargefor all theevents withdifferent AEPvalues.Thereisnoclear correlationbetween theresultsin Fig.3 and those presented in Figs.1 and 2.
3.4.Ensemble analysis summary
The results of the ensemble analysis indicate a real potential that numerous OSD systems constructed in the South East Queensland region may under-perform in achievement of frequent f low management objectives.In addition,an overachievement of stormwater discharge management objectives in rare storm events could consume excessive construction materials and resources.

Fig.2.Performance of OSD systems at large sites.
Issues of erosion and water quality problems that result from increases in peak discharge in frequent events are presented both globally(McCuen and Moglen,1988)and locally(Walsh et al.,2016).They are considered important issues of concern and a topic worthy of continued investigation.

Fig.3.Differences between ARR1987 and ARR2016 peak discharges for development sites with different AEPvalues.
4.Continuous simulation analysis
This section focuses on the identif ied issues of frequent f low management and assessment of OSD performance using the continuous simulation method with real patterns of recorded rainfall within the probability range of frequent events.The continuous simulation method involves running a conceptual runoff routing model for a long period of time(covering the dry and wet periods)such that all important interactions between storms(intensity,duration,and temporal pattern)and catchment characteristics are adequately sampled(Nathan and Ling,2016).
Continuous simulation of stochastically generated rainfall is a technique commonly used to perform a f lood frequency analysis based on routed runoff hydrographs obtained from a long series of recorded rainfall,and then establish design storm events from the data(Woldemeskel et al.,2016).This method provided a realistic example of the design storm event in Woldemeskel et al.(2016),including not only the peak discharge but also the temporal distribution of rainfall pattern and the depth of rainfall occurring before the rare storm burst.
In this study,the continuous simulation method was used to model a true rainfall pattern for assessing the performance of OSD systems during frequent storm events that occurred in the proximity of the development sites within recent history.
4.1.Model development
A runoff routing model was developed to perform continuous simulation with four key sequential components:inputting rainfall records from local pluviograph stations,developing a loss model,nonlinear catchment runoff routing,and level pool routing of detention storage via the establishment of an outlet rating curve.The procedure of continuous simulation analysis is described in detail below,which was carried out for each development site in Table 1 and for each series of recorded rainfall data.
DNRMEQG(2018)provides open access to pluviograph records for a number of South East Queensland catchments.Rainfall data obtained from each station are summarized in Table 2 below.
For the removal of rainfall loss from the rainfall data series prior to runoff routing,the initial loss-continuing loss(IL/CL)model was adopted(Hill and Thompson,2016),following the form of Eq.(1):

where PLis the rainfall loss,Ptis the total rainfall,PILis the initial loss,and PCLis the continuing loss.
To account for the drying of the catchment between storm bursts,the initial loss calculation was programmed to re-set after a period of time without signif icant rainfall.The case with rainfall less than 5 mm in three days was adopted as the re-set trigger for identifying and separating individual storm bursts for assessment.
Nonlinear routing was considered necessary for this application,given the importance of sensitivity to relatively minor alterations in hydrograph shape and in lieu of simpler methods such as the Muskingham-Cunge method(Cunge,1969).The routing calculation involved the continuity equation(Eq.(2))and its general solution(Eq.(3)),where the incoming excess rainfall hyetograph(I)was routed through the catchment storage(S)to generate the hydrograph outf low(Q).
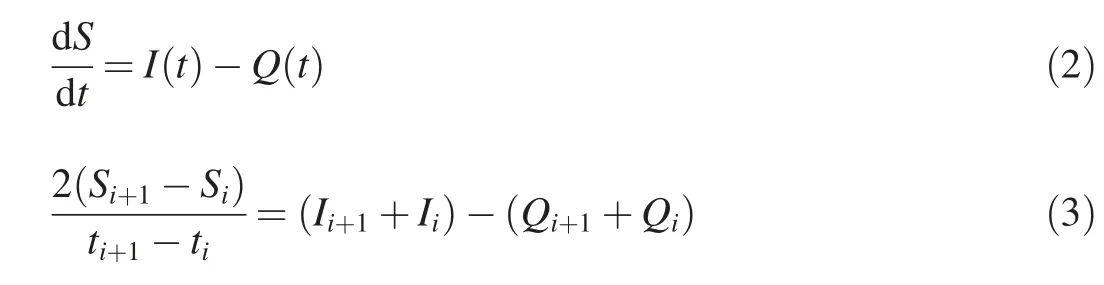
where t is time,and subscript i means the time step.Eq.(4)shows the nonlinearity of catchment storage,where k is adimensionlessvariabledepending on thestorageand discharge characteristics of the catchment,and m is a dimensionless constant.
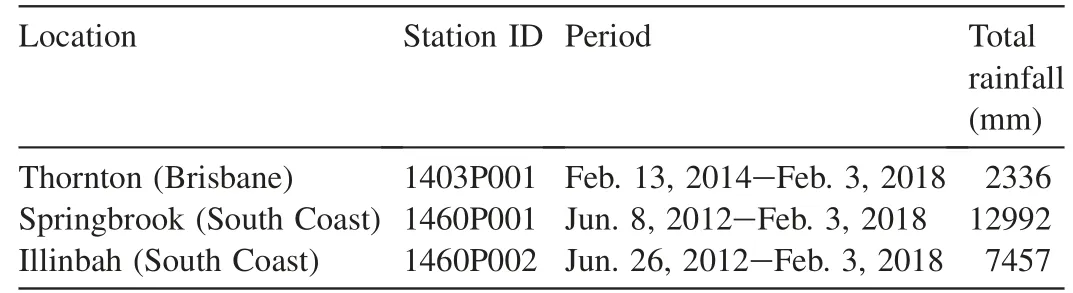
Table 2Pluviograph station data.

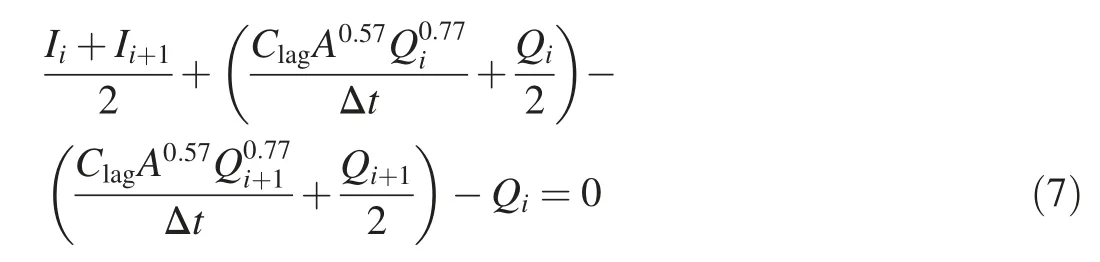
The solution to k developed by Boyd et al.(1996)and utilized in therunoff routing software WBNM wasadopted for this analysis,and is provided in Eqs.(5)and(6)for the pervious and impervious portions of the catchment area(A),respectively.

where Clagis a dimensionless parameter that is used to calibrate the equations of gauged f low or other methods of estimation.
Eq.(7)is a workable routing equation for pervious catchment runoff,which is a combination of Eqs.(3)and(5).The solution requires an iterative process to solve the current outf low(Qi+1)at each time step of the simulation,where the current time step inf low(Ii+1),previous time step inf low(Ii),and previous time step outf low(Qi)are all known.
Eq.(8)follows the same process of combining Eqs.(3)and(6)and was used to solve the runoff of impervious portions of catchments:
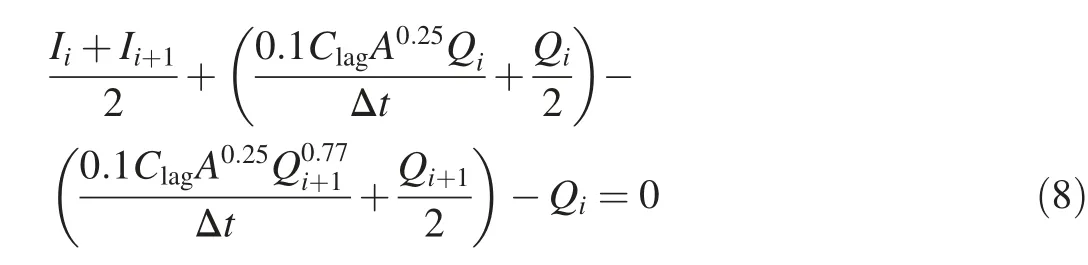
For all the catchment routing processes,the results of Eqs.(7)and(8)were added at each time step to produce the total catchment discharge hydrograph.
To describe the outf low of the detention system at various storage depths(Qh)during the simulation,a rating curve must be developed according to Ronalds and Zhang(2017):

where Ap,Aw,and P are the total area,wetted area,and wetted perimeter of the detention outlet pipe,respectively;D,L,and Sgare the diameter,length,and gradient of the detention outf low pipe,respectively;n is the roughness coeff icient;Cwand Lware the weir coeff icient and length,respectively;hweiris the height of the weir above the base of the detention system;h is the depth of water in the detention system;hDSis the standing water level downstream of the detention system;and g is the gravitational acceleration.The detention outf low pipe was located at the base of the detention system to ensure that it was free draining and did not hold water when there was no storm event.The Darcy-Weisbach friction factor,fD,is described by Eq.(10)(Brown,2002),which is dependent upon the Reynolds number,Re:
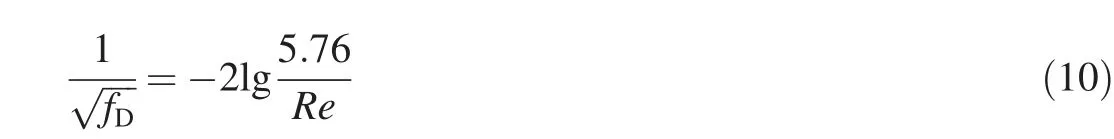
In this application,a f ixed Reynolds number was adopted,and validated against the programming of current industry software packages,such as RAFTS,RORB,WBNM,and DRAINS.
The process for calculating the detention effect on the hydrograph output of development sites requires a return to Eq.(3)to yield the specif ic form of Eq.(11)to perform level pool routing.

In post-processing,storm bursts relating to frequent storm events were identif ied for further analysis.Storm bursts were def ined as a period of rainfall exceeding a specif ied rainfall depth(Loveridge et al.,2015a).In the case of this study,all storm events with rainfall exceeding a depth of 5 mm in three days were identif ied as storm bursts.From the total number of storm bursts identif ied,the storm bursts relating to the classif ication of frequent storm events were extracted.
For each of the storm bursts used in the analysis,the hydrograph peak in the pre-development scenario was compared to the peak discharge with OSD systems.When the peak discharge with OSD systems exceeded that in the predevelopment scenario,a failure to achieve frequent f low management objectives was recorded.
4.2.Simulations and result analysis
The total number of storm bursts and the total number of failures to achieve peak discharge mitigation objectives in the results of the continuous simulation analysis are summarized in Table 3.
Table 3 shows 345 storm bursts,with each representing a frequent storm event.Failures to achieve the objectives of peak discharge mitigation were observed in 202 cases,accounting for 59%of the total events.The results of the continuous simulation analysis therefore corroborate the results of the ensemble analysis,highlighting a signif icant potential for unanticipated increasesin peak stormwater runoff at actual development sites during frequent storm events.
4.3.Example event analysis:Tropical Cyclone Debbie
Many of the failures to achieve the objectives of peak discharge mitigation identif ied in Table 3 occurred during rainfall events in South East Queensland that followed Tropical Cyclone Debbie in May 2017.The rainfall pattern at the peak intensity of Debbie had a duration of approximately 120 min and a peak rainfall intensity of approximately 120 mm/h.Depending on the sizes of development sites and their catchment response,the storm burst correlates approximately to a runoff event with an AEP value between 63%and 20%.
Fig.4 shows a comparison of the recorded rainfall pattern during Debbie's 120-min storm burst to the design temporal pattern of a 120-min storm event given by ARR1987.The vertical axis describes the percentage of the rainfall volume during the storm event over time on the horizontal axis.While the two data sets achieve a comparable peak,the patterns are distinctively different in shape and timing.In both instances,the peak of the storm delivers a 5-min burst with an intensity holding 14.5%of the total storm volume.The design storm has its peak occurring early,at 35 min in the storm event,whereas the observed pattern has the peak landing much later,at 70 min in the storm event.
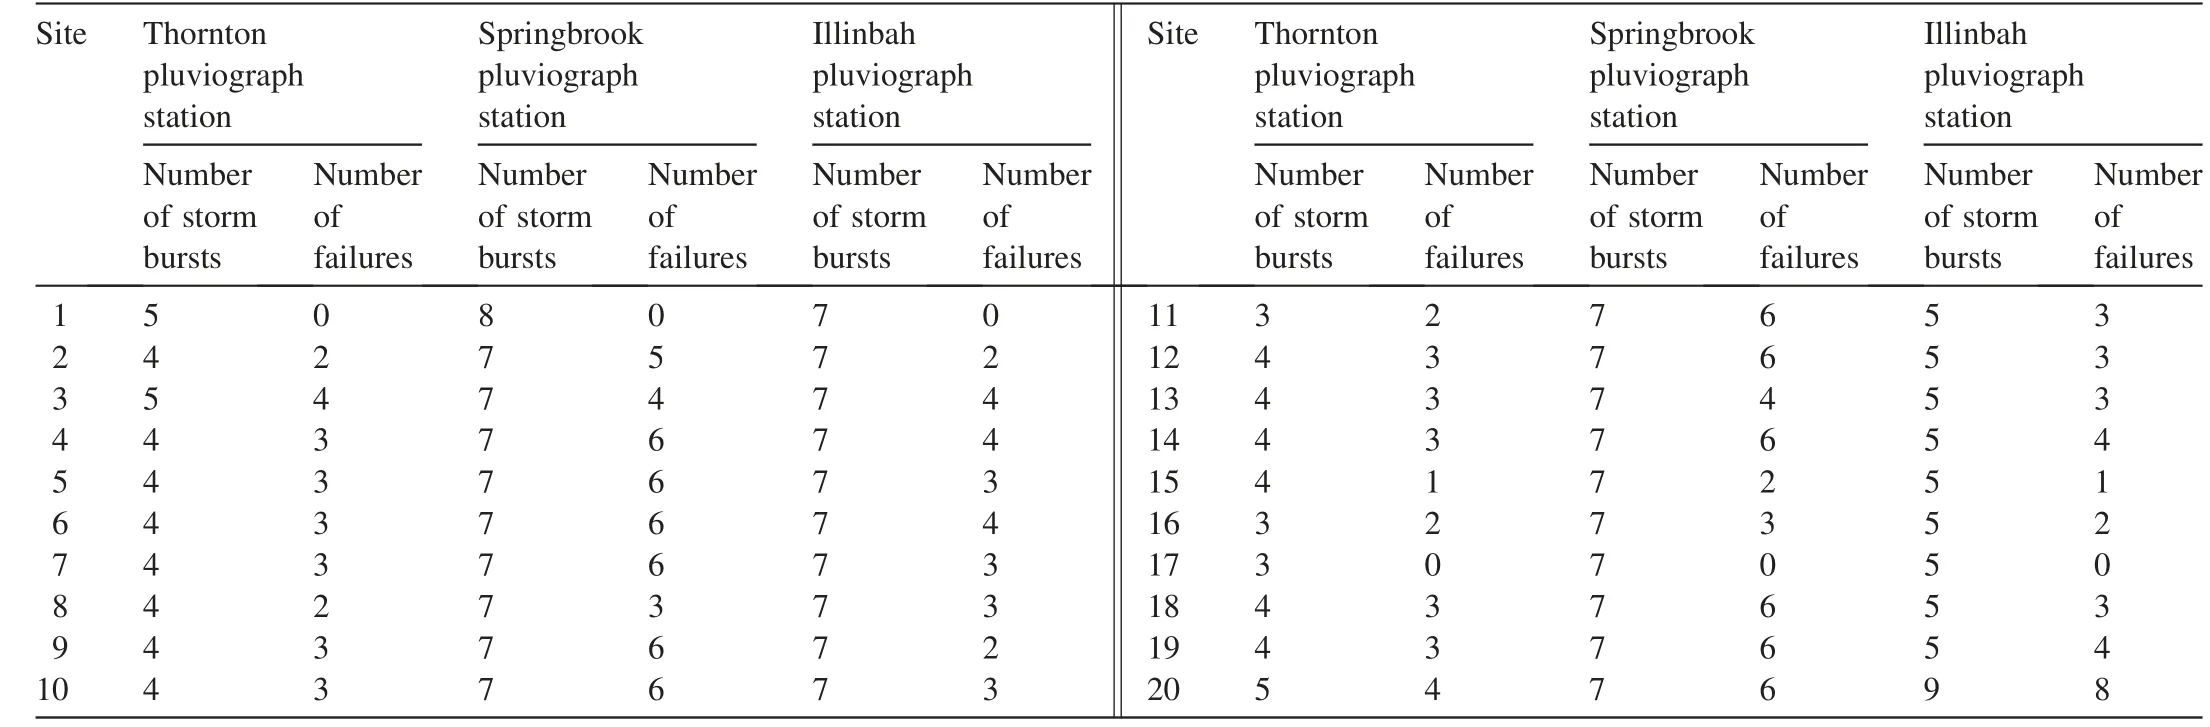
Table 3Results of continuous simulation analysis.
Fig.5 shows the routed hydrographs that relate to the rainfall during Tropical Cyclone Debbie occurring at the sampling development site No.15.The results show that OSD is effective in reducing a number of smaller hydrograph peaks.However,the OSD outf low is in excess of the largest peak of the storm in pre-development conditions,signifying failure.
The failure shown in Fig.5 can be explained by the inconsistency between the rainfall patterns in Fig.4.During the design and assessment of the performance of this specif ic OSD,it could be assumed that the temporal pattern given by ARR1987 wasstrictly relied upon to reach the conclusion that the OSD system would achieve its objectives.In reality however,the rear-loaded nature and clustering of actual rainfall patterns that occurred during Tropical Cyclone Debbie resulted in unexpected conditionsthat the OSD system wasnot designed to account for.

Fig.4.Recorded rainfall pattern of Tropical Cyclone Debbie compared to design temporal pattern given by ARR1987.
5.Discussion
5.1.Broadscale retrof it for existing OSD systems
Thedataand analysespresented in thispaper can beused to assess the potential for a generalized solution to the problem of existing OSD systems failing to meet design objectives.A reduction of the OSD pipe outlet diameter is commonly considered to be a potential solution.In practice,this can be achieved via a basic retrof it of existing OSD systems by installation of an orif ice plate on the outlet pipe(s).Based on the additional continuous simulation analysis,Fig.6 shows a performance curve of failures to achieve frequent f low management objectives,varying with the reduction factor of the OSD pipe outlet diameter.All the twenty development sites in Table 1 in response to rainfall from all three pluviograph stations in Table 2 were modeled to create Fig.6.
Fig.6 indicatesthat a 40%reduction factor of the OSD pipe outlet diameter applied universally to all the development sites yields the optimal results.After this retrof it is physically introduced to all the OSD systems,the average probability of failure is reduced from 59%to less than 30%.
Further assessment of this proposal using the ensemble analysisprovidesa lesspromising view.Assuming that the 40%reduction factor is applied to the twenty development sites,Table 4 shows the performance of the OSD systems in both frequent(AEPof 63%)and rare(AEPof 1%)design events.
The results from the ensemble analysis of the retrof it strategy in Table 4 agree with the continuous simulation results in Fig.6,showing that failures to achieve frequent f low management objectives can be reduced to six out of twenty sites(i.e.,30%failure)in frequent events.However,this comesat thecost of asignif icant increasein failuresto achieve objectives in rare events.

Fig.5.Failure to achieve objectives at largest peak discharge during Tropical Cyclone Debbie.
5.2.Moving forward with ensemble analysis

Fig.6.Failures to achieve frequent f low management objectives under reduction of OSD pipe outlet diameter.
Based on the results in Table 4,a broadscale retrof it solution is not considered to be a viable recommendation.In exchange for a marginal improvement to the performance in frequent storm events,an increased expectance of failure in rare events is considered to be a likely and unacceptable consequence.This leaves the solution to the problem limited to case-by-case re-design using improved methods.
Using the ensemble design method,the twenty sites were re-modeled with DRAINS,and the OSD systems were reconf igured to ensure that objectiveswould be met for all the design storm events.The modif ications required are described in Table 5,including alterations to both the outlet pipe diameter and storagevolume.Also presented in Table 5 are the results of the performance of the OSD systems after modif ication in response to the real recorded rainfall using the continuous simulation analysis.
Table 5 presents an important f inding that considering the ensemble of ten temporal patterns in the design of OSD systems did not guarantee the achievement of peak f low management objectives in response to real rainfall.Whilst all the OSD systemsfully achieved objectivesfor all thedesign storm events using the ensemble analysis,OSD systems failed to achieve objectives for a total of 135 storm bursts,or 39%of the total storm bursts,in real rainfall according to the continuous simulation analysis.This was however reduced from the 202 storm bursts,or 59%of the total storm bursts,in which OSD systems failed when they were designed using the ARR1987 method.The f indings therefore support the feasibility of changing from the useof singular temporal patternsto the consideration of multipletemporal patternsin the design of OSD systems.
5.3.Ensemble prediction uncertainty
In alignment with current practice,this study adopted the closest-to-median hydrograph resulting from one of the ten ensemble analyses,and disregarded the remaining nine hydrographs.Assessment of the OSD performance was then based upon a pass/fail test of the selected hydrograph.This process results in prediction uncertainty.
Typically,there is a peak discharge variation of 10%-20%in the ten hydrographs generated with the ensemble analysis in both pre-and post-development scenarios.The objective of OSD systems is often to reduce peak discharge by quantities that are close to the variation in peak discharge resulting from the ensemble analysis of hydrographs,meaning that it is possible for storm events being outside of the selected closest-to-median hydrograph to cause additional failures to achieve objectives.This reality compounds the study and provides a basis for further investigations into the statistical acceptance criteria for the use of multiple temporal patterns.

Table 4Performance of OSD systems obtained by ensemble analysis,with 40%reduction factor of OSD outlet pipe diameter.

Table 5Assessment of case-by-case retrof it to comply with ARR2016.
6.Conclusions
A concern has been raised that OSD systems constructed for recent developments in Australia are failing to meet frequent f low management objectives,due to a reliance on singular temporal patterns for design events according to their specif ication.This concern was conf irmed using real examples of development sites and recorded rainfall series of frequent storm events.
The key f inding of this study is that the use of one design rainfall pattern or even an ensemble of ten rainfall patterns cannot reliably produce an OSD system design that will always be effective when exposed to real patterns of naturally occurring rainfall.Based on this study,the conf idence limits for OSD systems to meet the objectives of peak discharge mitigation should be no greater than 41%and 61%for frequent storm event management using the ARR1987 and ARR2016 methods,respectively.
A generalized solution was considered to reduce the number of failuresin frequent events.However,theresulting tradeoff in achieving signif icant improvementsin frequent eventsis an unacceptable risk of failuresin rareevents,which can result in f looding.
Increasing the number of temporal patterns for the design and assessment of OSD systemswasconf irmed to improvethe success rate of achieving objectives.As a recommended solution to the problem,as many potential temporal patterns as possible should be considered in practice.
 Water Science and Engineering2019年1期
- Water Science and Engineering的其它文章
- Application of power law to vertical distribution of longshore currents
- Computational investigation of hydraulic performance variation with geometry in gabion stepped spillways
- Treatment of hydroxyquinone-containing wastewater using precipitation method with barium salt
- Modeling river water quality parameters using modif ied adaptive neuro fuzzy inference system
- Evaluation of copper removal eff iciency using water treatment sludge
- Biosorption of Ni(II)ions from aqueous solution using modif ied Aloe barbadensis Miller leaf powder