
Bioinformatics analyses of differentially expressed genes associated with spinal cord injury:a microarray-based analysis in a mouse model
2019-03-15 07:46LeiGuoJingLvYunFeiHuangDingJunHaoJiJunLiu
中国神经再生研究(英文版) 2019年7期
Lei Guo, Jing Lv, Yun-Fei Huang, Ding-Jun Hao, Ji-Jun Liu,
1 Department of Spinal Surgery, Honghui Hospital, Xi'an Jiaotong University, Xi'an, Shaanxi Province, China
2 Department of Clinical Laboratory, Honghui Hospital, Xi'an Jiaotong University, Xi'an, Shaanxi Province, China
Abstract Gene spectrum analysis has shown that gene expression and signaling pathways change dramatically after spinal cord injury, which may affect the microenvironment of the damaged site. Microarray analysis provides a new opportunity for investigating diagnosis, treatment,and prognosis of spinal cord injury. However, differentially expressed genes are not consistent among studies, and many key genes and signaling pathways have not yet been accurately studied. GSE5296 was retrieved from the Gene Expression Omnibus DataSet. Differentially expressed genes were obtained using R/Bioconductor software (expression changed at least two-fold; P < 0.05). Database for Annotation, Visualization and Integrated Discovery was used for functional annotation of differentially expressed genes and Animal Transcription Factor Database for predicting potential transcription factors. The resulting transcription regulatory protein interaction network was mapped to screen representative genes and investigate their diagnostic and therapeutic value for disease. In total, this study identified 109 genes that were upregulated and 30 that were downregulated at 0.5, 4, and 24 hours, and 3, 7, and 28 days after spinal cord injury. The number of downregulated genes was smaller than the number of upregulated genes at each time point. Database for Annotation, Visualization and Integrated Discovery analysis found that many in flammation-related pathways were upregulated in injured spinal cord. Additionally, expression levels of these in flammation-related genes were maintained for at least 28 days. Moreover, 399 regulation modes and 77 nodes were shown in the protein-protein interaction network of upregulated differentially expressed genes. Among the 10 upregulated differentially expressed genes with the highest degrees of distribution, six genes were transcription factors. Among these transcription factors, ATF3 showed the greatest change. ATF3 was upregulated within 30 minutes, and its expression levels remained high at 28 days after spinal cord injury. These key genes screened by bioinformatics tools can be used as biological markers to diagnose diseases and provide a reference for identifying therapeutic targets.
Key Words: nerve regeneration; spinal cord injury; differentially expressed genes; bioinformatics analyses; Database for Annotation, Visualization and Integrated Discovery analysis; in flammation; Kyoto Encyclopedia of Genes and Genomes pathway; microarray; transcription factors;neural regeneration
Introduction
As part of the central nervous system, the spinal cord is crucial for conveying afferent and efferent impulses between the brain and somatic/visceral receptors, as well as executing re flexes. However, its vulnerability and limited capacity for regeneration and self-renewal makes recovery from mechanical trauma difficult. Indeed, severe spinal cord injury(SCI) often results in permanent functional impairment,such as motor/sensory dysfunction or bladder and rectal disturbances (Bastien et al., 2015; Jain et al., 2015; He and Jin,2016). Thus, SCI can diminish a patient's quality of life and cause a heavy burden for families (Qiu, 2009). For decades,doctors and patients have been searching for effective interventions and therapies for SCI that do not exhibit serious side effects. However, because of limitations in therapeutic applications, there are currently no available therapies for an effective recovery (Wyndaele and Wyndaele, 2006; Courtine et al., 2011; Yang et al., 2016). Schwab (2002) suggested four principal strategies for SCI repair: promoting regrowth of interrupted nerve fiber tracts, bridging spinal cord lesions,repairing damaged myelin, and restoring nerve-fiber impulse conductivity. Some promising therapeutic interventions, such as cell transplantation and metabolic interventions, have shown effectiveness in animal models (Zhang et al., 2009; Guerrero et al., 2012; Tsukahara et al., 2017; Nordestgaard et al., 2018). Nevertheless, these potential therapies must be further tested in animal models and validated in human clinical trials.
Clarifying the pathological and molecular changes after SCI is crucial because the endogenous mechanisms for repair and intervention may provide potent insight for therapy exploration. Injury can elicit in flammatory stimuli, which then in fluence the production of proin flammatory cytokines and other mediators (Peifer et al., 2006). Localized immune/inflammatory responses are important contributions to secondary tissue damage and functional deficits after SCI(Ghasemlou et al., 2010), and are also essential for cleaning tissue debris and remodeling and repair after injury. Previous studies (Carlson et al., 1998; Schnell et al., 1999; Hashimoto et al., 2003, 2005) have shown that the lesion phase can be divided into three stages. First, neutrophil in filtration and cell death dramatically increase (Liu et al., 1997). Second, macrophages/microglia accumulate and proliferate, which can result in harmful effects on surrounding tissues. Third, glial scars form, in which astrocytes play a harmful role in tract regeneration by surrounding the injured tissue and producing scar-associated compounds. The characteristics of inflammation and extent of glial scar formation represent the most distinct differences between the acute, sub-acute, and chronic phases of the SCI microenvironment. Hence, microenvironmental changes after SCI may affect prognosis (Nishimura et al., 2013), and must be considered for functional recovery at different stages.
Recently, gene profiling studies have suggested that gene expression and signaling pathways are substantially changed after SCI (Di Giovanni et al., 2003; Byrnes et al., 2011; Lee-Liu et al., 2014), and may in fluence the microenvironment of the injury site. Microarray analyses have provided novel perspectives on diagnosis, therapy, and prognosis prediction for SCI (Nesic et al., 2002; Xiao et al., 2005). However,differentially expressed genes (DEGs) are rarely consistent across different studies (Nesic et al., 2002; Di Giovanni et al., 2003; Xiao et al., 2005; Byrnes et al., 2011; Lee-Liu et al.,2014; Duran et al., 2017), and many important genes and pathways have not been thoroughly investigated. As DEGs may provide therapeutic targets, exact changes in the gene transcriptome and the underlying cellular and molecular mechanisms still need to be clarified, compared, and critically analyzed for different time points, especially the acute,sub-acute and chronic phases.
In the present study, we focused on alterations in gene expression in the thoracic spinal segment (T8) of the mouse spinal cord at six different time points (0.5, 4, and 24 hours,3, 7, and 28 days) after SCI, because alterations at these time points are likely related to pathological changes associated with SCI. In this study, we compared gene expression patterns at different time points and analyzed them using bioinformatic methods, particularly from a protein-protein interaction perspective. The aim of our study was to identify potential genes/pathways and clarify the mechanisms underlying SCI at the molecular level.
Materials and Methods
Retrieval of microarray dataset
The microarray dataset, GSE5296, was downloaded from the Gene Expression Omnibus DataSet from the National Center for Biotechnology Information Database (http://www.ncbi.nlm.nih.gov/gds/). GPL1261 (Affymetrix Mouse Genome 430 2.0 Array) (Affymetrix Inc., Santa Clara Valley, CA, USA) was used as the platform. C57BL/6 mice were used as subjects. All animals were deeply anesthetized during surgery under isoflurane anesthesia. Moderate injury was delivered to each SCI mouse at T8. Mice were then sacrificed at the following time points: 0.5, 4, and 24 hours, and 3, 7, and 28 days (n = 3/per subgroup). Tissue samples from the impact site (0.4 cm in length) were collected after sacrifice. Each individual was pooled (4 mice in total), and 12 mice were prepared at each time point. A control group (n = 2/per subgroup) that underwent sham injury was included.
DEG profiling in tissue from the SCI impact site
Raw data were downloaded, and R/Bioconductor software(v3.4.1, R Foundation, Vienna, Austria) (Gregory Alvord et al., 2007; Barrett et al., 2013) was used to check the data quality. The software indicates whether the quality of each selected CEL was sufficient (Additional Figure 1). gcRobust Multi-array Average (gcRMA) analysis was used as the normalization algorithm for gene expression profiling, and the limma algorithm package was used for DEG identification(Gregory Alvord et al., 2007; Barrett et al., 2013). Spinal cord tissue from sham injury mice was used as the control.DEGs were defined as genes with at least 2-fold changed expression, with P-values < 0.05 between the control group and any subgroup at six time points. Hierarchical clustering analyses were also performed for DEGs.
Functional enrichment analysis of DEGs
The bioinformatics resource, Database for Annotation, Visualization and Integrated Discovery (DAVID) (Huang da et al., 2009) (https://david.ncifcrf.gov/) was used for functional annotation. The Kyoto Encyclopedia of Genes and Genomes(KEGG) pathway analysis and Gene Ontology (GO) analysis were used to identify genes of interest. Enriched terms for KEGG pathway and GO analysis were collected, including Gene Ontology Biological Process, Cellular Components,and Molecular Function (abbreviated as GO_BP, GO_CC,and GO_MF). Those with P-values < 0.05 were considered significantly enriched terms.
Prediction and analysis of transcription factors
Based on the Animal Transcription Factor Database (TFDB)(http://bioinfo.life.hust.edu.cn/AnimalTFDB/) (Zhang et al.,2015), DEGs that were transcription factors were identified.Interaction networks of DEGs were also constructed using Search Tool for the Retrieval of Interacting Genes/Proteins(STRING) (Franceschini et al., 2013) (v10.5) and Cytoscape software (Smoot et al., 2011) (v3.6.0; National Institute of General Medical Science, Bethesda, MD, USA) to identify protein-protein interactions. The score threshold was set to 0.04.
Statistical analysis
All statistical analyses were performed using GraphPad Prism software (v6; GraphPad Software, San Diego, CA, USA) and SPSS software (v20.0; IBM SPSS Inc., Chicago, IL, USA).P-values < 0.05 were considered statistically significant.
Results
Identification of DEGs from SCI site tissue

Figure 1 DEGs at the injury site in mice.
The gene expression dataset, GSE5296, was used to identify DEGs from a SCI murine model using a microarray representing approximately 34,000 genes. By comparing the control group and SCI subgroups at each time point, several DEGs were identified, with the numbers shown in Figure 1. SCI led to upregulation of 2,460 genes in injured spinal cord at 7 days after injury, 109 of which were upregulated at each time point. Moreover, many of these upregulated genes were associated with inflammation. In total, 2010 genes were downregulated at the injury site at 7 days following SCI, 30 of which were downregulated at each time point. Interestingly, the number of downregulated genes was always smaller than the number of upregulated genes at each time point. Overall, we identified 109 upregulated genes and 30 downregulated genes with consistent directions of variation at each time point (Figure 2). Additional Table 1 contains the complete list of DEGs.
Functional annotation of DEGs in SCI site tissue
Using the DAVID tool, enriched KEGG and GO terms were identified from the DEGs. Figure 3 shows the number of KEGG and GO terms that were enriched in each SCI subgroup. The results indicate a peak on day 7, which is similar to the tendency shown by the DEGs. For each SCI subgroup,the three KEGG pathways showing highest changes in enrichment scores are listed in Additional Table 2. Similarly,those for the GO terms are shown in Additional Table 3.Notably, KEGG analysis revealed that genes related to metabolic pathways were downregulated on day 7, with metabolic pathways also showing the largest number of enriched genes. This was also the finding on day 28. Some genes related to in flammatory processes were upregulated on either day 7 or 28 after SCI, with the majority of these genes upregulated at both time points.
DAVID analysis was performed for upregulated DEGs with the same direction of variation at each time point after SCI (see Tables 1 and 2 for details). Accordingly, many inflammation-related pathways were upregulated in injured spinal cord. One pathway showing the greatest change in gene expression profiling was the tumor necrosis factor signaling pathway. In flammatory response was also top-listed when GO_BP terms were sorted by the number of enriched genes. For these inflammation-related genes, higher expression levels were maintained in the SCI animal model for at least 28 days. Thus, we next focused on these genes.A striking finding was that some C-C motif chemokine-ligand genes were markedly upregulated at each time point.Among these, CCL3 showed obvious upregulation within 30 minutes after SCI, with at least a 6-fold increase in expression at each time point until day 28. Additionally, the Timp3 gene, a tissue inhibitor of metalloproteinases, was found to be upregulated at each time point.
Protein-protein interactions
A protein-protein interaction network was constructed based on expression changes of DEGs with the same direction of variation at each time point after SCI (Figure 4A).The network contained 84 nodes and 410 pairs of connec-tions. The 10 DEGs showing the highest degrees of change were: JUN, FOS, TRP53, PTGS2, CCL2, MYC, TLR2,STAT3, ATF3, and ICAM1, all of which primarily participate in the cytokine response.
To investigate transcriptome changes after SCI, AnimalTFDB 2.0 was used for transcription factor prediction.To investigate transcriptional activity of transcription factors, we constructed an interaction network from DEGs that were upregulated at various time points. Several transcription factors were found among these DEGs. The network contained 399 regulation modes and 77 nodes involving 15 transcription factors (Figure 4B). Because DEGs with higher-degree distributions may play more important roles in SCI pathogenesis, we reviewed gene expression of transcription factors with the highest degrees. Overall, the 10 upregulated DEGs with the highest degrees were: JUN, FOS,TRP53, PTGS2, CCL2, MYC, TLR2, STAT3, ATF3 and ICAM1, six of which are transcription factors. Among these transcription factors, ATF3 exhibited the greatest change(almost 64-fold increase). Indeed, it was upregulated within 30 minutes after SCI, and its expression levels remained high even on day 28.
Discussion
Spinal cord injury can result in neurological dysfunction involving locomotor, sensory, and autonomic systems. Therefore, understanding its pathogenesis is crucial for further strategies aimed at prevention and therapies. In this study,we used gene expression profiling to identify and characterize a number of DEGs in the T8 segment of the spinal cord at different time points following injury. At each time point,the majority of these DEGs were upregulated, suggesting a greater amount of transcriptional activation.
Notably, KEGG analysis revealed that genes related to metabolic pathways were downregulated on day 7, when the largest number of enriched genes was observed, which was the same on day 28. Moreover, our results show that genes related to in flammatory processes were upregulated within 30 minutes, and continued to be upregulated on even day 28 after SCI, with a peak on day 7. Therefore, inflammation-related pathways were retrieved for Mus musculus (mouse) from the KEGG website (http://www.kegg.jp/). DAVID bioinformatics analysis revealed that almost half of these pathways were enriched for DEGs related to inflammation. Among these pathways, the tumor necrosis factor signaling pathway, rheumatoid arthritis, in flammatory bowel disease, toll-like receptor signaling pathway, phagosome, nuclear factor-kappa B signaling pathway, chemokine signaling pathway, cell adhesion molecules, MAPK signaling pathway, Staphylococcus aureus infection, and HTLV-I infection were identified.
Injury can elicit in flammatory stimuli, which then induce pathological accumulation and proliferation of in flammatory cells, a process that involves neutrophils, macrophages/microglia, and astrocytes (Liu et al., 1997; Carlson et al.,1998; Schnell et al., 1999; Hashimoto et al., 2003, 2005;Peifer et al., 2006; Ghasemlou et al., 2010; Nishimura et al.,2013). Naturally, various mediators are released into the microenvironment, including proinflammatory chemokines/cytokines and proteases (Peifer et al., 2006; Rice et al.,2007). Localized immune/inflammatory responses exacerbate the initial damage and contribute to secondary tissue damage after SCI, which can then result in functional de ficits (Ghasemlou et al., 2010). However, these in flammatory responses are also essential for cleaning tissue debris and remodeling and repair after injury. Specifically, neutrophil invasion appears at approximately 6 hours after SCI,as evidenced by upregulation of inflammatory cytokines(Liu et al., 2002), such as interleukin-1α, interleukin-1β,interleukin-6, and tumor necrosis factor α. At 1 day after SCI, neutrophil number reaches peak levels at the injury site (Carlson et al., 1998; Schnell et al., 1999). Meanwhile,macrophages start to emerge at 3 days, reaching a peak at 7 days (Zhu et al., 2017). Macrophages may produce mediators that contribute to subsequent processes. Macrophage in filtration into the injury site at 7 days is best described as foam cells (Zhu et al., 2017), whose function largely depends on the surrounding microenvironment (Amit et al., 2016).Moreover, Guerrero et al. (2012) indicated that blockade of the interleukin-6 pathway in macrophages may promote regeneration of the spinal cord in mice. After the inflammatory reaction, the residual area is surrounded by glial scarring. Astrocytes begin to increase after SCI by day 2 and high numbers are maintained for at least 14 days (Baldwin et al., 1998), a situation that can produce potent inhibitors of neurite outgrowth (Wanner et al., 2013). Moreover, inducible nitric oxide synthetase is synthesized in glial scars,while regeneration of spinal cord tracts is inhibited by glial scar formation. Hence, the lesion phase can be divided into three stages (Hashimoto et al., 2005). First, neutrophils in filtrate and cell death dramatically increases (Liu et al., 1997).Subsequently, macrophages/microglia accumulate and proliferate, which may have dual effects on surrounding tissue.Glial scar formation comprises the final stage, and astrocytes hinder tract regeneration by surrounding the injured tissue and producing scar-associated compounds.
These findings led us to investigate the function of persistent dysregulated genes in the spinal cord after injury.In this study, we identified 109 upregulated genes and 30 downregulated genes that maintain the same variation tendency at each time point. Subsequently, we performed DAVID analysis separately for up- and downregulated DEGs.Not surprisingly, our results show that many inflammation-related pathways are upregulated in the injured spinal cord. The tumor necrosis factor signaling pathway exhibited the greatest change, with high expression levels of in flammation-related genes of this pathway lasting for at least 28 days in our SCI model mice. Strikingly, some C-C motif chemokine ligand genes were also markedly upregulated. Among these, the CCL3 gene showed the most obvious upregulation, beginning within 30 minutes after SCI and lasting for as long as 28 days (more than a 6-fold increase at each time point). This gene participates in the toll-like receptor signaling pathway, cytokine-cytokine receptor interaction,and the chemokine signaling pathway. CCL2 and CCL12 are involved in the tumor necrosis factor signaling pathway, nuclear factor-kappa B signaling pathway, and chemokine signaling pathway. Moreover, it has been reported that matrix metalloproteinases (MMPs) regulate in flammation after SCI(Zhang et al., 2011). Appropriately, our results show that MMP2 and MMP14 are upregulated at every time point.Additionally, TIMP3 (a tissue inhibitor of metalloproteinases) was also upregulated. Because inflammation-related genes and inflammatory responses participate in injury processes, our results provide potential targets for molecular therapies aimed at regulating in flammation.

Figure 2 Bi-cluster analysis of DEGs with consistent directions of variation at each time point following SCI compared with the control group.
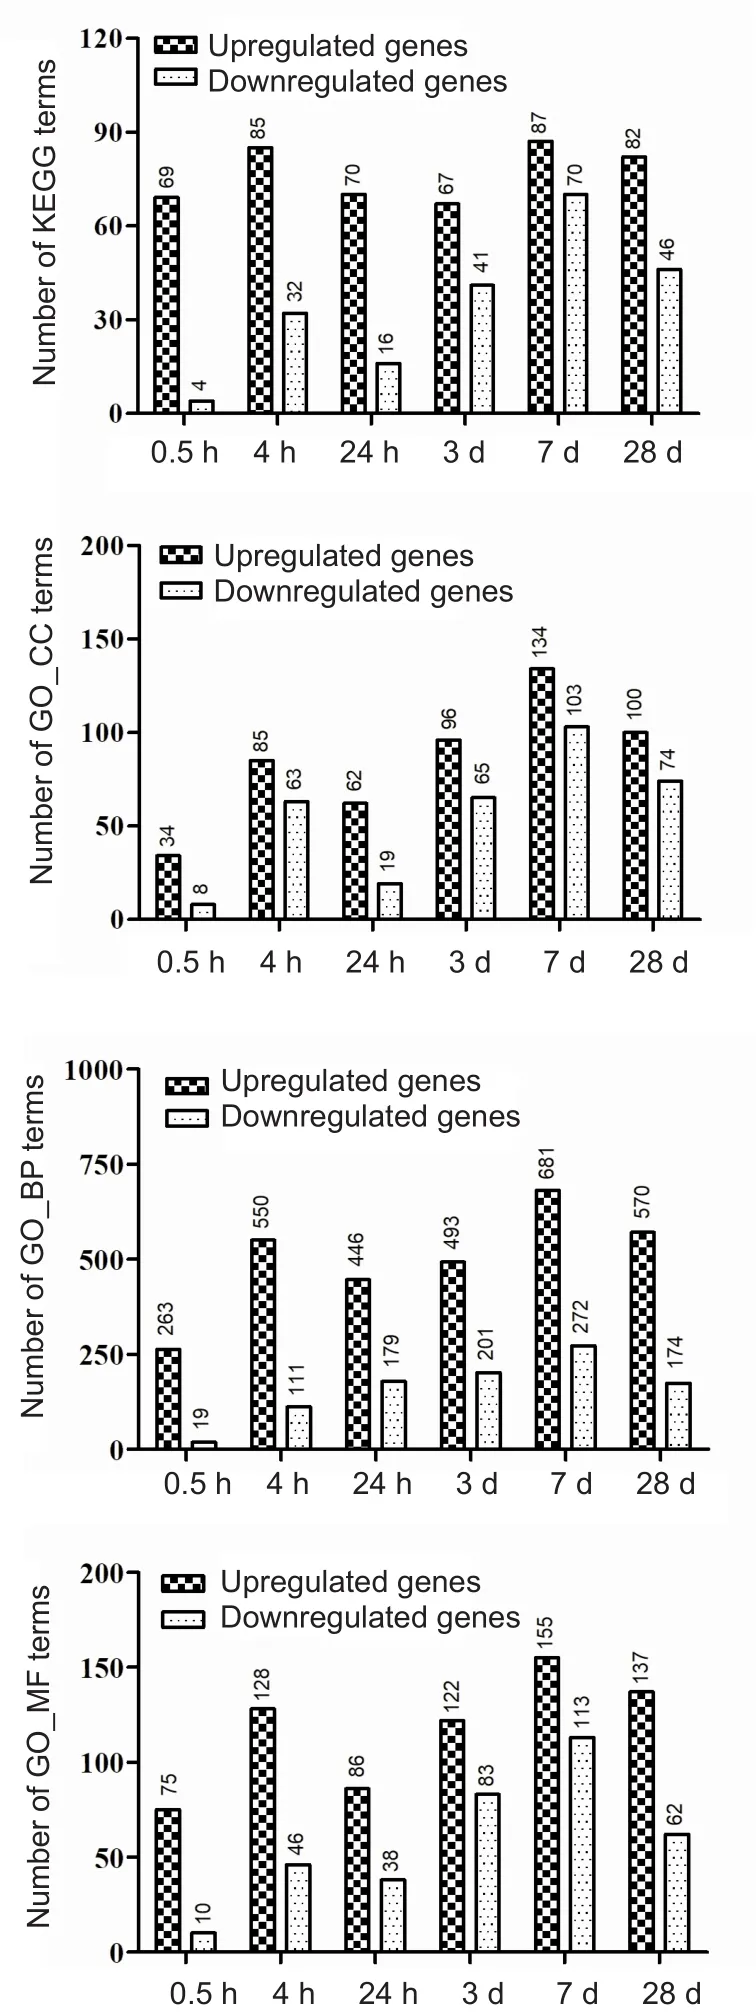
Figure 3 Overview of KEGG and GO terms enriched at each time point of spinal cord injury compared with the control group.

Figure 4 Interaction networks of DEGs with the same variation tendency at each time point of SCI.

Table 1 Top-20 KEGG terms of upregulated differentially expressed genes with the same variation tendency at each time point after spinal cord injury
To investigate transcriptome changes after SCI, transcription factors were predicted based on AnimalTFDB 2.0. An interaction network of upregulated DEGs at each time point was then constructed, with transcription factors identified among these DEGs. The network contained 399 regulation nodes, which was far more than expected. The network also showed that 15 transcription factors were involved in 77 nodes. Moreover, 6 of the 10 upregulated DEGs showing the highest degrees of distribution were transcription factors.Consequently, we focused on transcription factors withhigher-degree distributions because these DEGs may play important roles in SCI pathogenesis. Among these six transcription factors, ATF3 showed the greatest change (almost 64-fold increase), which began within 30 minutes after SCI and was still high at 28 days. Thus, according to our network analysis, we predict that ATF3 is the key transcription factor, showing long-term increased expression and interacting with many proteins.
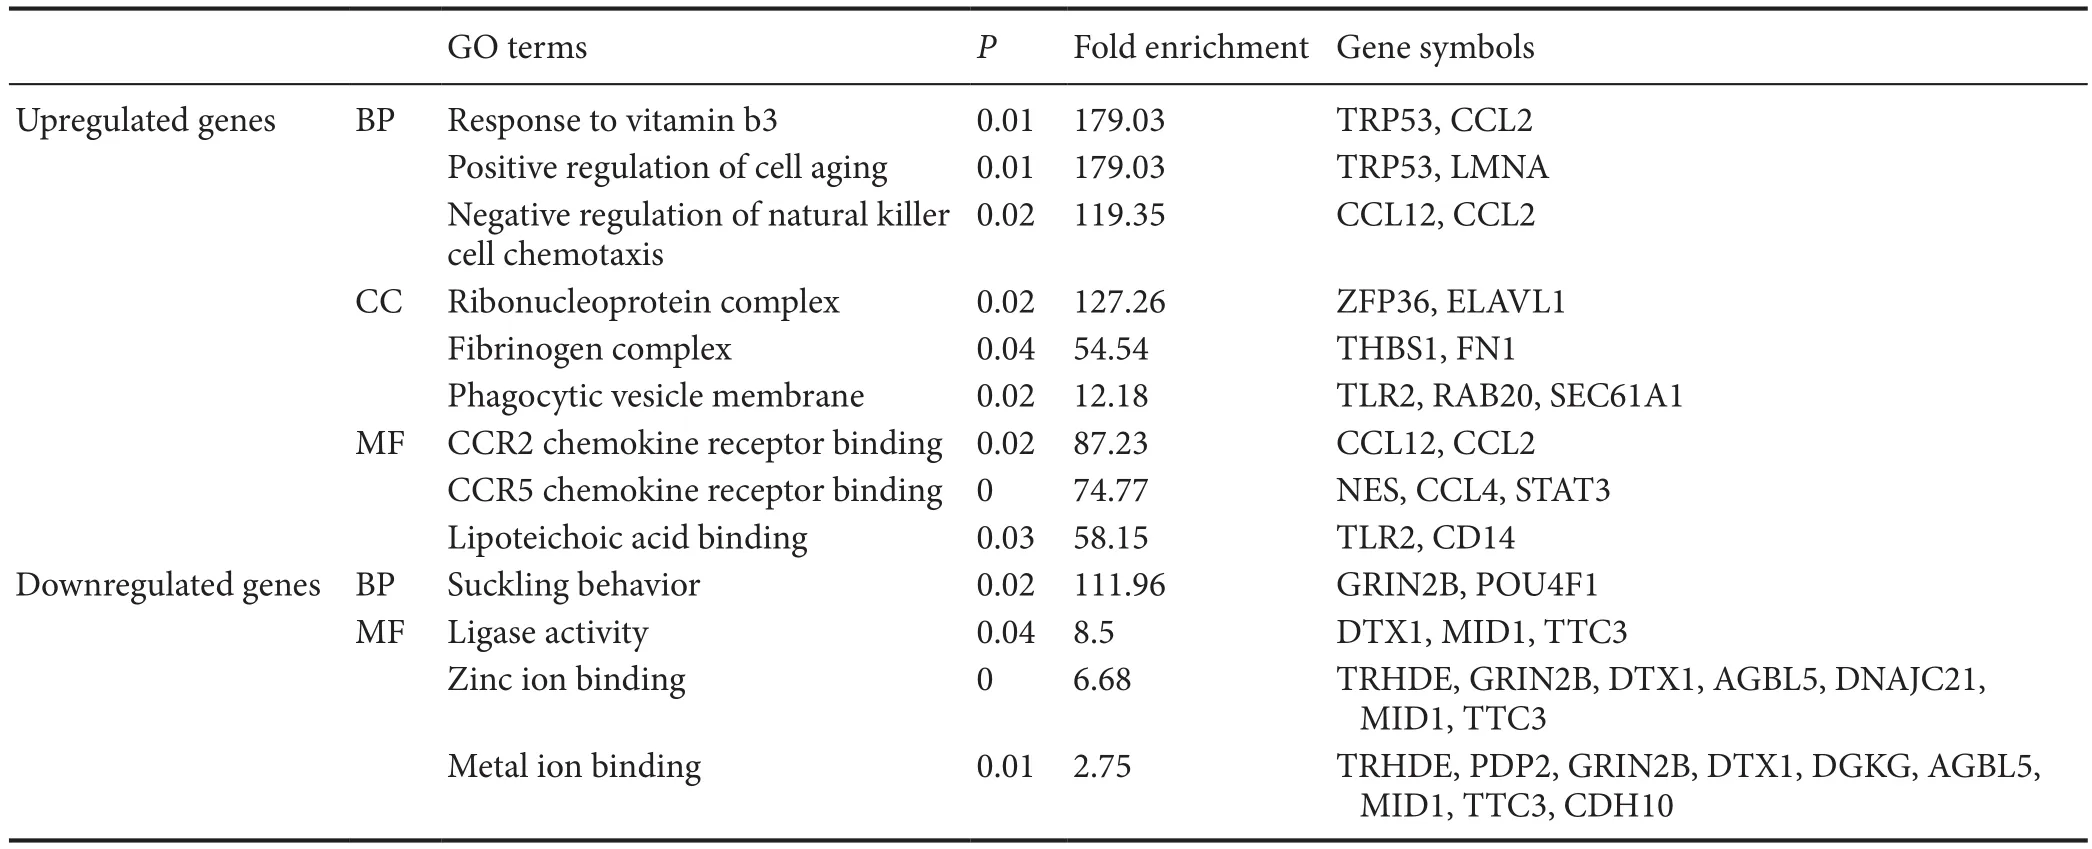
Table 2 Top-three GO terms with highest fold enrichment scores of differentially expressed genes with the same variation tendency at each time point after spinal cord injury
As an activating transcription factor, ATF3 may play important roles in in flammation and carcinogenesis in various diseases (Gilchrist et al., 2006; Lin et al., 2014; Huang et al.,2015; Rao et al., 2015; Bar et al., 2016; Iezaki et al., 2016;Mallano et al., 2016; Udayakumar et al., 2016; Wang et al.,2016; Kaitu'u-Lino et al., 2017; Kim et al., 2017). ATF3 can be induced by the toll-like receptor signaling pathway,and in turn, appears to negatively regulate toll-like receptor-stimulated inflammatory responses (Gilchrist et al.,2006). ATF3 can translocate into the nucleus and recruit histone deacetylase-1 to the promoter of interleukin-6 and tumor necrosis factor, ultimately repressing their expression(Gilchrist et al., 2006). Lai et al. (2013) have already shown that ATF3 regulates the release of some in flammatory molecules to reduce lung injury and decrease mortality rate of mice challenged by lipopolysaccharide. ATF3 can also bind DNA sites with Jun to form homo- or hetero-dimers (Tsujino et al., 2000; Koh et al., 2010). The Jun family protein members may participate in the MAPK signaling pathway,which can be induced in response to neuronal injury (Raivich et al., 2004). These genes were also upregulated at every time point and showed higher degrees in our network analysis,which is consistent with previous studies. Additionally,ATF3 can regulate two aspects of the neutrophil response:inhibition of neutrophil chemokine production and promotion of neutrophil chemotaxis (Boespflug et al., 2014).Furthermore, ATF3 can regulate the canonical transforming growth factor-β signaling pathway in systemic sclerosis and might be a potential target for therapy (Mallano et al., 2016).However, its function in the pathogenesis of SCI has not been fully investigated (Seijffers et al., 2007). Tsujino et al.(2000) suggested that ATF3 connects with SOCS3, which is induced in neurons after SCI. ATF3 has also been proposed to be a potent marker of nerve injury and a novel marker for regeneration (Lindå et al., 2011). STAT3 is an important transcription factor during SCI and also a potential target for therapy (Herrmann et al., 2008).
More or less inevitably, patients with traumatic SCI suffer from locomotor deficits throughout their lives. Currently,no pharmacological or biological therapies have proven to be clinically effective. Moreover, collecting spinal cord samples from SCI patients or administering experimental treatments is not possible. To date, scientific investigation of SCI pathology and therapies have depended mostly on animal models of SCI (Kwon et al., 2010). Therefore, animal models provide promising hints regarding effective therapies and the mechanisms underlying SCI. In this study, our results were obtained at multiple time points, with biological repetitions at each time point. Potential genes related to SCI were screened using bioinformatic methods. Therefore, changes in gene expression after SCI were analyzed from multiple levels. Nonetheless, limitations of microarray analyses should be considered. First, we focused on tissue at the injury site, not one specific cell type. Therefore, different cells types will have contributed to RNA expression profiling as a whole, yet may play distinct functions. Targeting specific cells of interest for thorough analyses may yield more valuable results (Greenhalgh and David, 2014; Sofroniew, 2015).Nonetheless, clarification and comprehensive understanding of these molecular events are indispensable at a systemic level. Additionally, the dataset was retrieved from the existent Gene Expression Omnibus Database, and only moderate damage was introduced in our experimental approach.If more degrees of damage and injury sites were analyzed,again the results and conclusions may be more meaningful. Thus, further relevant studies are needed for validation and enhancement of practical significance at various levels,including animal models and cellular experiments. Despite these limitations, our results may be helpful for clarifying the pathological reaction and exploring new therapeutic approaches for SCI.
Taken together, gene expression profiling was noticeably altered at different time points/stages following SCI. The most remarkably upregulated DEGs were found to be associated with inflammation, including transcription factors such as ATF3. These essential genes can be considered as candidate targets for treatment of SCI. Further experiments,including functional studies, are necessary to integrate various types of data and reveal the exact underlying mechanisms in animal models before any clinical use.
Author contributions:Study conception and design: LG and JJL; literature search and statistical analysis: LG, JL and YFH; data acquisition and analysis: LG, JL, YFH and DJH; manuscript writing: LG and JL;manuscript editing: JJL; manuscript reviewing: DJH and JJL; guarantor:JJL. All authors approved the final version of the paper.
Conflicts of interest:None declared.
Financial support:This study was supported by the Natural Science Foundation of Shaanxi Province of China, No. 2018JQ8029 (to LG). The conception, design, execution, and analysis of experiments, as well as the preparation of and decision to publish this manuscript, were made independent of any funding organization.
Copyright license agreement:The Copyright License Agreement has been signed by all authors before publication.
Data sharing statement:Datasets analyzed during the current study are available from the Gene Expression Omnibus (GEO) DataSets in the National Center for Biotechnology Information (NBCI) Database (http://www.ncbi.nlm.nih.gov/gds/).
Plagiarism check:Checked twice by iThenticate.
Peer review:Externally peer reviewed.
Open access statement:This is an open access journal, and articles are distributed under the terms of the Creative Commons Attribution-Non-Commercial-ShareAlike 4.0 License, which allows others to remix, tweak,and build upon the work non-commercially, as long as appropriate credit is given and the new creations are licensed under the identical terms.
Open peer reviewers:He Huang, Central South University, China;Shyam Gajavelli, University of Miami, USA; Mitsuhiro Enomoto, Tokyo Medical and Dental University, Japan.
Additional files:
Additional Figure 1:Quality control of the CEL files in GSE5296 dataset based on R/Bioconductor program.
Additional Table 1:Differentially expressed genes with consistent directions of variation at each time point after T8 SCI.
Additional Table 2:The 3 KEGG pathway terms with the highest changes in enrichment scores at each SCI sub-group.
Additional Table 3:The 3 GO terms with the highest changes in enrichment scores at each SCI sub-group.
Additional file 1:Open peer review reports 1-3.

- 中国神经再生研究(英文版)的其它文章
- Transcriptional dysregulation in neurodegenerative diseases: who tipped the balance of Yin Yang 1 in the brain?
- Redistribution of nerve strain enables end-to-end repair under tension without inhibiting nerve regeneration
- Choroid plexus tumor necrosis factor receptor 1:a new neuroin flammatory piece of the complex Alzheimer's disease puzzle
- Magnesium: pathophysiological mechanisms and potential therapeutic roles in intracerebral hemorrhage
- Bridging larger gaps in peripheral nerves using neural prosthetics and physical therapeutic agents
- Exogenous neural stem cell transplantation for cerebral ischemia