SuperSAGE digital expression analysis of differential growth rate in a European sea bass population
Bruno Louro ,Rute S.T.Mrtins,Ptrici I.S.Pinto ,Richrd Reinhrdt,Dirk-Jn de Koning ,Adelino V.M.Cnrio ,Deorh M.Power
a CCMAR-Centre of Marine Sciences,University of Algarve,Campus de Gambelas,Faro 8005-139,Portugal
b Max Planck Genome Centre,Carl-von-Linnˊe-Weg 10,K¨oln 50829,Germany
c The Roslin Institute and R(D)SVS,University of Edinburgh,Easter Bush,Midlothian EH25 9RG,Scotland UK
d Department of Animal Breeding and Genetics,Swedish University of Agricultural Sciences,Box 7023,Uppsala 750 07,Sweden
Keywords:European sea bass Specific growth rate Gene expression SuperSAGE Pathways
A B S T R A C T One of the goals of the aquaculture industry is to understand and control growth associated traits through selective breeding.In the present study the molecular basis of growth heterogeneity in the European sea bass(Dicentrarchus labrax)was addressed.To establish growth heterogeneity in a group of hatchery bred sea bass individuals were tagged and their specific growth rates(SGR)determined at monthly intervals.Gene expression in the brain,liver and white muscle from fish with the most divergent sustained SGR(6 individuals of the first and last quartile)was assessed using SuperSAGE(Serial Analysis Gene Expression)combined with next generation SOLiD4 sequencing.A total of approx.11 million edited tags(26 bp),on average 2 million tags per SAGE library,that represented 47.071 unique transcripts were identified.Comparison of transcripts in fish with high and low SGR yielded 344,698 and 601 differently expressed tags(0.01%false discovery rate and 4-fold change)in brain,liver and muscle,respectively.The tags were mapped onto the sea bass genome and approximately one third of the tags could be assigned to annotated genes.Pathway enrichment analysis revealed in liver,muscle and brain intricate gene expression changes in endocrine regulatory pathways involved in growth,metabolic and the stress axis,underlying divergent SGR in sea bass.
1.Introduction
The aquaculture industry has the same general aspirations as terrestrial production systems,which is to enhance economically important traits(Canario et al,2008).However,the advantages of selective breeding programs have been exploited for only relatively few aquaculture species and an optimistic estimate suggests that probably only 10%of aquaculture production is based on genetically improved stocks(Gjedrem&Baranski,2009,p.221).The salmonids,Atlantic salmon(Salmo salar)and rainbow trout(Oncorhynchus mykiss),are the main products of Northern European aquaculture and much of the production is based on genetically improved stocks(Gjedrem&Baranski,2009,p.221).In relatively few generations selection for improved growth yielded a 10%-14%size increase in Atlantic salmon(Gjøen&Bentsen,1997)and 8%-13%in rainbow trout(Kause et al,2005).However,with the more recent adoption of intensive aquaculture production systems,Southern European species lack large-scale formal selection programs to improve economically important traits.This is the case of the European sea bass(Dicentrarchus labrax)with a production estimated at 126 thousand tonnes and a market value of 500 million Euros(FAO,2012).This species has a molecular resource rich status and is a prime candidate for the development of a genetic selection program using molecular genetics(Canario et al,2008).The use of molecular approaches in sea bass has led in a relatively short space of time to the establishment of hundreds of microsatellite markers and to the production of several linkage maps(Chistiakov et al,2005,2008)and candidate quantitative trait loci(QTL)(Chatziplis et al,2007;Louro et al,2016;Massault et al,2010).Additional resources include a >12×coverage BAC-library(Whitaker,McAndrew,&Taggart,2006),a radiation hybrid map(Guyon et al,2010),over 30,000 expressed sequence tags(ESTs)(Louro et al,2010),an oligonucleotide microarray(Ferraresso et al,2010)and a well assembled and annotated genome(Tine et al,2014).
While QTL mapping and a sequenced genome of an organism are important steps towards molecular assisted selection,still few causative genes behind the phenotype of interest have been identified.Even in terrestrial farm animals,few causative genes of QTLs have been identified(Mackay,Stone,&Ayroles,2009;Rothschild&Plastow,2008;Rothschild,Hu,&Jiang,2007).Recent approaches to speed up identification of the genes associated with traits of interest have deployed a combination of QTL mapping and high throughput transcriptome analysis,also known as Systems Genomics or Genetical Genomics,when gene expression is considered the trait rather than the physical phenotype itself(Hubner et al,2005;Schadt,Monks,&Friend,2003;Wayne&McIntyre,2002).Other strategies to define new QTL or loci for complex traits have used QTL analysis coupled to gene transcriptome analysis of individuals with distinct phenotype subtypes in a segregating population(Blum et al,2010;Schadt et al.,2003).
In the present study the absence of individuals selected for improved growth phenotypes or with a known pedigree with a characterised QTL meant that genetical genomics was not feasible.The aim of the present study was therefore to identify differential gene expression profiles between high and low SGR fishes,i.e.that underlie divergent extreme growth phenotypes in the European sea bass.Furthermore,the existence of shared and tissue specific transcripts were analysed in three tissues selected for transcriptome analysis.The tissues were selected based on their relevance to the growth phenotype and included the liver(related to metabolism),muscle(body mass growth)and the brain(regulation).SuperSAGE(Serial Analysis Gene Expression)(Matsumura et al,2010)was used to detect differential transcript expression between chronically slow and fast growers and cross referenced with the genes previously identified in candidate growth QTL identified in an independent mapping population(Massault et al,2010).Pathway analysis of differentially expressed transcripts established the regulatory pathways most affected and gave insight into the tissue specific changes underlying divergent specific growth rate in sea bass.
2.Materials and methods
2.1.Growth trial
European sea bass juveniles obtained from a commercial fish farm(Viveiros Vila Nova,Vila Nova de Milfontes,Portugal)were grown at Ramalhete Marine station(University of Algarve,Faro,Portugal)in 1000 L tanks with running seawater at a density<5 kg/m3,ambient temperature(16-22°C)and natural photoperiod(from February to June,Latitude 37°).For the 70 days growth trial,two groups of 9 months old fish were created(n=75),one from below the first weight quartile(Q1=40 g)and the other from above the third weight quartile(Q3=53 g).The fish had no visible external abnormalities or lesions and were pit tagged before being randomly distributed between two cylindroconical tanks(75 L).The tanks were in an open circuit and received a continuous flow-through of aerated sea water at 21-22°C and were exposed to the natural photoperiod for June-September.Fish were fed to satiation with a continuous feeding regime and verifying periodically during the day that all food was consumed.
At monthly intervals fish were lightly anaesthetised(0.01%2-phenoxyethanol)and weight and length measured.For final phenotyping and tissue collection all fish were sacrificed 24 h after last meal with an overdose of 2-phenoxyethanol.Whole brain(minus the pituitary gland),liver and white muscle were rapidly collected and immediately frozen in liquid nitrogen and stored at-80°C until use.Specific growth rate(SGR)was calculated for each individual as

where ln(Wf)isthe naturallogarithm ofthe finalweight(g),ln(Wi)isthe natural logarithm of the initial weight(g),and t is the interval between measurements(days).The six fish with the most divergent SGR(i.e.persistent high or low growth rate)were selected for SAGE analysis.
2.2.RNA extraction
Total RNA was extracted from whole brain,liver and white muscle using a total RNA purification kit and a Maxwell 16 MDXi robot(Promega,Madrid,Spain)following the recommended procedure.The concentration,quantity and integrity of total RNA in 300μL of DEPC treated water were evaluated using a NanoDrop 1000 Spectrophotometer(Thermo Fisher Scientific,Waltham,MA,USA)and agarose(0.8%)gel electrophoresis.Pools of total RNA(10μg)of each tissue were generated from the 6 selected high and low SGR individuals and treated with DNase using a Turbo DNA-free kit(Ambion,Huntington,UK)prior to SuperSAGE library production.
2.3.SuperSAGE library preparation
SuperSAGE was performed using a modification of the method described in Matsumura et al.(Matsumura et al,2010),the tag flanking adapter and primer sequences were adjusted to make the method compatible with the SOLiD4 sequencing system(Life Technologies,Carlsbad,USA)(Matsumura et al.,2012).Adapter-A was common to all libraries and was obtained by annealing to the isolated RNA the two oligonucleotides 5′-TTCCTCATTCTCTCAAGCAGAAGACGGCATACGAAATG AT ACGGCGACCACCGACAGGTCTAACGATGTACGCAGCAGCATG-3′and 5′-CTGCTGCGTACATCGTTAGACCTGTCGGTGGTCGCCGTATCATTTCGT ATGCCGTCTTCTGCTTGAGAGAATGAGGAA-amino-3'(Metabion,Martinsried,Germany).Adapter-B was indexed with library specific 6bp barcodes(XXXXXX)in the two oligonucleotides 5′-CCACTACGCCTCC GCTTTCCTCTCTATGGGCAGTCGGTGATXXXXXX-3′and 3′-NNXXXXXXA TCACCGACTGCCCATAGAGAGGAAAGCGGAGGCGTAGTG GTT-amino-5'(Metabion).
SuperSAGE libraries for brain,liver and white muscle of high(H)and low(L)SGR fish were produced from double stranded cDNA(ds cDNA)synthesised using total RNA as the template,random hexamers and biotinylated oligo-dT(Metabion).This was followed by of ds cDNA digestion with Nla III(New England Biolabs,Ipswich,MA,USA)and capture of the biotynylated fragments with streptavidin-coated magnetic beads.Adapter-A was ligated to the biotinylated ds cDNA biotinylated fragments and EcoP15I(New England Biolabs)restriction digestion performed.Adapter-B was ligated to the produced adapter-A-ds cDNA tags.The construct was then amplified with phusion high- fidelity polymerase(New England Biolabs)and purified using an 8%non-denaturing polyacrylamide gel(Matsumura et al.,2012).
2.4.SOLiD4 sequencing,editing and quality control
SuperSAGE library quality was assessed using an Agilent 2100 Bioanalyzer(Agilent Technologies,Palo Alto,CA,USA).Emulsion PCR,slide preparation and sequencing runs were performed following the manufacturer's protocol(Applied Biosystems SOLiD Library Preparation Protocol,Life Technologies)and using the sequencing primer supplied 5′-CCACTACGCCTCCGCTTTCCTCTCTATGGG CAGTCGGTGAT-3'.
Primary data analysis including editing the 50 bp raw colour space sequences,quality control and library assignment.The sequencer output colour space fasta.csfasta and.qual files were converted to an integrated colour space Phred+33 Sanger fastq file using bfast 0.6.4e program(Homer,Merriman,&Nelson,2009)script “solid2fastq”.The pooled sequences were assigned to libraries and subsequently the 6 base pair barcode was removed with the perl script“fastx_barcode_splitter.pl”,and“fastx_trimmer”script available in the FASTX-Toolkit(http://hannonlab.cshl.edu/fastx_toolkit/).Summary statistics of the sequence files for quality control was obtained using FastQC(http://www.bioinformatics.babraham.ac.uk/projects/fastqc/).Quality screening at all steps of sequence editing was performed using FASTX-Toolkit scripts“fastx_-quality_stats”,“fasta_clipping_histogram.pl”and “fastq_quality_boxplot_-graph.sh”.A second positive quality control was based on the identification of the 3′-adaptor(adaptor A)sequence added during SuperSAGE library construction.Sequences that had a modified or absent 3′-adaptor sequence were eliminated from the analysis.Adaptor sequences were trimmed using fastx_trimmer in the FASTX-Toolkit scripts.Taking advantage of the double encoded nature of colour space sequences,the positive identification of Adaptor A at the end of the sequence was used for quality control instead of the application cut off standard quality threshold of 20,and resulted in a higher yield of extracted tags with high confidence.
2.5.SuperSAGE tags counts and mapping
Tag counts and genomic mapping was performed with the command line version of solid.sage.command.v109.pl program(He,Liqun,Life Technologies,personal communication).The European sea bass draft genome sequence(ENA submission PRJEB5099)was edited to RefSeq fasta formatand used to map the tag sequence data.The generated output mapping file for each library consisted of a list of tags,their frequency and their genomic coordinates,that were all concatenated into a matrix file.
2.6.Statistical analysis of differentially expressed tags
Differentially expressed tags in liver,brain and muscle from fast and slow growing European sea bass were identified by pairwise frequency comparisons(Fisher's exact test),followed by a false discovery rate test(FDR,proportion of false positives when a particular test is called significant).This was performed using the tag count matrix retrieved from the tag extraction and count steps as the input file for an in house developed R script(R v2.8.1)(supplied on request)thattested for the null hypothesis of independence of specific tags and library counts using an in-built Fisher's exact test.The P-values obtained from the Fisher's exact test were automatically used for q-value estimation for FDR using the available “q value”package(http://cran.r-project.org/web/packages/qvalue/index.html)(Storey&Tibshirani,2003).No significance level(P-value)or minimum tag count cut-off was defined in the Fisher's exact test for differential expression in pairwise comparisons.A minimum tag count of five for at least one library was used as the cut-off to select tags for expression analysis.The cut-off for significance was set after evaluation of FDR results at a q-value<1 E-5(0.01%FDR)and log2threshold of 2 for comparisons between library tag counts derived from high and low SGR fish.
2.7.SuperSAGE tags functional annotation
Mapped tags were annotated using their positional coordinates against the European sea bass GFF3 genomic gene annotation file via the“Operate on Genomic Intervals”tool available in the Galaxy server(Goecks et al,2010)(https://main.g2.bx.psu.edu/).Significant tags from each library were analysed using the STRING v.9.0 protein interaction database(Szklarczyk et al,2011)(http://string-db.org).The interactions included direct(physical)and indirect(functional)associations derived from three sources:high-throughput experiments,co-expression,and previous knowledge.The interaction score for differential tags was established at a high confidence level(>0.4).Biological process and molecular function Gene Ontology(GO)enrichment analysis were also carried out using STRING v.9.0.
2.8.Ingenuity pathway analysis
A dataset file containing the gene identifiers,log2(B/S)and q-values was the input file for Ingenuity Pathway Analysis(IPA)(Ingenuity System Inc,USA)[http://www.ingenuity.com/].The IPA′′Core Analysis”function was used to interpret the experiment results in the context of biological function,gene networks and canonical pathways.Both log2(ratio)and q-values were defined as value parameters for the analysis.Canonical pathways and biological functions derived from IPA analysis were sorted by significance using a right-tailed Fisher's Exact test P-value.The networks generated were also ordered by significance,using the score obtained with a modified Fisher Exact test with associated top biological functions.
3.Results
3.1.Growth experiment
Specific growth rates averaged 0.8%and 1.3%(min 0.70%-max 1.38%)for L and H SGR groups,respectively,during the first period( first 9 months)and 0.9%and 1.3%(min 0.67%-max 1.31%)during the second period(70 days growth trial).SGR was more homogenous in the selected high SGR than in the low SGR fish(supplementary file 1, figure S1).
3.2.Editing and quality control of the sequencing output
A total of 61,003,920 raw colour space reads was obtained and 39,805,391 reads were assigned to specific SuperSAGE libraries(supplementary file 2,table S1).Reads assigned to brain and liver libraries were similar and were approximately 6 million and 4 million,respectively.For the muscle libraries,group L had ca.6 million reads and group H ca.13 million reads.After quality editing and tag extraction the reads assigned to specific tissue libraries were more evenly spread between 1.2 and 3 million(supplementary file 2,table S1).
3.3.Differential gene expression,annotation and GO enrichment
Comparison of tag frequency from the L and H groups yielded 344,698 and 601 differently expressed in brain,liver and muscle,respectively(Table 1).Approximately 80%of the tags were assigned to genomic loci on the draft genome of the European sea bass(Table S1).In total 47,071 tag loci corresponding to unique transcripts were mapped and gene annotation retrieved for 15,584 tag loci,which corresponded to 9.066 genes.The differentially expressed tags between high SGR(B)and low SGR(S)corresponded to 322 genes in brain,683 in liver and 596 in muscle,respectively.The greater number of tags identified relative to genes was the result of some tags assigning to different loci of the same gene,that presumably represent alternative transcripts and/or possible regulatory RNAs(Table 1)(detailed annotation and expression data in Supplementary File 2).
The top 10 gene ontology(GO)terms for biological process and molecular function characteristic of each tissue are listed in Tables 2 and 3,respectively.Although these included well known specific functions for each tissue,analysis of differentially expressed tags failed to produce significant enrichment of any specific GO terms presumably due to the relatively low number in the significant tags population for the stringent fold change threshold used.
Interestingly,8%of the differentially expressed annotated transcripts between H and L were located within previously identified growth related QTLs(Massault et al,2010)(Table 4).Thirty- five genes located within previously identified growth related QTLs with an identified physiological role in growth(Table 5)and may be candidates to explain the divergent growth phenotypes.Although these differentially expressed transcripts passed the FDR they did not pass the very stringent expression cut-off threshold of Log2(B/S,minimum of 4-fold change inexpression between fish with high or low SGR).As examples,insulin-like growth factor binding protein 5(IGFBP5)maps to a LG15 growth QTL in European sea bass and is differentially expressed in the H and L groups in brain,liver and muscle.IGFBP5 in the H group had a lower expression in the brain (-0.66-fold)relative to the liver(2-fold)and muscle(1.65-fold).Insulin-like growth factor 2(IGF2)falls within a LG6 growth QTL and had a lower expression in the liver of H fish(-1.75-fold).

Table 1 Significant tag counts and descriptive statistics of the annotation.
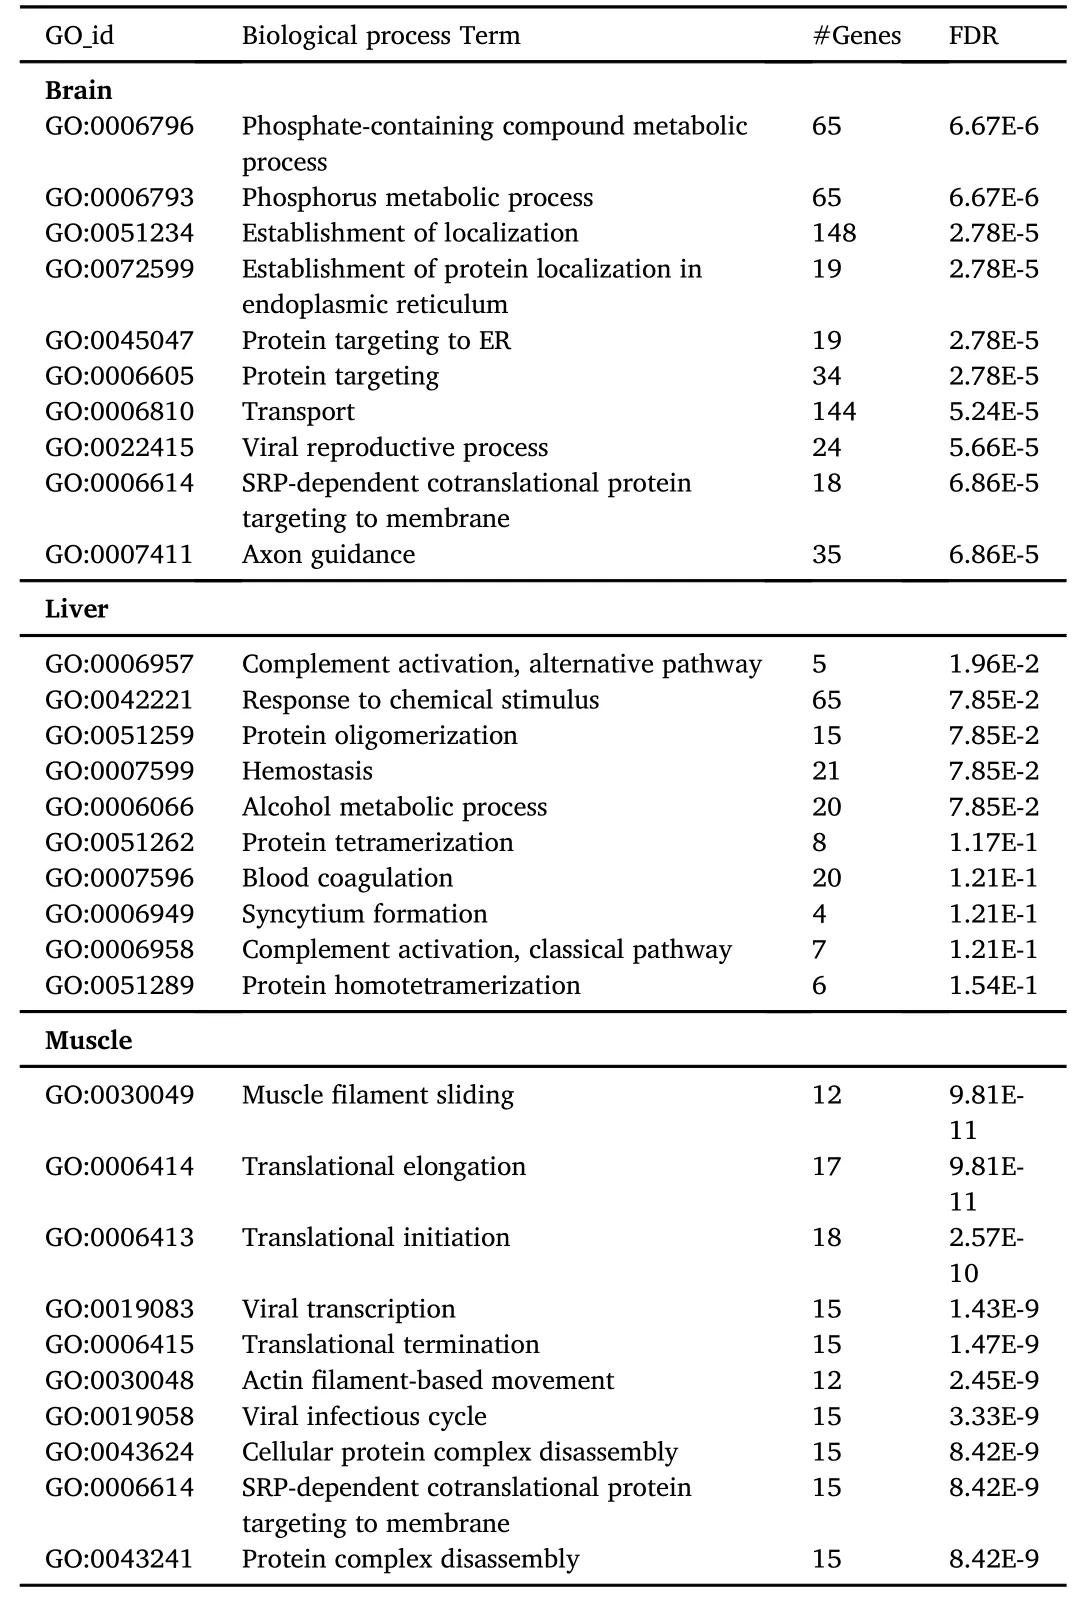
Table 2 Top 10 gene ontology(GO)biological process enrichment.Enriched GO terms for the brain,liver and muscle identified transcripts are presented as GO term number(GO_id),number of genes(#Genes),and false discovery rate(FDR)values.
3.4.Analysis of string protein networks
The largest interacting networks inferred from the differentially expressed tags were ribosomal proteins(Fig.1)which interact(bind)to generate the functional ribosome.For example,the ribosomal binding protein complex was the largest transcript cluster found in the liver and albeit a smaller cluster was also enriched in brain and muscle.Overall,with the exception of the ribosomal clusters relatively few significant groups of interacting genes(protein products)were identified in the differentially expressed genes.Some common networks were found between muscle and liver that were linked to RNA transcription,for example polymerase RNAII(POLR2A),serine/arginine rich splicing factor 1(SRSF1),pre-mRNA processing factor 8 homolog(PRPF8).In muscle a small group of non-ribosomal interacting products were identified,namely myosin heavy chain 3(MYH3),troponin T(TNNT),heatshock protein 90(HSP90AA1),peptidyl-prolyl cis-trans isomerase(cyclophylin A;PPIA).In the brain a network of energy producing enzymes(ENO1,ALDOB,GAPDHS)was prominent.
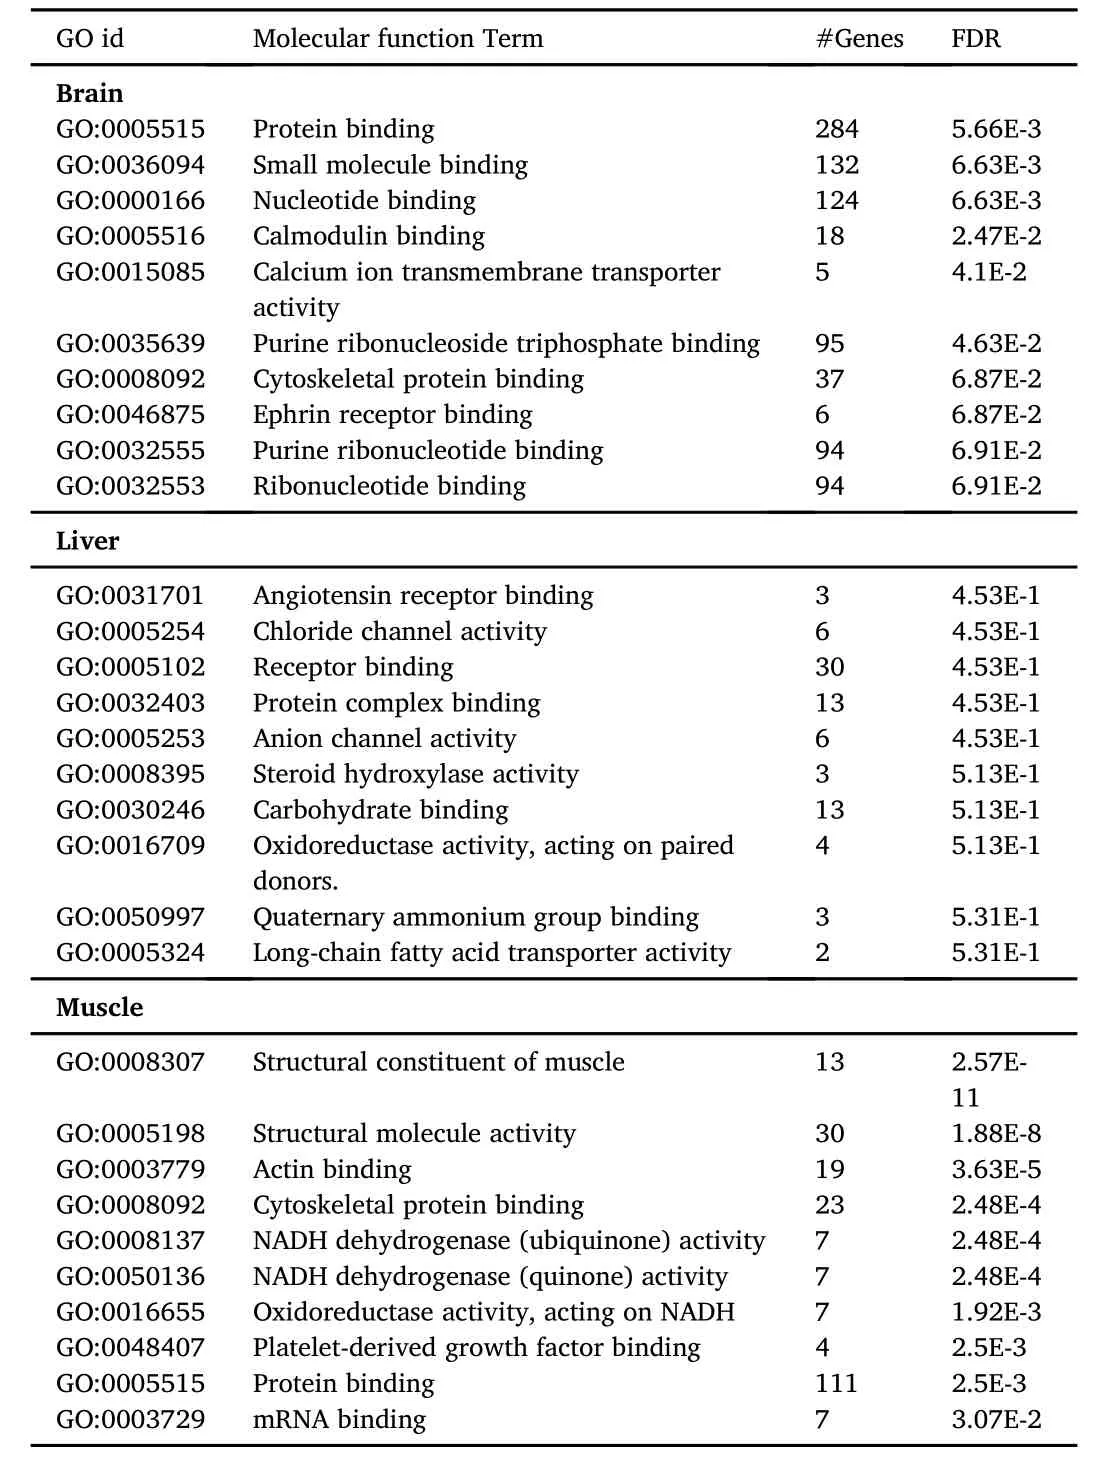
Table 3 Top 10 gene ontology(GO)-molecular function enrichment.Enriched GO terms for the transcripts identified in the brain,liver and muscle are presented as GO term number(GO_id),number of genes(#Genes),and false discovery rate(FDR)values.
3.5.Pathway analysis
Significant canonical pathways identified by IPA in the brain were largely neurone specific(e.g.synaptic and gonadotropin releasing hormone signalling),in the liver they included acute phase response and synaptic response,and in muscle calcium and androgen signalling(Fig.2).
Comparison of the canonical pathways of differentially expressed genes between tissues suggested common tissue wide biological regulation of some processes occurred in the H and L fish.As an example CREB signalling in the neurons canonical pathway was among the top five most significantly represented canonical pathways and was commonly affected in all tissues analysed(Fig.3).
4.Discussion
In the present study we hypothesised that there would be differentiation of transcript expression that underpin and are responsible for the trait of chronic fast and slow growth in non-selected sea bass.We further hypothesised that some of these transcripts may have a quantitative effect on growth traits.Cross-referencing the gene annotation of the differentially expressed genes in the fast and slow growing sea bass withthe genes populating previously identified growth QTL(Louro et al,2016;Massault et al,2010),it was possible to identify strong candidate genes for future studies.The biological role of those identified candidate genes listed in Table 4 and Table 5 is discussed further below.
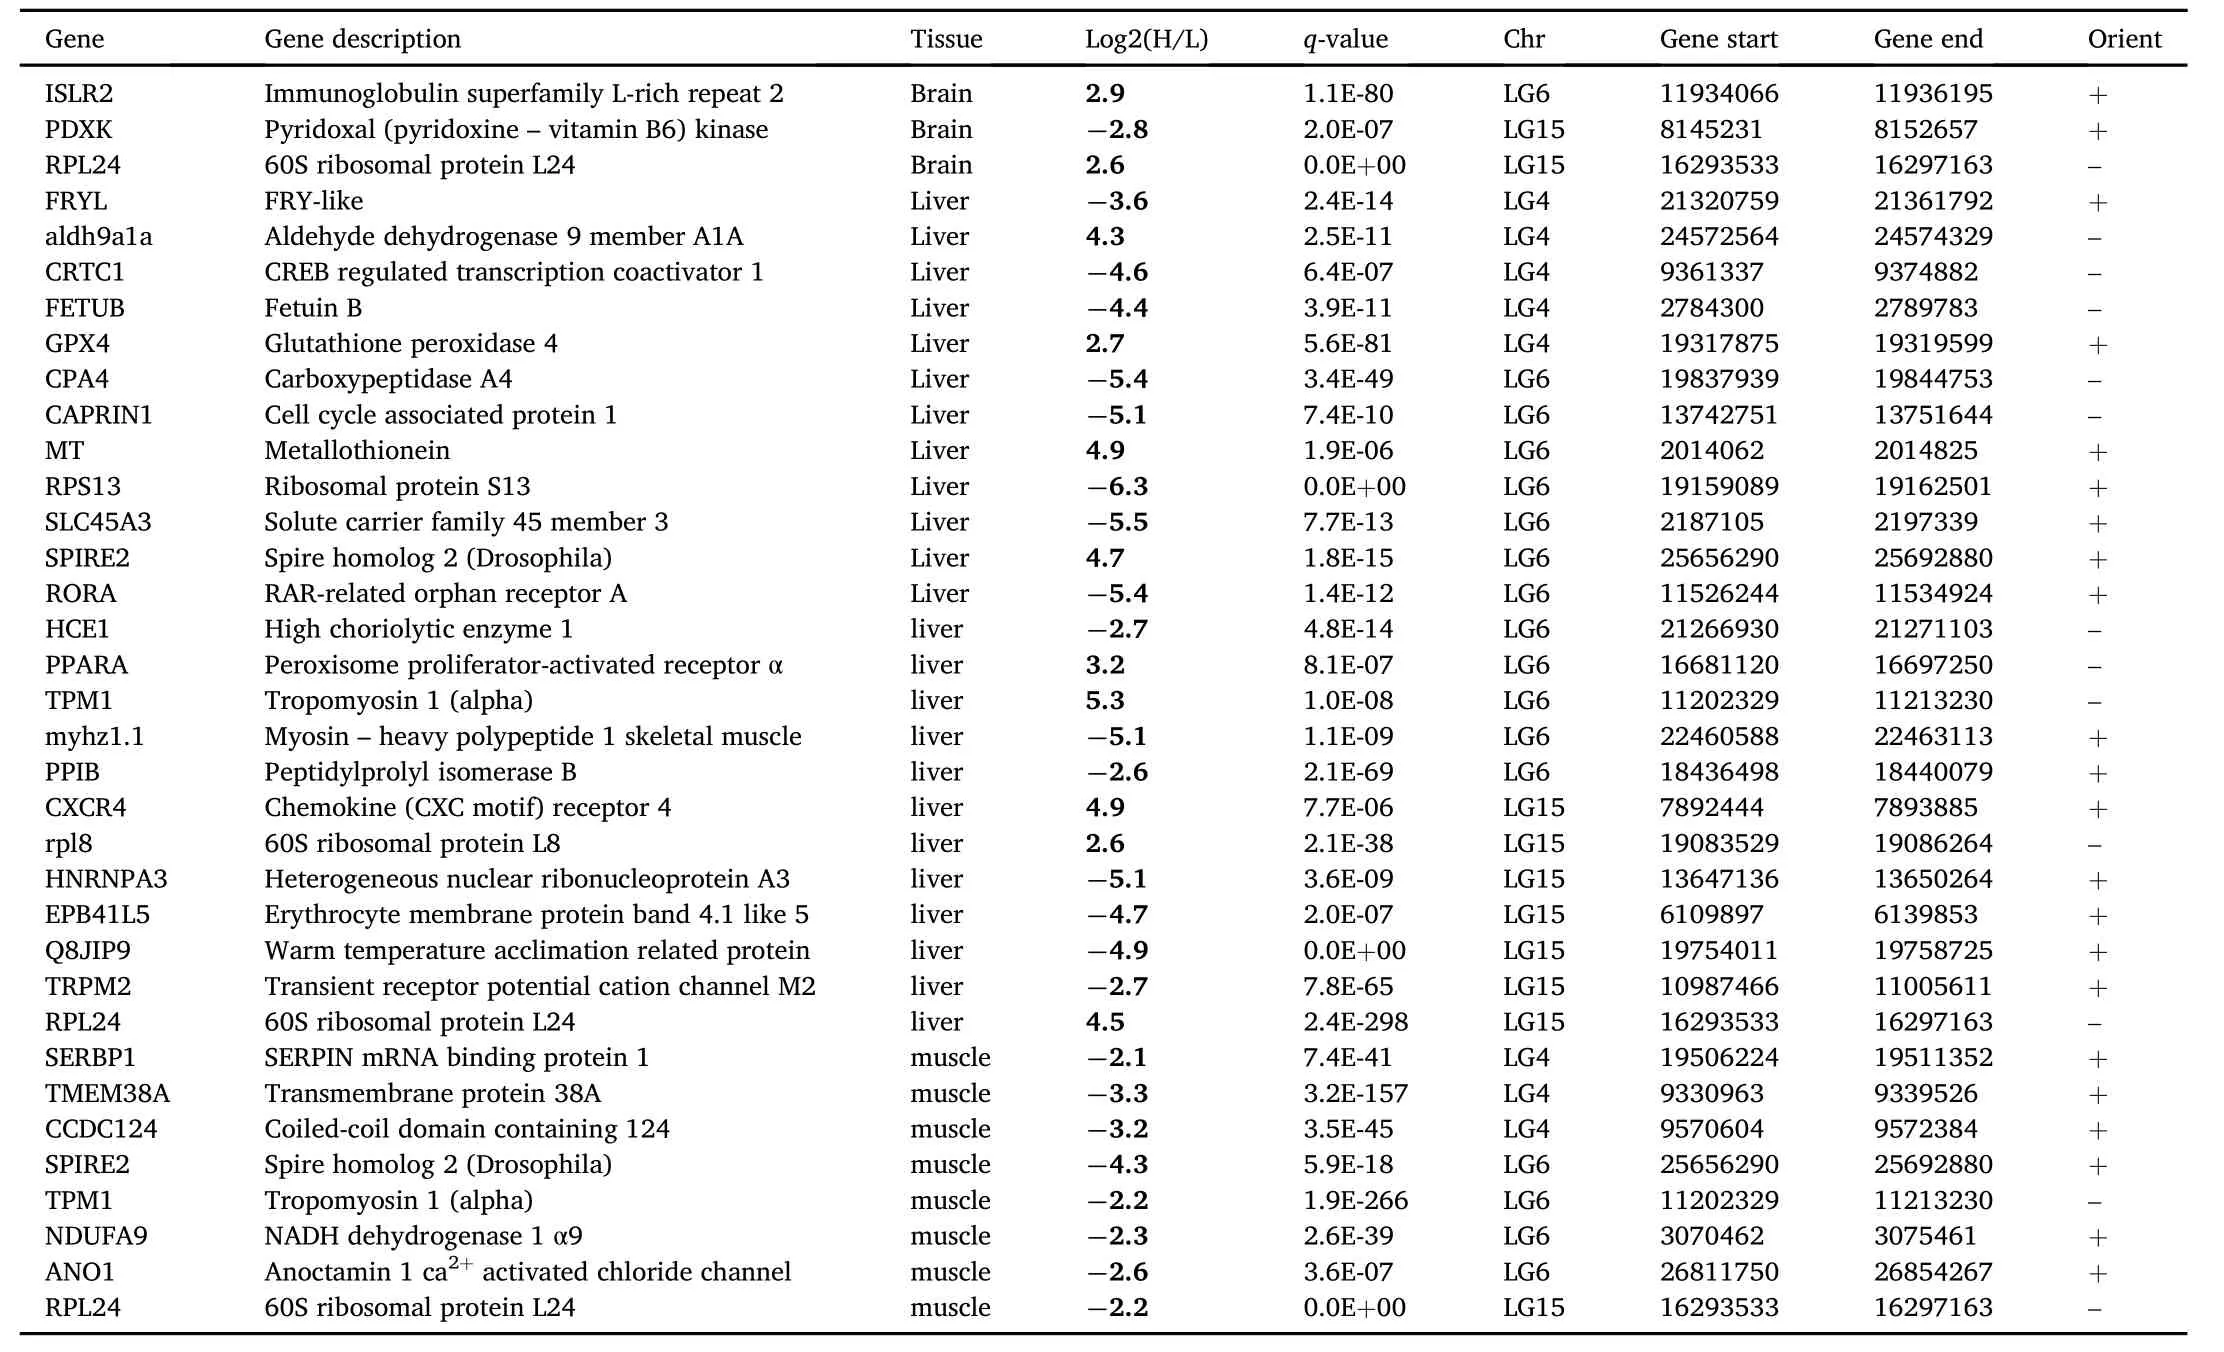
Table 4 Significantly different expressed genes with genomic position within the European sea bass LG4,LG6 and LG15 growth related QTL confidence intervals.The significance cut-off was set at a q-value<1 E-5 and log2 ratio(H/L)threshold of 2 for pairwise comparisons of all tissues libraries.

Table 5 Candidate genes with genomic position within the European sea bass LG4,LG6 and LG15 growth related QTL confidence intervals.Significance cut-off was set at just for q-value<1 E-5 for all tissues libraries pairwise comparisons.
The SOLID4 SuperSAGE tag architecture required design and programming of a new editing and quality control pipeline integrating as a positive control the sequence of the forward and reverse tag,which increased the yield and confidence of tag extraction.In total it was possible to extract 10,732,697 SuperSAGE tags which represented 27%of the totalraw colourspace reads in the initialraw data.Relatively fewer differentially expressed transcripts were identified in the brain compared to the liver and white muscle.For differential tag/transcript expression a very stringent cut-off of 0.001%false discovery rate,and a log2 ratio(B/S)threshold of 2 was chosen to adjust for individual variation resulting from sequencing of SuperSAGE libraries constructed with pools of RNA obtained from several individuals.At the time of the analysis,the incomplete nature of the gene annotation of the sea bass genome meant that a relatively small proportion of allthe tags generated were annotated(15%-33%).Nonetheless,comparison of the differentially expressed and annotated tags with the genes present in the previously identified growth QTL revealed considerable overlap.The most noticeable gene located within the identified growth related QTLs was IGF2,which has a known regulatory mutation that causes a major QTL effect on muscle growth in the pig(Van Laere et al,2003).IGF2 is member of the insulin family of polypeptide growth factors,it is a key regulator of normal foetal development and growth(Cornish et al,2007;Harris&Westwood,2012)and related to intrauterine growth restriction diseases(Qiu et al,2005).IGF2 is also known to be an imprinted gene with paternal inherited allele expression in both eutherians and marsupials,but reported bi-allelic expression in live bearing fishes(Lawton et al,2005).In the current study although the expression variation did not pass the Log2(H/L)expression threshold,it was more highly expressed in the L SGR group,and this reinforces the generally held idea that this hormone is less important in juvenile/adult growth regulation(Pierce et al,2010a).
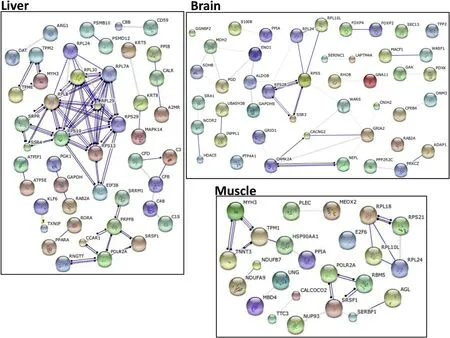
Fig.1.STRING gene network inferences viewed in “actions view”in liver,brain and muscle.
There was no evidence that IGF1,the principal somatomedin acting as a growth factor in adult stages was differentially expressed between slow and fast growing fish(Picha et al.,2008).Surprisingly,hepatic IGF1 tags were of low abundance and gave a non-conclusive high FDR on comparison between the fast and slow growing fish.An explanation for the low abundance of IGF1 tags may be related to the relatively high abundance of insulin-like growth factor binding proteins(IGFBP)in all the tissues analysed.IGFBPs are also located within previously identified growth related QTLs in sea bass(Louro et al,2016)namely,LG4,LG6 and LG15 and differential expression passed the confidence interval and achieved FDR significance.The IGFBP are multifunctional integrators which bind IGFs and in this way modulate their action and in fluence diverse physiological functions(Kelley et al,2002).In the liver IGFBP 5 and 2 were identified and an SNP(single nucleotide polymorphism)in the latter binding protein has been associated with type 2 diabetes and triglyceride levels in humans(Harvard et al,2007).In sea bass muscle IGFBP 5 and 3 were also present and in pigs an SNP in the former gene was associated with meat quality(Wang et al,2010).Furthermore,the divergent expression of IGFBP5 in brain relative to liver and muscle in the present study,may indicate that QTLs can be tissue specific as a consequence of divergent gene regulatory processes such a gene methylation.
Pathway analysis(IPA)allowed the characterization and identification of the canonical pathways differentiated between L and H SGR groups.The CREB signalling in neurons canonical pathway was among the top five most significant pathways commonly affected in all three tissue comparisons between slow and fast growing fish,suggesting a linked biological regulation.The cAMP/CREB signalling pathway has been strongly implicated in cell proliferation and survival,glucose homeostasis,spermatogenesis,circadian rhythms and synaptic plasticity that is associated with a variety of complex forms of memory including spatial and social learning(Mayr&Montminy,2001;Shaywitz&Greenberg,1999;Wen,Sakamoto,&Miller,2010).It activates transcription of target genes in response to a diverse array of stimuli,including peptide hormones,growth factors,and neuronal activity,that activates a variety of protein kinases including protein kinase A(PKA),pp90 ribosomal S6 kinase(pp90RSK),and Ca2+/calmodulin-dependent protein kinases(CaMKs)(Shaywitz&Greenberg,1999).In the comparisons between transcripts in the brain from fast growing and slow growing fish the abundance of several transcripts encoding proteins of the CREB signalling pathway were markedly modified.In particular,in the H group down regulation of the iGLUR and mGLUR group II/III was evident and the PIK3,cAMP and Ca2+signalling pathways appeared to also be down-regulated.The GLUR family are involved in activity dependent,long term synaptic strength and with the exception of GLURI their transcription was down regulated along with the down-stream transcripts for the proteins they signal through,PKA and cAMP(Barria et al,1997).In contrast,transcripts encoding a number of elements of the Ras signalling pathway were up-regulated and included MEK,the extracellular kinase regulated(ERK)signalling pathway,which influences Elk a transcription factor involved in cell growth differentiation and survival(Besnard et al,2011).Recently in an elegant series of experiments ERK1/2 signalling was shown to be important for catch up growth in the zebra fish(Kamei et al,2011)and the results of the present study revealing a significant modification in this pathway in fast growing sea bass raise the possibility that it might also be at the basis of divergent growth rates in older fish.It is apparent from this short appraisal that substantial modifications have occurred at the level of the brain between fast and slow growing fish,although theirfunctionalsignificance remains to be established.
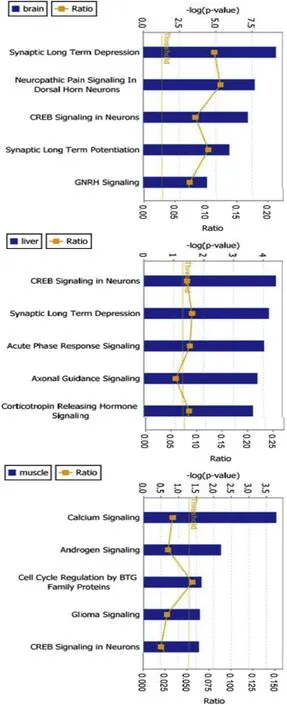
Fig.2.Top five most significantly modified canonical pathways in all three tissue comparisons.The columns represent“-log(P-value),the orange points represent the ratio of the number of genes that meet the cut-off criteria,to the number of genes that make up the pathway.
STRING analysis revealed a high representation of transcripts for ribosomal proteins and transcription factors in all tissues,which was perhaps unsurprisingly taking into consideration the abundance and constitutive character of transcription and translation.However,these transcripts are differentially expressed between fast and slow growing fish suggesting that there may be underlying differences in protein synthesis.Several endocrine pathways with anabolic actions were also differentially expressed between fast and slow growing sea bass and included elements and targets of the IGF and insulin axis.As in all vertebrates,many of the actions of GH in fish are mediated by insulin/insulin-like growth factor signalling(INS/IGF)[for review see Reinecke,2010].The modification of insulin(INS)signalling revealed by the divergent expression between fast and slow growing fish may also be a factor explaining divergent growth.INS exerts its growth promoting action via similar mechanisms to IGF(Barbieri et al,2003)and can also act by modifying IGF1 production by the liver when it synergizes with GH(Plisetskaya&Duan,1994).The identification of differential expression of INS receptors in the liver suggested modifications in tissue responsiveness at this site between fast and slow growing sea bass.Within the INS/IGF axis our results interestingly highlight the divergence in IGF2 transcript abundance,which like IGF1 is an anabolic hormone(Pierce et al,2010b),raising intriguing possibilities in relation to its cross-talk with INS receptors and its role in the sea bass with divergent growth in the present study.In the European seabass,the levels of both IGF1 and 2 mRNAs are regulated in the liver and muscle in response to fasting and refeeding protocols(Terova et al,2007),suggesting they are involved in the regulation of energy balance in this species.The results presented herein further expand a candidate function of IGF2 in the regulation of growth in this species.In channel cat fish(Ictalurus punctatus),IGF2 mRNA levels were greater in muscle(Peterson et al.,2004,2008)and liver(Peterson et al.,2004)of fast growing fish compared to slow growing fish,contrary to our results with lower IGF2 expression levels in liver of H group.Such divergence might result from the regulatory balance of the myogenic effect of IGFs from other genes,namely the relationship between IGF and IGFBP and final effect on growth is fairly well established in vertebrates(Caruso&Sheridan,2011;Fuentes et al,2011;Kamei et al,2011;Svanberg et al,1996).In fish several studies with fasting and posterior refeeding challenges in Atlantic salmon(Bower et al,2008)and fine flounder(Sa fian et al,2012)suggest IGFBP4 and IGFBP5 as positive regulators of IGF role in compensatory growth,evidencing the weight of IGBPs effect upstream the IGF system and not solely pinpointing the IGF1 major role effect in the final muscle trait.The importance of the relationship between IGFs signalling,with hormone receptors and IGFBPs in the different tissues is also highlighted in the presented candidate genes listed in Table 5,as a result of the integrative approach of gene expression,pathway analysis and cross-mapping genes with previous growth related QTLs(Louro et al,2016).In barramundi(Lates calcarifer),the IGF2 gene was also identified within a quantitative trait locus for body weight and length in LG10(Wang et al,2008).
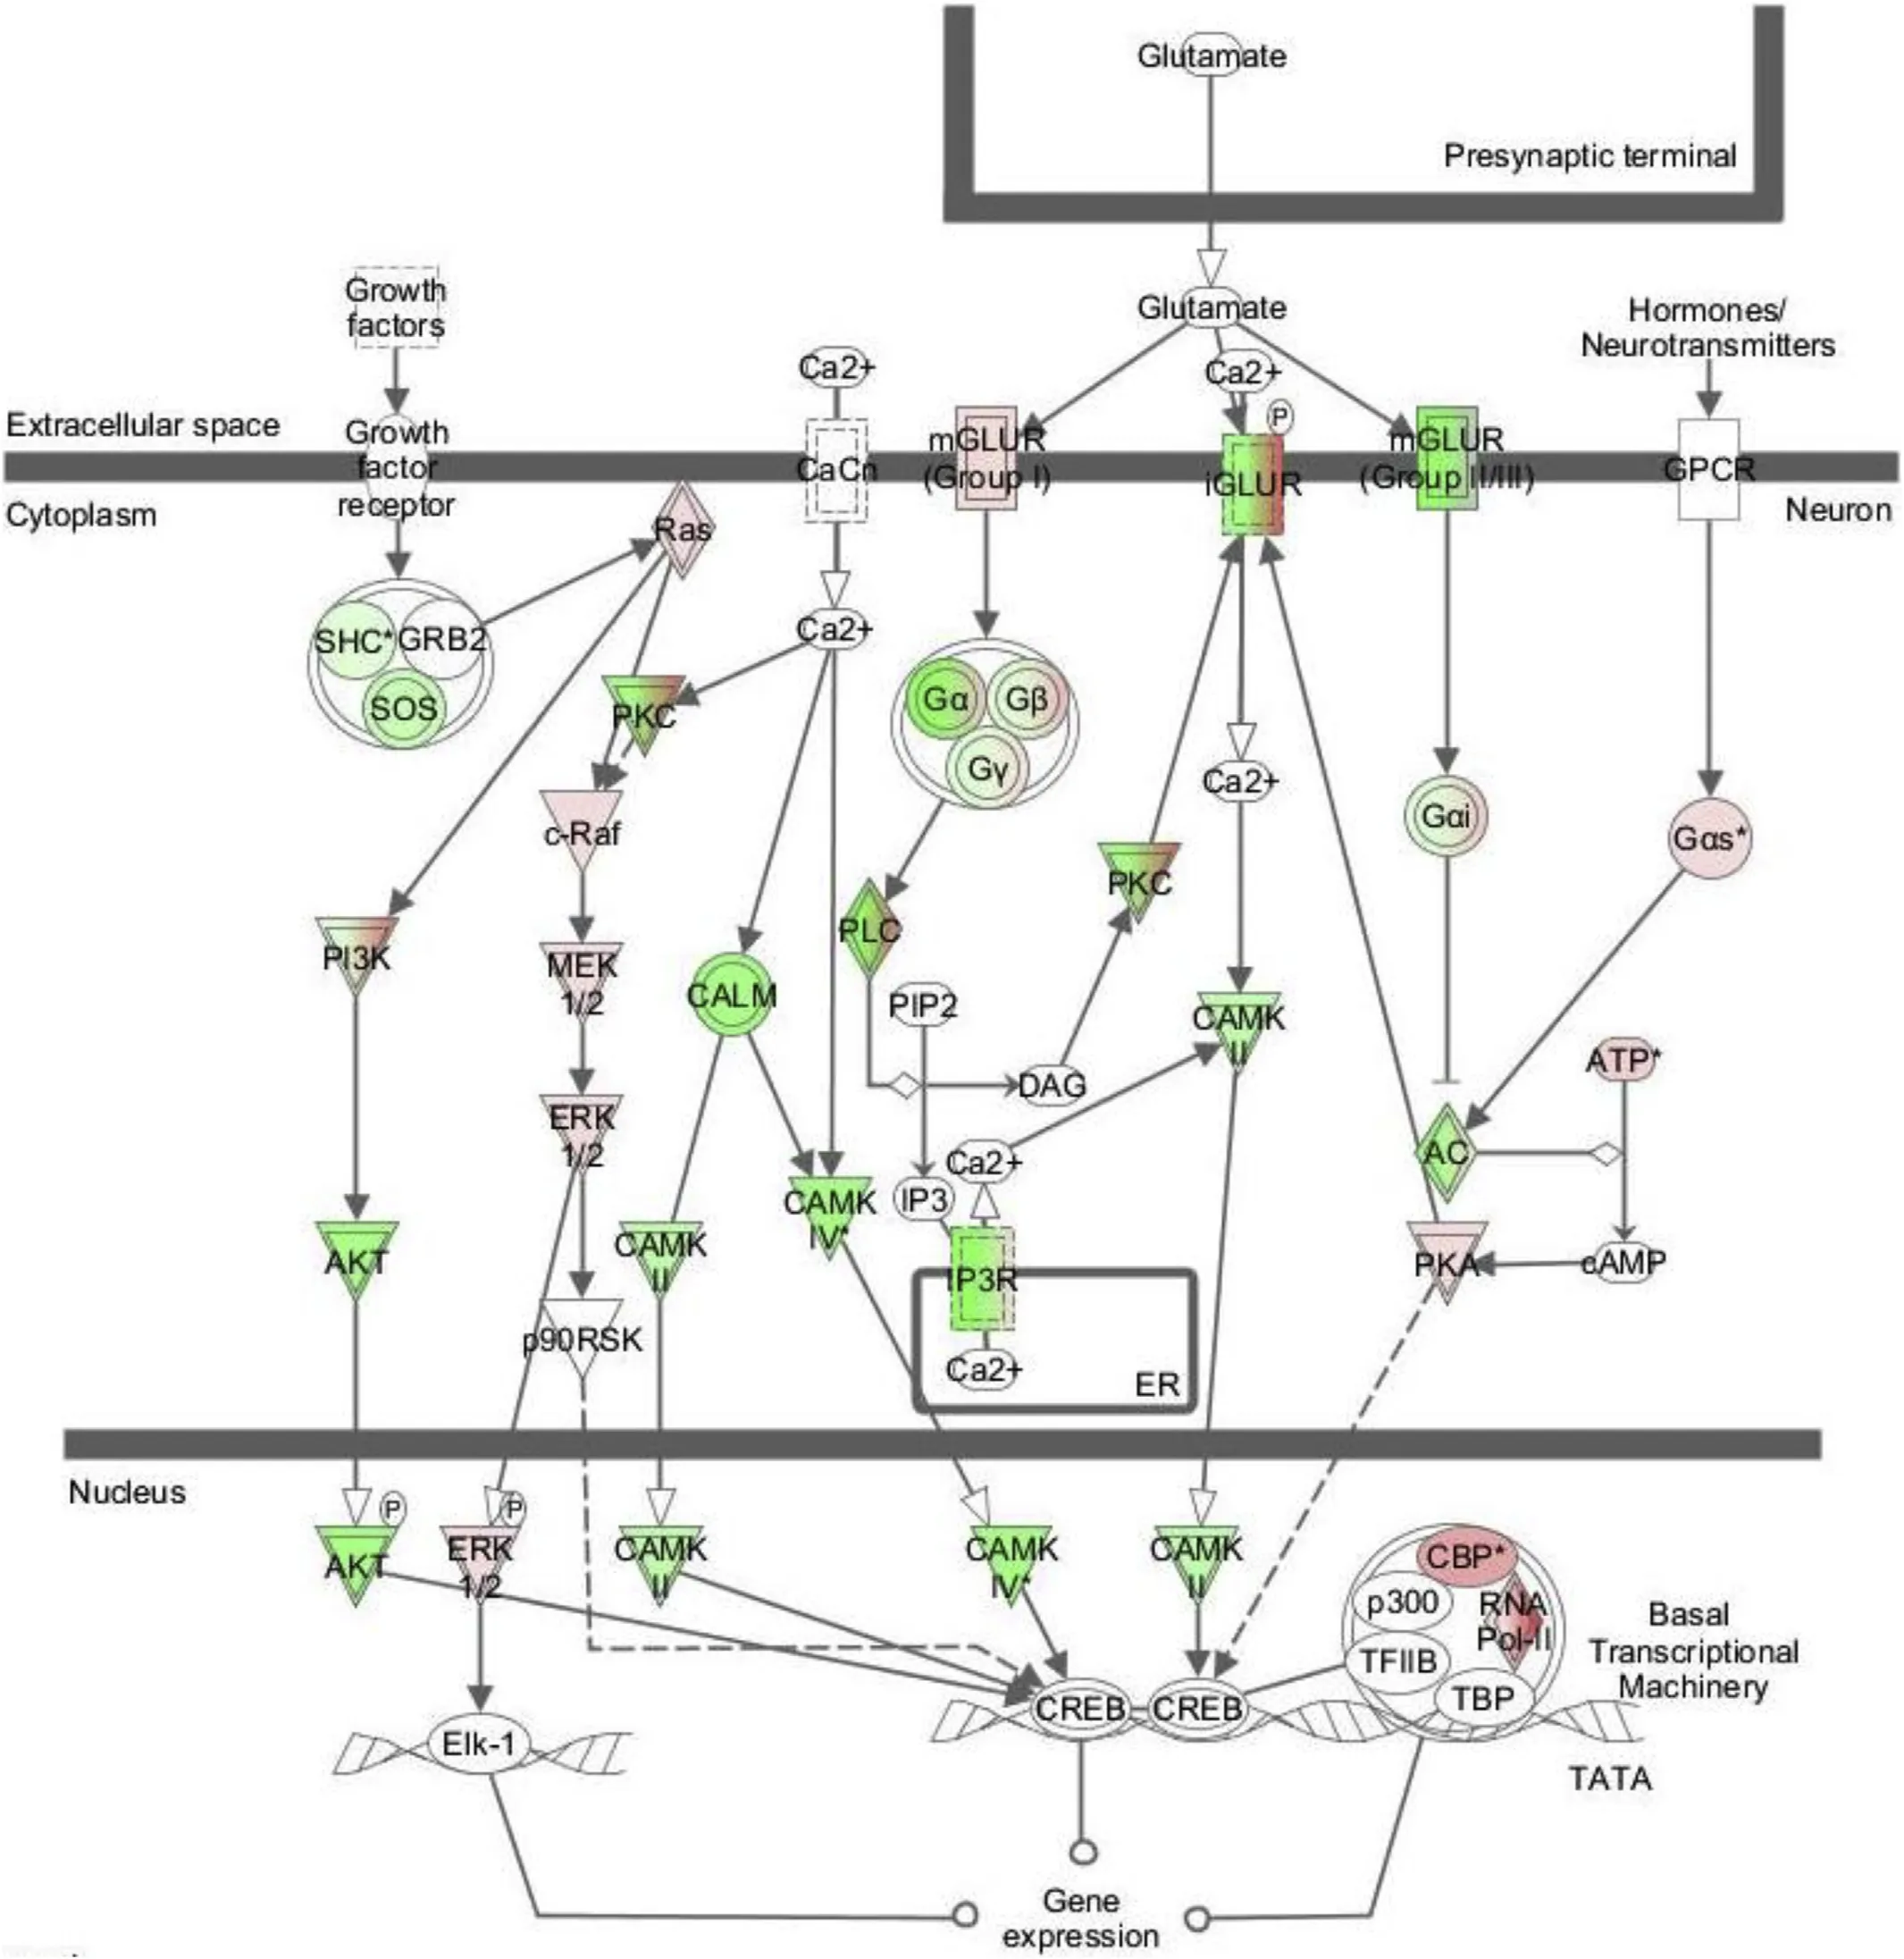
Fig.3.The CREB signalling pathway,highlighting the differentially expressed transcripts between low(L)and high(H)SGR sea bass when differential transcripts from all tissue analysed were pooled.Red shading indicates higher expression values in(H)fast growing fish,green shading indicates higher expression(L)in slow growing fish and white is not significantly different.The intensity of the colour denotes the intensity of the response as assessed by transcript abundance.Expression results are shown for the sum/overlap of differential transcripts represented in all three tissues.Note transcripts of the G-protein,Ca2+and PI3K intracellular signalling pathways appear to be down-regulated.In contrast the ERK signalling pathway was up-regulated through GLUR(group I)and presumably acts via Elk-1(no information)to bring about its effect.Notably in the top five canonical pathways,in addition to the CREB pathway,a number of complimentary pathways involved in sexual differentiation were observed.The pathways identified included gonadotropin releasing hormone(GNRH)in the brain,corticotropin releasing hormone(CRH)in the liver and androgen signalling pathways in the muscle(Fig.S2).The results indicate slow or fast growth was the outcome of the integrated tissue specific responses that interlink to create a whole body physiological response such as sexually dimorphic growth.
In our study higher expression of cAMP/CREB path via G-protein GN-alpha(GαS)and protein kinase-A(PKA)occurred in the fish with a higher SGR and this pathway was coupled to G-protein receptors(GPCR)of several hormones and neurotransmitters.In contrast,Ca2+/calmodulindependent protein kinase(CaMKs)the alternative signalling pathway for GPCRs via Ca2+/calmodulin was reduced.Specifically,in muscle this Ca2+GPCR signalling pathway was up-regulated and it is part of a signalling cascade with an important role in cellular growth and development.Transcript encoding proteins involved in CREB regulation varied between tissues,indicating as expected tissue specific regulation.The results regarding tissue specificity was the complementation of tissue specific pathways that when interlinked via hormonal stimuli create a higher physiological response such as sexual differentiation.GNRH,corticotropin releasing hormone(CRH)and androgen signalling pathways were among the top five enriched pathways in brain,liver and muscle,respectively.The CRH network was most populated with transcripts and was down-regulated in the fast growing fish.The CRH signalling pathway is principally recognised for its role in stress(Brewer et al,2003),although it has also been implicated in reproduction(Leatherland,Li,&Barkataki,2010).The down regulation of the CRH receptor and elements of this signalling pathway in the liver of large fish was intriguing and suggested possibly a lower stress response.It will be important to assess plasma indicators of the stress axis to determine if the smaller fish have a more active stress-axis and if this contributed to their lower growth rate.Alternatively,and taking together the three principal pathways that intersect the three tissues,which were linked with reproduction they may suggest growth divergence as a consequence of sex.The fish used in the experiment had probably already undergone sexual differentiation,but it was not possible to visually check sexual gender during the sampling due to the smallsize of the fish.As such,most gonads were sampled for future histological studies which might confirm this gender bias to explore the possibility that the bigger fish might be females.
5.Conclusion
The present study has demonstrated the utility of high throughput methods for revealing transcriptional changes that underlie divergent growth phenotypes in the sea bass.The three tissues tested,the liver,muscle and brain suffered different changes suggesting tissue specific programs operate,although intersecting pathways common to the three tissues were identified suggesting an integrated response.The results suggested that changes in endocrine regulatory pathways involving the IGF,insulin and stress axis may be at the basis of the divergent growth observed in our study.By merging transcriptomics with QTL analysis it has been possible to identify a suite of candidate genes which may explain the divergent growth phenotypes.The SAGE method deployed coupled to the SOLiD4 sequencing platform permitted identification of SNPs,which should contribute to future studies aimed at identifying the causative mutations explaining QTL.Phenotype characterization needs to be extended to other markers,such as plasma biochemical parameters and to test experimentally the link between pathway/transcript changes and physiology.
Author's contributions
BL planned the work,carried out the fish growth experiment,all laboratorial practical work,all bioinformatics analysis and wrote the manuscript.RSTM and PISP assisted in the SAGE libraries construction,RR carried out the sequencing production and provided genome data,DJ de K provided funds and participated in planning the bioinformatics analysis.AVMC and DMP provided funds,planned the work,contributed to data analysis and wrote the manuscript.
Acknowledgements
The authors acknowledge funding by the European Commission of the European Union through the Network of Excellence Marine Genomics Europe(contract GOCE-CT-2004-505403)and by the Portuguese Foundation for Science and Technology(FCT)through project CMAR/Multi/04326/2013 and grants to BL(SFRH/BD/29171/2006),PISP(SFRH/BPD/25247/2005)and RSTM(SFRH/BPD/66742/2009).BL benefited from a SABRETRAIN Marie Curie EST fellowship.The authors thank Nˊadia Silva,Rita Costa,Pedro Guerreiro and^Angela Ramos for experimental sampling and Dr Hideo Matsumura for advices on the SuperSAGE-SOLiD adaptors and protocol.
Appendix A.Supplementary data
Supplementary data related to this article can be found at https://doi.org/10.1016/j.aaf.2018.03.001.
 Aquaculture and Fisheries2019年1期
- Aquaculture and Fisheries的其它文章
- Genome-wide association study identifies loci for body shape in the large yellow croaker(Larimichthys crocea)
- Sex-biased gene discovery from the gonadal transcriptomes of the large yellow croaker(Larimichthys crocea)
- Molecular aspects of eye development and regeneration in the Australian redclaw cray fish,Cherax quadricarinatus
- Uncovering the immunological repertoire of the carpet shell clam Ruditapes decussatus through a transcriptomic-based approach
