
Genome-wide association study identifies loci for body shape in the large yellow croaker(Larimichthys crocea)
2019-03-01 01:17LinsongDongZhofngHnMingFngShijunXioZhiyongWng
Aquaculture and Fisheries 2019年1期
Linsong Dong ,Zhofng Hn ,Ming Fng ,Shijun Xio ,Zhiyong Wng ,b,*
a Key Laboratory of Healthy Mariculture for the East China Sea,Ministry of Agriculture,Fisheries College,Jimei University,Xiamen 361021,Fujian,China
b Laboratory for Marine Fisheries Science and Food Production Processes,Qingdao National Laboratory for Marine Science and Technology,Qingdao 266235,China
Keywords:Large yellow croaker Genome-wide association study Body shape BayesC Genotyping-By-Sequencing
A B S T R A C T The large yellow croaker(Larimichthys crocea)is an important maricultured fish species in southeast China.Body shape is an important economic trait for this species,because consumers prefer to purchase fish that have a slender shape.Furthermore,investigating the genetic basis of this trait may be useful for understanding the evolution of fish body shape in general.This study randomly selected 500 large yellow croakers to perform genome-wide association study of this trait.We used Genotyping-By-Sequencing technology combined with a genome-wide prediction model(BayesC)to identify and test QTLs.We also compared the association results using BayesC and single-marker analysis,and found that BayesC outperformed single-marker analysis in detecting significant SNPs explaining a proportion of the total genetic variance in this experiment.Using 124,419 SNP markers,10 candidate genes,correspond to 4 QTL regions located around 3.5,1.8,23.9 and 10.8 Mb on chromosomes 2,4,8 and 22 respectively,were suggested to be relevant to the trait.All of these genes may directly or indirectly participate in bone development.These genes may provide a valuable reference for marker-assisted selective breeding and investigating the genetic basis of the evolution of fish body shape.
1.Introduction
The Large yellow croaker(Larimichthys crocea)is a commercially important maricultured fish species in southeast China(Xiao,Li et al.,2015).Since the 1970s,the number of wild populations has been severely reduced due to over fishing and habitat destruction(Liu et al.,2011).Recently,artificial farming of the large yellow croaker has since developed rapidly,which has led to an urgent need to improve the breeding potential to increase the economic benefits.The important economic traits in the large yellow croaker include growth rate,feed conversion rate,meat quality and disease resistance.These traits are very common breeding goals for aquatic species(Yue,2014).However,the body shape index(BSI),which is defined as the ratio between body length(BL)and body height(BH)is another important economic trait for the large yellow croaker.Consumers prefer to purchase fish with slender bodies because of the attractive shape.
Recently,genomic selection has been suggested as an efficient breeding scheme to improve selection accuracy while limiting inbreeding(Sonesson&Meuwissen,2009).However,to reduce the genotyping costs,it may be a better strategy to perform selection by using a subset of SNP markers or candidate genes associated with the traits of interest(Dong,Xiao,Chen,Wan,&Wang,2016).In addition,it has been suggested that functional constraints,including swimming,feeding and avoiding predators,play an important role in the evolution of fish body shape;however,the role of genetic constraints is less well understood(Reid&Peichel,2010).To the best of our knowledge,some studies have focused on the genetic architecture of body shape in fish species,such as in Salmo salar(Boulding et al.,2008),Cyprinus carpio(Zhang,Oyajobi et al.,2013;Zhang,Wang et al.,2013),Coregonus clupeaformis(Laporte et al.,2015),and Gnathopogon fishes(Kakioka,Kokita,Kumada,Watanabe,&Okuda,2015).Hence,investigating its genetic basis may enrich the theory of the evolution of fish body shape.
The availability of the Genotyping-By-Sequencing(GBS)technology offers an efficient way to genotype genome-wide SNP markers,and can typically produce hundreds of thousands of SNPs(Elshire et al.,2011).It has been extensively applied in genome-wide association studies(GWAS)(Arruda et al.,2016;Bastien,Sonah,&Belzile,2014;Wang et al.,2017).GBS is also important for GWAS for the large yellow croaker because there is no commercial SNP chip available for this fish species.Thus,we have an opportunity to detect quantitative trait loci(QTLs)that affect BSI.
Single-marker analysis(SMA)is the simplest statistical method for GWAS and tests one SNP at a time.However,SMA may not be optimal for QTL detection of traits that are very polygenic(Li,Das,Fu,Li,&Wu,2011)such as body shape(Laporte et al.,2015).Instead,some researchers proposed to localize all potential QTLs simultaneously by modelling all SNPs at the same time(De Los Campos,Gianola,&Allison,2010;Huang,Eversley,Threadgill,&Zou,2007;Yi&Xu,2008).The Bayesian methods,such as BayesB(Meuwissen,Hayes,&Goddard,2001)and BayesC(Habier,Fernando,Kizilkaya,&Garrick,2011;Kizilkaya,Fernando,&Garrick,2010),are implemented via Markov Chain Monte Carlo(MCMC)algorithms and perform variable selection to define SNP with no zero effects in the genomic model,and thus have become common QTL detection methods in a lot of livestock species(Fan et al.,2011;Legarra et al.,2015;Michenet,Barbat,Saintilan,Venot,&Phocas,2016;Onteru et al.,2011;Wolc et al.,2014).In this study,we aim to apply BayesC to detectgenome-wide QTLs affecting BSI.To our knowledge,it is the first time that GWAS has been performed for BSI in the large yellow croaker.
2.Materials and methods
2.1.Materials
All experimental protocols were approved by the Animal Care and Use Committee of the Fisheries College of Jimei University(Animal Ethics no.1067).
The experimental organism was the large yellow croaker.Thirty males and thirty females were randomly selected as the parents and were mated randomly with each other in a breeding nucleus farm named“Jinling Aquaculture Science and Technology Co.Ltd.”in Ningde City,Fujian Province,P.R.China.We used the hormone called Luteinizing Hormone Releasing Hormone A3(LRH-A3)to ensure that males and females released sperm and eggs simultaneously.The progeny were reared in the farm for forty days,and were then were transferred to sea cages in Dongwuyang Bay.One year later,three thousand progeny were randomly selected and transferred to the nucleus farm again.Approximately 10 months later, five hundred progeny(237 males and 263 females)were randomly sampled as experimental animals.The kinship clustering result based on their genotypes using Euclidean distance was shown in our previous study(Qiu et al.,2017).The body length(BL)and body height(BH)were measured in live fish,and the body shape index(BSI)was obtained using the formula BSI=BL/BH.The mean±S.D.of BSI was 3.68±0.22 for males and 3.54±0.22 for females.
2.2.Next generation sequencing(NGS)and genotyping
Dorsal fin samples from the 500 progeny were collected for DNA extraction.The GBS method was used to construct libraries and find genome-wide SNP markers.Most of the steps for sequencing and genotyping were described by Xiao et al.(2016)and a summary is given here.Genomic DNA(20 ng/μL)was incubated at 37°C with Eco RI(0.8μL),Nla III(0.8μL),10XCutSmart™ Buffer(2μL)and MilliQ water(6.4μL).Digestion reactions were heat-inactivated at 65°for 20 min and the reaction system was kept at 8°C.The digested DNA was ligated to adapter sequences with 10XCutSmart™ buffer(2μL),10 mmol/L ATP(4μL),T4 DNA ligase(3 μL),adapter and barcode mix(5μL)at 16°C for 2 h.The restriction-ligation reaction was then heat-inactivated at 65°C for 20 min and the reaction system was kept at 8°C.Then,the PCR reaction was performed using diluted restriction-ligation samples(2μL),dNTP(5μL),Taq DNA polymerase(5μL)and IlluminaF primer(1μL)and indexing primers(1μL).The PCR productions were separated by 8%polyacrylamide gel electrophoresis.Fragments with 200-300 bp in size were isolated using a Gel Extraction Kit.Pair-end sequencing was performed on an Illumina high-throughput sequencing platform,Hiseq 2500.The NGS sequencing of GBS libraries totally generated~314 Gb raw sequencing reads for the 500 individuals.The adaptors were removed from raw sequencing reads and the resultant reads were split by sample-specific barcode sequences.FastQC was used to perform the quality check(Xi et al.,2013).
The quality filtered reads were then mapped to the reference genome sequence of large yellow croaker(Ao et al.,2015)by BWA version 0.7.6a(Li&Durbin,2010).Note that Xiao et al.(2016)marked the duplicates and then filtered the marked duplicates,but the duplicates were not marked in this study because the GBS technology could produce abundant stacked reads confused with PCR duplicates;performing duplicate filtration might have filtered out 60-95%of the aligned reads(Perea et al.,2016).Then,the GATK package(Mckenna et al.,2010)was applied for SNP calling.Overall,234,672 SNPs,with a missing rate<10%were obtained and the missing SNPs were imputed by the Beagle software,Version 4.1(Browning&Browning,2016).Although there was no reference panel containing non-missing SNPs,the software provided the option to manage the imputation without a reference panel.We then discarded SNPs with a minor allele frequency(MAF)<0.05 and P-values<1×10⁻⁵for chi-square tests for the Hardy-Weinberg equilibrium.The distribution of MAF was shown in Fig.1.After quality control,a total of 124,419 SNPs were retained for the GWAS.
2.3.GWAS by BayesC approach
Here,we used a genome-wide prediction model(BayesC)to perform the GWAS.The multiple-regression models are at two levels in the Bayesian approach(Meuwissen et al.,2001).The first level is to explain the phenotypes using a mixed linear model:
where y is an n×1 vector of phenotypic values and X is an n×m incidence matrix of fixed effects b.Here,b is the vector of sexual effects,and Xi=(1 0)for male and(0 1)for female;thus,m=2 in this study.Z is an n×p matrix of SNP genotypes(the genotypes“AA”,“Aa”,and “aa”are coded as “0”,“1”and “2”,respectively),a is a p × 1 vector of SNP additive effects,e is an n×1 vector of residual effects and e~N(0,Iσe2).
The second level of the model is to describe the distribution of SNP effects or variances.In BayesC,only a portion of SNPs has non-zero effects;the other SNPs have no effect(Habier et al.,2011),which is termed a “spike and slab”distribution(Mitchell&Beauchamp,1988).All non-zero SNP effects follow a normal distribution with a null mean and a common varianceσ2,which in turn is assumed to follow an inverse chi-square prior with degree of freedom v and the scale parameter s2(Fernando&Garrick,2013;Habier et al.,2011):
where
In this study,we assumed that 99.8%of SNPs had no effect(i.e.,π=0.998).The degree of freedom v was set to 4.2,as in(Meuwissen et al.,2001),and the scale parameter was computed as s2=where pjis the frequency of allele “a”in locus j,andis the total additive genetic variance that is estimated using the software package “GVCBLUP”(Wang et al.,2014).Before estimating,a genomic relationship matrix was built using the formula:where the j th column of P is a vector of the frequency of allele “a”at the j th locus(Vanraden,2008).The priors for fixed effects b and residual varianceare assumed to follow uniform distributions.
The posterior distributions of various parameters and MCMC sampling steps have been described in several studies(Fernando&Garrick,2013;Habier et al.,2011).Gibbs sampling was run for 20,000 cycles,and the first 5000 cycles were discarded as burn-in.All calculation processes were implemented in Fortran90 codes and run on the computer server of Jimei University.
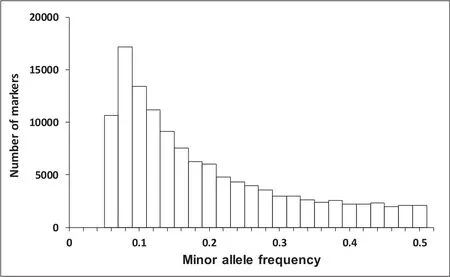
Fig.1.The distribution of minor allele frequency in the large yellow croaker.
2.4.Hypothesis testing
Here,we used the approximate Bayesian LOD(BLOD)score proposed by Yiand Xu(2008)as the teststatistic.The BLOD score for SNP j(BLODj)is defined as
Don, she said, You re crazy, and your silly rules are eliminating the girl you ve been waiting for. But have it your way. Just take her name and phone number, and when you change your mind, call her.
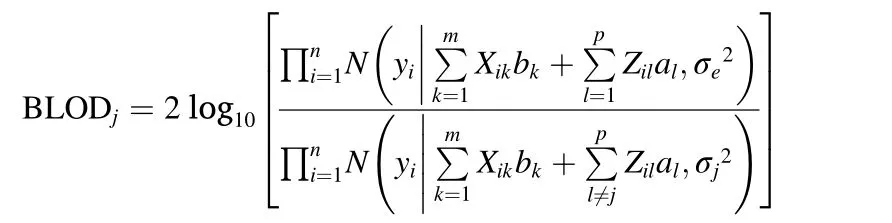
where bk,alandare the sampled values in a certain iteration,andis a sample from an inverse chi-square distribution,anddenote the likelihoods that SNPjis and is not associated with the phenotypes,respectively.The BLOD score is similar to the LOD score in traditional QTL mapping approach(Lander&Botstein,1989),but BLOD considers the contribution of a given locus to the LOD after adjusting for the effects of all other loci(Yi&Xu,2008).Normally,a larger BLOD means that the SNP has a higher probability of being associated with the phenotypes.
Permutation tests were performed to confirm a significance threshold for the BLOD score.By re-ordering the phenotypes of all individuals,each individual was randomly reassigned a new phenotypic value.The shuffled data were then used to perform GWAS and generate new BLOD scores.The above procedure was repeated 1000 times,so 1000 BLOD scores would be yielded for each locus.The significance threshold atα level for a BLOD score was obtained as follows(Churchill&Doerge,1994):the maximum BLOD score was first found over all SNP loci for each of the 1000 permutations.Then,these values were ordered from smallest to largest,and their 100(1-α)percentile was considered the significance threshold value atαlevel.This significance threshold was also termed an experiment-wise threshold(Churchill&Doerge,1994).In this study,a SNP with a BLOD score larger than the thresholdα=0.05 was significantly associated with the trait.
2.5.GWAS by SMA approach
To compare the results between BayesC and SMA,we also performed GWAS using the EMMAX software(Kang et al.,2010).This softwarefirst calculates the genomic relationship matrix using whole-genome SNPs and then uses a mixed linear model to detect the association between a SNP and the phenotypes:
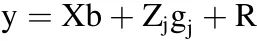
where y is an n×1 vector of phenotypic values,X is an n×m incidence matrix of fixed effects b(b is a vector of sexual effects),Zjis an n×1 vector of the genotypes for the j th locus,gjis the regression coefficient,and Var(R)=+where G is the genomic relationship matrix,is the total genetic variance,andis the environmental variance.Manhattan plots were generated using the R-package “qqman”,version 0.1.2.
2.6.Sequence analysis
The±1 Mb regions surrounding the significant SNPs based on the physical map order(Xiao,Han et al.,2015)were suggested to be candidate QTL regions.FGENESH(Solovyev,Kosarev,Seledsov,&Vorobyev,2006)was used to predict the nearby genes from the large yellow croaker reference genome sequences(Ao et al.,2015).The genes were then annotated by BLAST analysis(Altschul,Gish,Miller,Myers,&Lipman,1990)against the non-redundant protein database(Pruitt,Tatusova,&Maglott,2007).
3.Results and discussion
3.1.Heritability estimation
The narrow-sense heritability of the BSI trait estimated by the“GVCBLUP”package was 0.32±0.09.Previous study showed that heritability estimates were approximately 0.60 and 0.53 for BL and BH,respectively,but there was also a very high genetic correlation(~0.97)between BL and BH(Qiu et al.,2017).Therefore,when the selection is performed for the BSI trait,the selection of BL should also be considered simultaneously for this fish species breeding.If we only select the BSI,we do not know whether the BL becomes longer or the BH becomes shorter.
3.2.Results of GWAS in BayesC and SMA
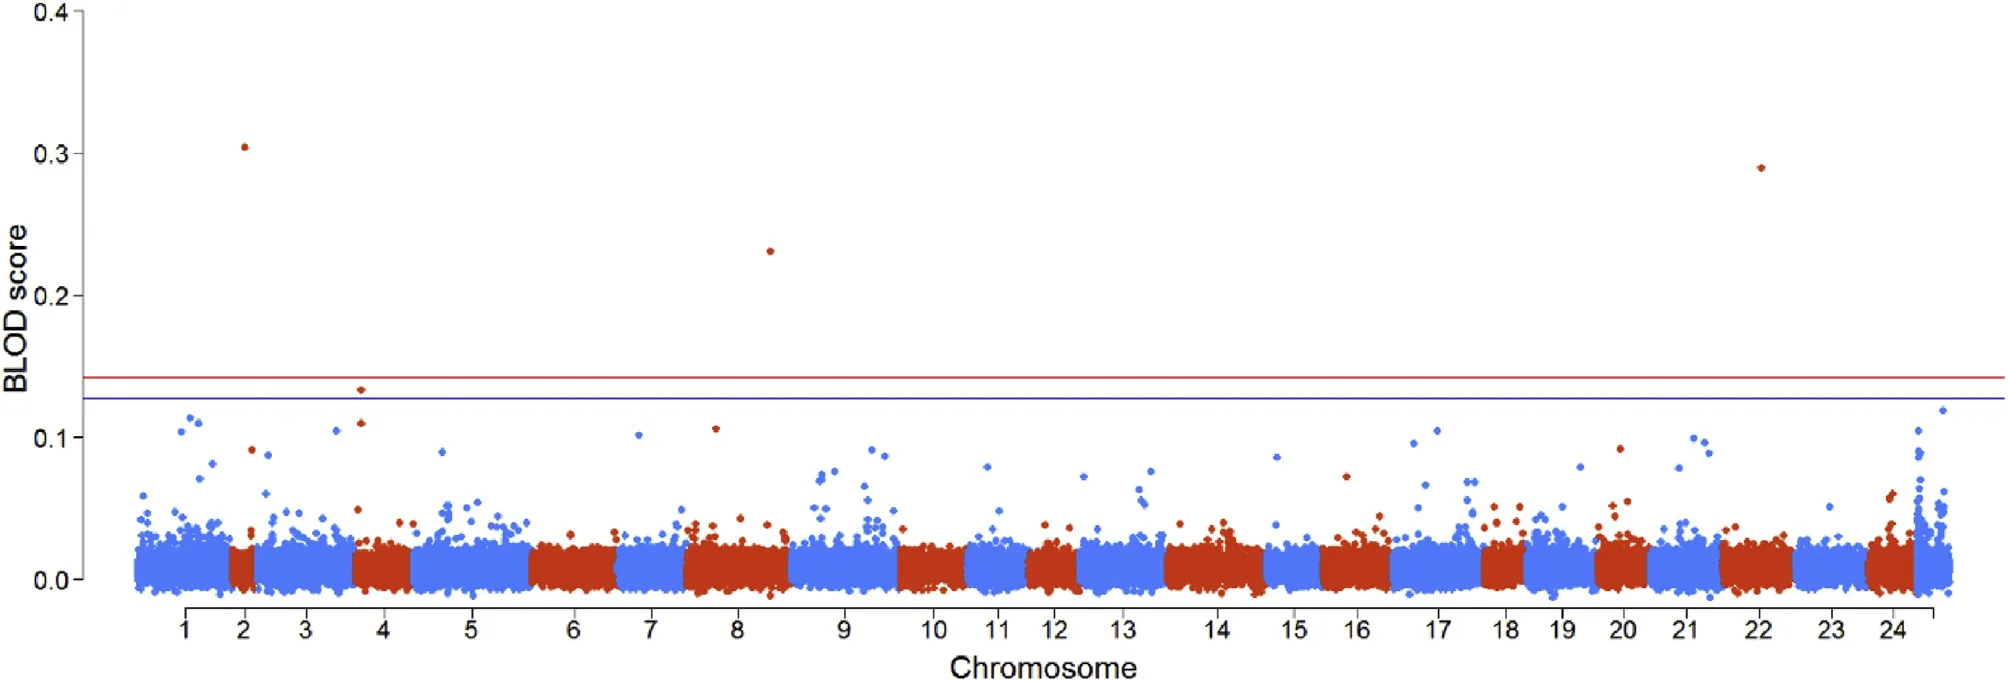
Fig.2.Manhattan plot of the GWAS using BayesC for body shape index.The red and blue lines represent the BLOD threshold values at theα=0.01 andα=0.05 at the genome-wide level,respectively.(For interpretation of the references to colour in this figure legend,the reader is referred to the Web version of this article.)
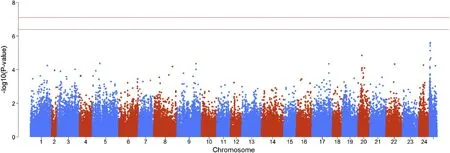
Fig.3.Manhattan plot of the GWAS using SMA for body shape index.The data were analysed using the EMMAX software.The red and blue lines represent P-values at theα=0.01 andα=0.05 at the genome-wide level,respectively.(For interpretation of the references to colour in this figure legend,the reader is referred to the Web version of this article.)
Fig.2 and Fig.3 show the distributions of BLOD scores and the-log10(P-values)for all SNPs,respectively.The BLOD threshold values at α=0.05 and 0.01 obtained from the permutation tests were 0.127 and 0.142,respectively.In Fig.2,four SNPs located on chromosomes 2,4,8 and 22 were found with BLOD scores>0.127.Among them,the BLOD scores of three SNPs distributed on chromosomes2,8 and 22 were greater than 0.142.However,no SNP was found to be significantly associated with the trait in the SMA results when the significance threshold was set as 0.05/124,419=4.02×10-7[-log10(P-values)=6.4].The reason may be the SMA model cannot satisfy the polygenic nature of this trait.Another reason may be the BayesC can highlight the SNPs with large effects.In the Bayesian results,four significant SNPs could explain 36.5%of the total genetic variance.However,if the same number of SNPs with the largest-log10(P-values)estimated by SMA were used to explain the genetic variance,we found that only 12.3%of the total genetic variance could be explained,which indicated that BayesC might find SNPs associated with trait more accurately than SMA in this experiment.
3.3.Candidate genes
Fish body shape may be relative to bone development.We found 10 candidate genes surrounding the significant SNPs that might be associated with bone development.The significant SNPs and candidate genes are listed in Table 1.FGF13 is one of members in the fibroblast growth factor(FGF)family of genes,and FGFR3 is a FGF receptor gene.FGF/FGFR signalling is an important pathway involved in skeletal development(Du,Xie,Xian,&Chen,2012).The gene WNT3A is a member of the WNT family.The WNT/β-catenin signalling pathways play roles in osteoblastic differentiation and maintaining skeletal homeostasis(Zhang,Oyajobi et al.,2013;Zhang,Wang et al.,2013).MPG encodes the matrixgla protein(MPG)that has been identified as a calcification inhibitor in cartilage in mice(Luo et al.,1997),and identified as the bone morphogenetic protein-2(BMP-2)regulatory protein(Zebboudj,Imura,&Bostrom,2002).ARRB2 encodes the protein β-arrestin2,which has been shown to control receptor activator of nuclear factor kappa-B ligand(RANKL)-dependent osteoclastogenesis in vitro in mice and to decrease bone resorption in vivo(Pierroz et al.,2009).ERBB4 encodes receptor tyrosine protein kinase ERBB4,which is one of the members of the ERBB family.In mice,ERBB signalling has been identified as being required for cartilage and bone development(Fisher,Clinton,Maihle,&Dealy,2007).CYP26A1 is a CYP26 enzyme that can regulate the cellular levels of retinoic acid(RA),which may increase the activity of axial osteoblasts(Spoorendonk et al.,2008).
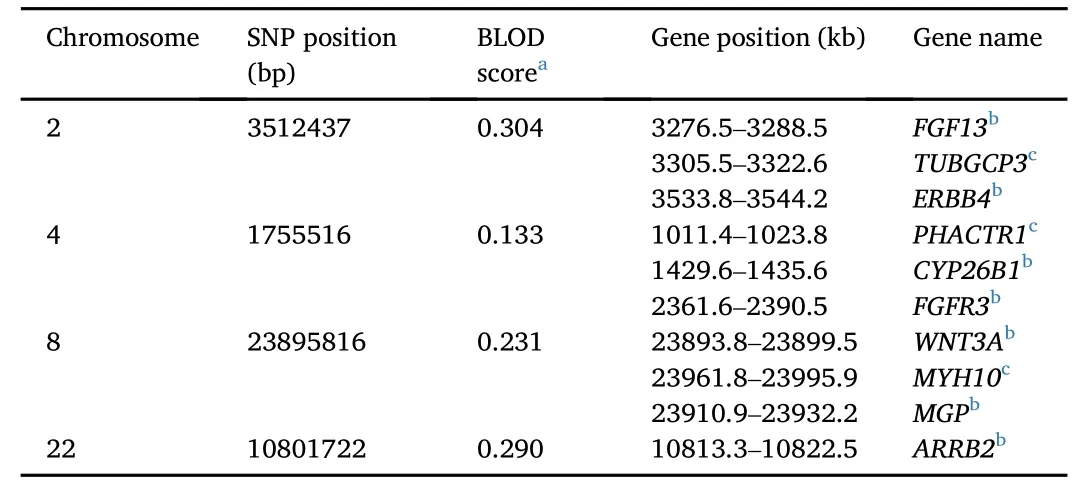
Table 1 Information of significant SNPs and candidate genes.
There are also some genes relevant to the cytoskeletal proteins,such as MYH10,PHACTR1,and TUBGCP3.MYH10 plays an important role in cytoskeleton reorganization(Betapudi,2010).The protein phosphatase and actin regulator 1(PHACTR1)is one of the members of the PHACTR family.This family can bind actin and regulate the reorganization of the actin cytoskeleton(Filsaimˊe et al.,2013).TUBGCP3 encodes the γ-tubulin complex,which plays an important role in microtubule nucleation(Gunawardane,Lizarraga,Wiese,Wilde,&Zheng,2000).In human mesenchymal stem cells,cytoskeleton organization might play an important role in osteogenic differentiation,and microtubules mightplay a regulatory role in this process(Rodriguez,Gonzalez,Rios,&Cambiazo,2004).
This study applied BayesC to perform GWAS for the trait BSI for the large yellow croaker.The results showed that GWAS performed by modelling all SNPs simultaneously was better than using single-marker analysis to detect SNPs explaining a significant proportion of the total genetic variance.A total of 10 genes were found to directly or indirectly participate in the bone development,thus providing a reference for selective breeding and investigating the genetic basis of the evolution of fish body shape.
Data availability
Raw DNA sequencing reads were deposited in NCBI with the project accession of PRJNA309464 and SRA accession of SRR3114179.The SNP data were deposited in European Variation Archive(EVA)with the project accession of PRJEB22261.
Conflicts of interest
The authors declare no conflict of interest pertaining to the research report in this manuscript.
Acknowledgements
Kun Ye,Qingkai Chen,Junwei Chen,Yang Liu and other colleagues in the laboratory participated in fish sampling and traits measurement.The work was supported by China Agriculture Research System(CARS-47-G04),Key projects of the Xiamen Southern Ocean Research Centre(14GZY70NF34)and the National Natural Science Foundation of China(U1705231).
 Aquaculture and Fisheries2019年1期
- Aquaculture and Fisheries的其它文章
- Sex-biased gene discovery from the gonadal transcriptomes of the large yellow croaker(Larimichthys crocea)
- SuperSAGE digital expression analysis of differential growth rate in a European sea bass population
- Molecular aspects of eye development and regeneration in the Australian redclaw cray fish,Cherax quadricarinatus
- Uncovering the immunological repertoire of the carpet shell clam Ruditapes decussatus through a transcriptomic-based approach