
Pose Estimation of Space Targets Based on Model Matching for Large-Aperture Ground-Based Telescopes
2018-12-10 05:12:46ZhengweiLiJianliWangTaoChenBinWangandYuanhaoWu
Zhengwei Li , Jianli Wang , Tao Chen Bin Wang and Yuanhao Wu
Abstract: With the development of adaptive optics and post restore processing techniques, large aperture ground-based telescopes can obtain high-resolution images(HRIs) of targets.The pose of the space target can be estimated from HRIs by several methods.As the target features obtained from the image are unstable, it is difficult to use existing methods for pose estimation.In this paper a method based on real-time target model matching to estimate the pose of space targets is proposed.First, the physicallyconstrained iterative deconvolution algorithm is used to obtain HRIs of the space target.Second, according to the 3D model, the ephemeris data, the observation time of the target,and the optical parameters of the telescope, the simulated observation image of the target in orbit is rendered by a scene simulation program.Finally, the target model searches through yaw, pitch, and roll until the correlation between the simulated observation image and the actual observation image shows an optimal match.The simulation results show that the proposed pose estimation method can converge to the local optimal value with an estimation error of about 1.6349°.
Keywords: Ground-based telescope, pose estimation, correlation matching, space target,image restoration.
1 Introduction
With the development of adaptive optics and post restore processing techniques large aperture ground-based telescopes can obtain high-resolution images of targets near the diffraction limit resolution [Matson, Borelli, Jefferies et al.(2009); Guan, Chen, Yi et al.(2011); Wang, Wang, Wang et al.(2011); Gallé, Gladysz, Mugnier et al.(2013); Jia,Wang, Zhao et al.(2013); Booth (2014); Liu and Atluri (2015); Rivenson, Zhang,Günaydın et al.(2017); Lin, Liu, Wang et al.(2016)].By analyzing the pose of the space target, information on the satellite mission state and reconnaissance area can be obtained,which is significant for space target surveillance [Frueh (2016)].
Current pose estimation methods can be divided into two types.One is to calculate the pose by searching for the corresponding relation of some feature projection from three to two dimensions [Bai and Junkins (2016); Conway and Daniele (2016); Zhang, Liu and Jiang (2015); Xia, Xu and Xiong (2012)].The other is based on a model, which uses 3D model retrieval technology to estimate the pose, which avoids establishing complex projection relations, but needs to build a large and complex model database [Labibian,Alikhani and Pourtakdoust (2017); Picos, Diaz-Ramirez, Kober et al.(2016); Tang, Wen,Ma et al.(2011); Shan, Ji and Zhou (2009)].The accuracy of the match is limited by the accuracy of the established model base.For a ground-based telescope the image quality will degrade due to atmospheric turbulence.With a change of pose it is impossible to observe the parts not exposed by the Sun.So, the target features obtained from the image are unstable, and it is difficult to use the first method for pose estimation.After adaptive optical correction or image restoration, large aperture ground-based telescopes can obtain more accurate images of the target contours.The model matching method can obtain more accurate results.Poses of solar panels, loads, and main body of the target may all change; if the 3D model retrieval technology is used to estimate the pose, a very large model matching database is necessary, so its practicability is limited to a certain extent.In this paper a method of estimating the pose of a space target based on model matching is proposed, using a real-time scene simulation program [Xiong, Fu, Tang et al.(2012);Dai, Li and Yin (2006); Zhai (2016)] to generate the simulated observation image of the space target in orbit, searching through the yaw, pitch, and roll of the target model until the best match is made between the simulated observation image and the actual observation image.This method includes three aspects:high resolution image restoration,scene simulation, and real-time model matching.
The paper is organized as follows.Section 2 describes the principle of a physicallyconstrained iterative deconvolution (PCID) algorithm.Section 3 describes the technology for simulated observation images of the space target in orbit.Section 4 describes the method of estimating the pose e of the space target based on model matching.Section 5 presents the analysis results of the simulation experiment.Section 6 concludes the paper.
2 PCID algorithm description
2.1 Object degradation model
For a ground-based telescope atmospheric turbulence effects on the target is assumed to be time-shift invariant.Under incoherent light illumination the imaging degradation with Gaussian noise is modeled as Eq.(1):

where d(x)is the distorted nosy image, f(x)is the original undistorted image, s(x)is the point-spread function (PSF) of the system, n(x)is the Gaussian noise, ⊗is the convolution operator, and x is the image coordinate.
In the near field the PSF is expressed as Eq.(2):

where F−1is the inverse Fourier transform,is the pupil function of the system,is pupil coordinate, Φis the wave-front phase which can be decomposed into a set of Zernike polynomials as given by Eq.(3):

where αmis the m-th polynomial coefficient,is the m-th Zernike polynomial base.
2.2 PCID theory
The Object and PSF estimates are generated by minimizing a cost function that is based on maximum-likelihood estimation (MLE).Prior physical constraints are used, which transform the process of solving the problem into constrained optimization, improves the ill-condition of the problem itself, and obtains more accurate results.Prior physical constraints are as follows:the values of the PSF are positive; the integral of the PFS is 1;and the frequency width of the PSF is limited to the diffraction limit of the current optical system.In this paper the cost function for PCID is given by Eq.(4):

where Wk(u)is the weight at the frequency u in the kth frame, which is generally generated by the modulation transfer function (MTF) of an optical system without atmospheric disturbance, Dk(u)is the value of the Fourier transform of the captured image at frequency u in the kth frame.Sk(u)is the optical transfer function (OTF) in the kth frame.F(u)is the spectrum expectation of the solved image.andare regularization coefficients.The final restored image is the Fourier inverse transform of F.
3 Technology of simulated observations of the space target in orbit
Scene simulation technology with a 3D model is used to simulate the on-orbit observation images of the space target.The simulation program takes the site of the observation station as the center.And the space target position is calculated according to two-line element (TLE) ephemeris data and the observation time.The field of view is determined by the parameters of the optical system of the telescope and the parameters of the detector.Simulated observation images of different poses are generated by changing the pose of the 3D model.
3.1 Calculating the position of space target in orbit
The simulation program takes the topocentric coordinate as the reference coordinate.TLE ephemeris data of satellite targets can be downloaded from the Internet.However, the position and velocity of the target in topocentric coordinates cannot be obtained directly.It is necessary to transform the coordinates from the Earth center inertial (ECI)coordinate system, to the Earth center Earth fixed (ECEF) coordinate system, and finally to the topocentric coordinate system.The coordinate diagram is shown in Fig.1.
Coordinate conversion steps:
Step 1:Use the simplified general perturbations (SPGP4) model or simplified deep space perturbations (SDP4) model developed by NORAD to calculate the position and velocity of the target object in the ECI coordinate (O-XECIYECIZECI) system [Yu, Guo and Li(2013)].SGP4 is applied to near-Earth objects with a short orbital period of 225 minutes and SDP4 is applied to objects with an orbital period of more than 225 minutes.
Step 2:The position and velocity of the target in the ECI coordinate system are converted to the position and velocity of the target in the ECEF coordinate (O-XECEFYECEFZECEF)[Dou and Yue (2016)].
Step 3:The position and velocity of the target in the ECEF are converted to the position and velocity of the target in the topocentric coordinate (Oobs-XobsYobsZobs).

Figure 1:The coordinate diagram
3.2 Target pose definition
The coordinates of the target (Otrg-XtrgYtrgZtrg) are shown in Fig.2.The origin of the orbital coordinate system is at the centroid of the target; the Zorbitaxis points from the origin of the coordinate system to the Earth's centroid; the Yorbitaxis is the cross product of the Zorbitaxis and instantaneous velocity of the target; the Xorbitaxis is the cross product of the Yorbitand Zorbitaxes.The orbital coordinate system is a Cartesian coordinate system that obeys the right-hand rule.The relative pose of the target refers to the pose change of the target coordinate system to the orbital coordinate.The Euler angle is rotated in ZXY order to represent the relative pose of the target.The Yaw, Pitch, and roll are:Yaw θ:the angle between the projection of the Ytrgaxis in the XorbitOorbitYorbitplane and the Yorbitaxis;roll γ:the angle between the Ytrgaxis and XorbitOorbitYorbitplane; pitch φ:the rotation angle of the target around Ytrgaxis, as shown in Fig.3.
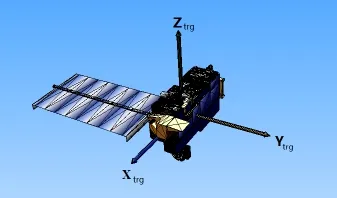
Figure 2:The coordinate of the target

Figure 3:The rotation sequence diagram of ZXY
3.3 The rotation angle of solar panels
The energy provided by the solar panels per unit area depends on the angle between the normal direction and the solar vector direction.To improve the usage ratio of the solar panels and maximize the area of sunlight acceptance, there are special diurnal orientation adjustment strategies.In Fig.3, for example, the solar panel rotates around the Y axis with only a single degree of freedom.In the target coordinate system, the normal vector of the solar panel is the Z axis.The angle that the solar panel needs to rotate for the diurnal orientation can be obtained by calculating the angle between the projection of the inverse direction of the Sun in the XOZ plane and the Z axis.
3.4 Simulating observing the space target in orbit
The field of view is calculated for the simulation program according to the detector resolution, pixel size, and optical system focal length.The projective imaging is carried out by the rendering program with the 3D model, the observation time, and the position of the target.
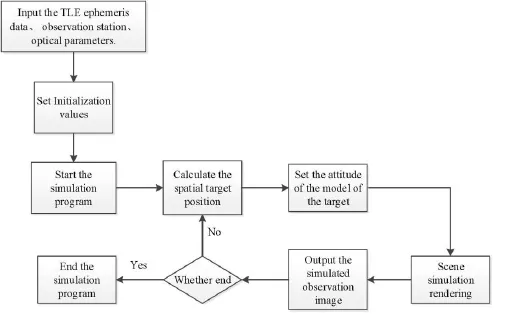
Figure 4:The flow of simulating the observation image of the space target in orbit
The simulation process is as follows:
Step 1:Input the TLE ephemeris data of the target, the address of the observation station,the detector resolution, the pixel size, and the focal length of the telescope;
Step 2:Set the field of view of the simulation program and the observation station address;
Step 3:Start the simulation program;
Step 4:Calculate the spatial target position according to the observation time and the TLE ephemeris data;
Step 5:Set the pose of the target model according to the given pose (yaw, pitch, roll);
Step 6:Render the scene simulation according to the position, the model, and the pose of the target;
Step 7:Output the simulated observation image;
Step 8:Loop to Step 4 and input the next frame observation time and the pose of the model until receiving the stop command and go to Step 9;
Step 9:End the simulation program.
4 Pose estimation of the space target based on model matching
The observation image of the space target in orbit is constructed with the simulation program described in Section 3.When the pose of the simulated target model is the same as the real target pose, the simulated observation image is most similar to the actual observation image; and the matching results of the two sets of images reach the optimal value or the local optimal value.According to the change of the correlation of the two images, the pose estimation of the spatial target can be realized by changing the pose of the target model to search for the optimal value.Because the relationship between the pose of the target model and the simulated observation image generated by the projection cannot be directly analyzed with the mathematical model, the search direction can only be determined by calculating the change of the correlation result.
4.1 Model pose matching method
The HRI restored from the actual observation image by the PCID algorithm is expressed as Eq.(5):

where N is the pixel number of the HRI and t is the observation UTC time.
The simulation observation image is expressed as Eq.(6):

The simulation observation image is determined by the pose and position of the observation camera and the pose and position of the target model, so can be expressed as Eq.(7):

where θtφtγtis the relative pose of the target model andis the position of the target model.C0is a constant term determined by the pose and position of the observation camera.
Since XtYtZtcan be calculated by the TLE ephemeris data at the observation time t, only θtφtγtneeds to be adjusted for matching.When the pose of the model target is the same as the pose of the actual target,is most similar to.The model pose matching process can be regarded as the process of finding the max similarity value betweenand Io, which is expressed as Eq.(8):

The gradient method is used to solve the maximum value problem.Gradients with respect to relative pose are expressed as Eqs.(9-11):

The similarity measurement is divided into two main categories:Distance measurement and correlation measure.For all kinds of distortion the correlation measure is superior to the distance degree, and the correlation measure is insensitive to the change of noise and light intensity.In this paper the normalized correlation metric is used as the similarity measure, which is calculated using Eq.(12):

4.2 Real-time model pose matching process
The simulation observation images of different relative poses of the target model are obtained by the simulation program in real-time.The model pose matching algorithm steps are as follows:
Step 1:Input the actual observation image;
Step 2:Restore the actual observation image by the PCID algorithm;
Step 3:Input the observation time t, the initial yaw θ0, the initial roll γ0, the initial pitch φ0, the search step α, maximum iteration number Q, step size of gradients:dθ, dφ,dγ and calculate the initial correlation value R0using Eq.(12);
Step 4:Initialize and start the thread of the simulation program;
Step 5:Set the relative pose of the target model to(θk−1+dθ ,φk−1,γk−1), obtain the simulation observation image Isk−1(d θ), calculate the correlation value using Eq.(12)and calculate the gradient dθusing Eq.(9);
Step 6:Set the relative pose of the target model to(θk−1,φk−1+dφ,γk−1), obtain the simulation observation image Isk−1(d φ), calculate the correlation value using Eq.(12)and calculate the gradient dφusing Eq.(10);
Step 7:Set the relative pose of the target model to (θk−1,φk−1,γk−1+dγ), obtain the simulation observation image Isk−1(d γ), calculate the correlation value using Eq.(12)and calculate the gradient dγusing Eq.(11);
Step 8:Update the relative pose of the target model:θk=θk-1+α *dθ, φk=φk-1+α *dφ,γk=γk-1+α *dγ.
Step 9:Set the relative pose of the target model to (θk,φk,γk), obtain the simulation observation imageand calculate the correlation value Rkusing Eq.(12);
Step 10:k= k+1, go to Step 5 and repeat until the termination condition is satisfied:≤tole or k>Q.
Step 11:Output the estimation result (θk,φk,γk).
The search process is shown in Fig.5.
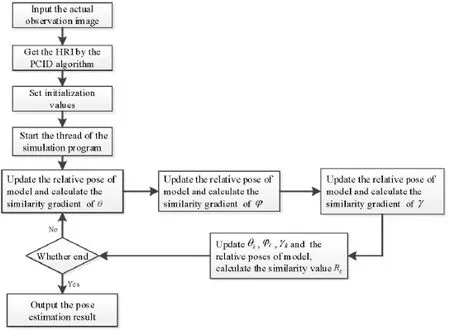
Figure 5:The flow of the real-time model pose matching
5 Simulation experiment
To illustrate the effectiveness of the method proposed in this paper, the pose analysis software was compiled by using the Qt Creator software tool.The satellite Terra is taken as the analysis target and the relationship between the pose of the target model and the correlation value of the simulated observation image and the actual observation image is analyzed.The TLE ephemeris data of the Terra satellite is shown in Tab.1.

Table 1:The TLE ephemeris data of the Terra satellite
Suppose, the diameter of the telescope is 2 m, the focal length of the optical system is 75 m, the pixel size of the detector is 8 µm, and the resolution of the detector is 300×300.Changchun is taken as the site of observation station, the latitude is 43.88°, the longitude is 125.35° and the attitude is 200 m.When the observation time is selected at2017-06-10 13:23:30 UTC time, the initial pose of model target is yaw:, pitch:, roll:and the simulated observation image is generated by the pose analysis software, as shown in Fig.6.
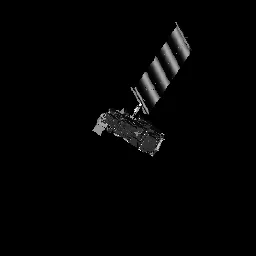
Figure 6:The simulated observation image
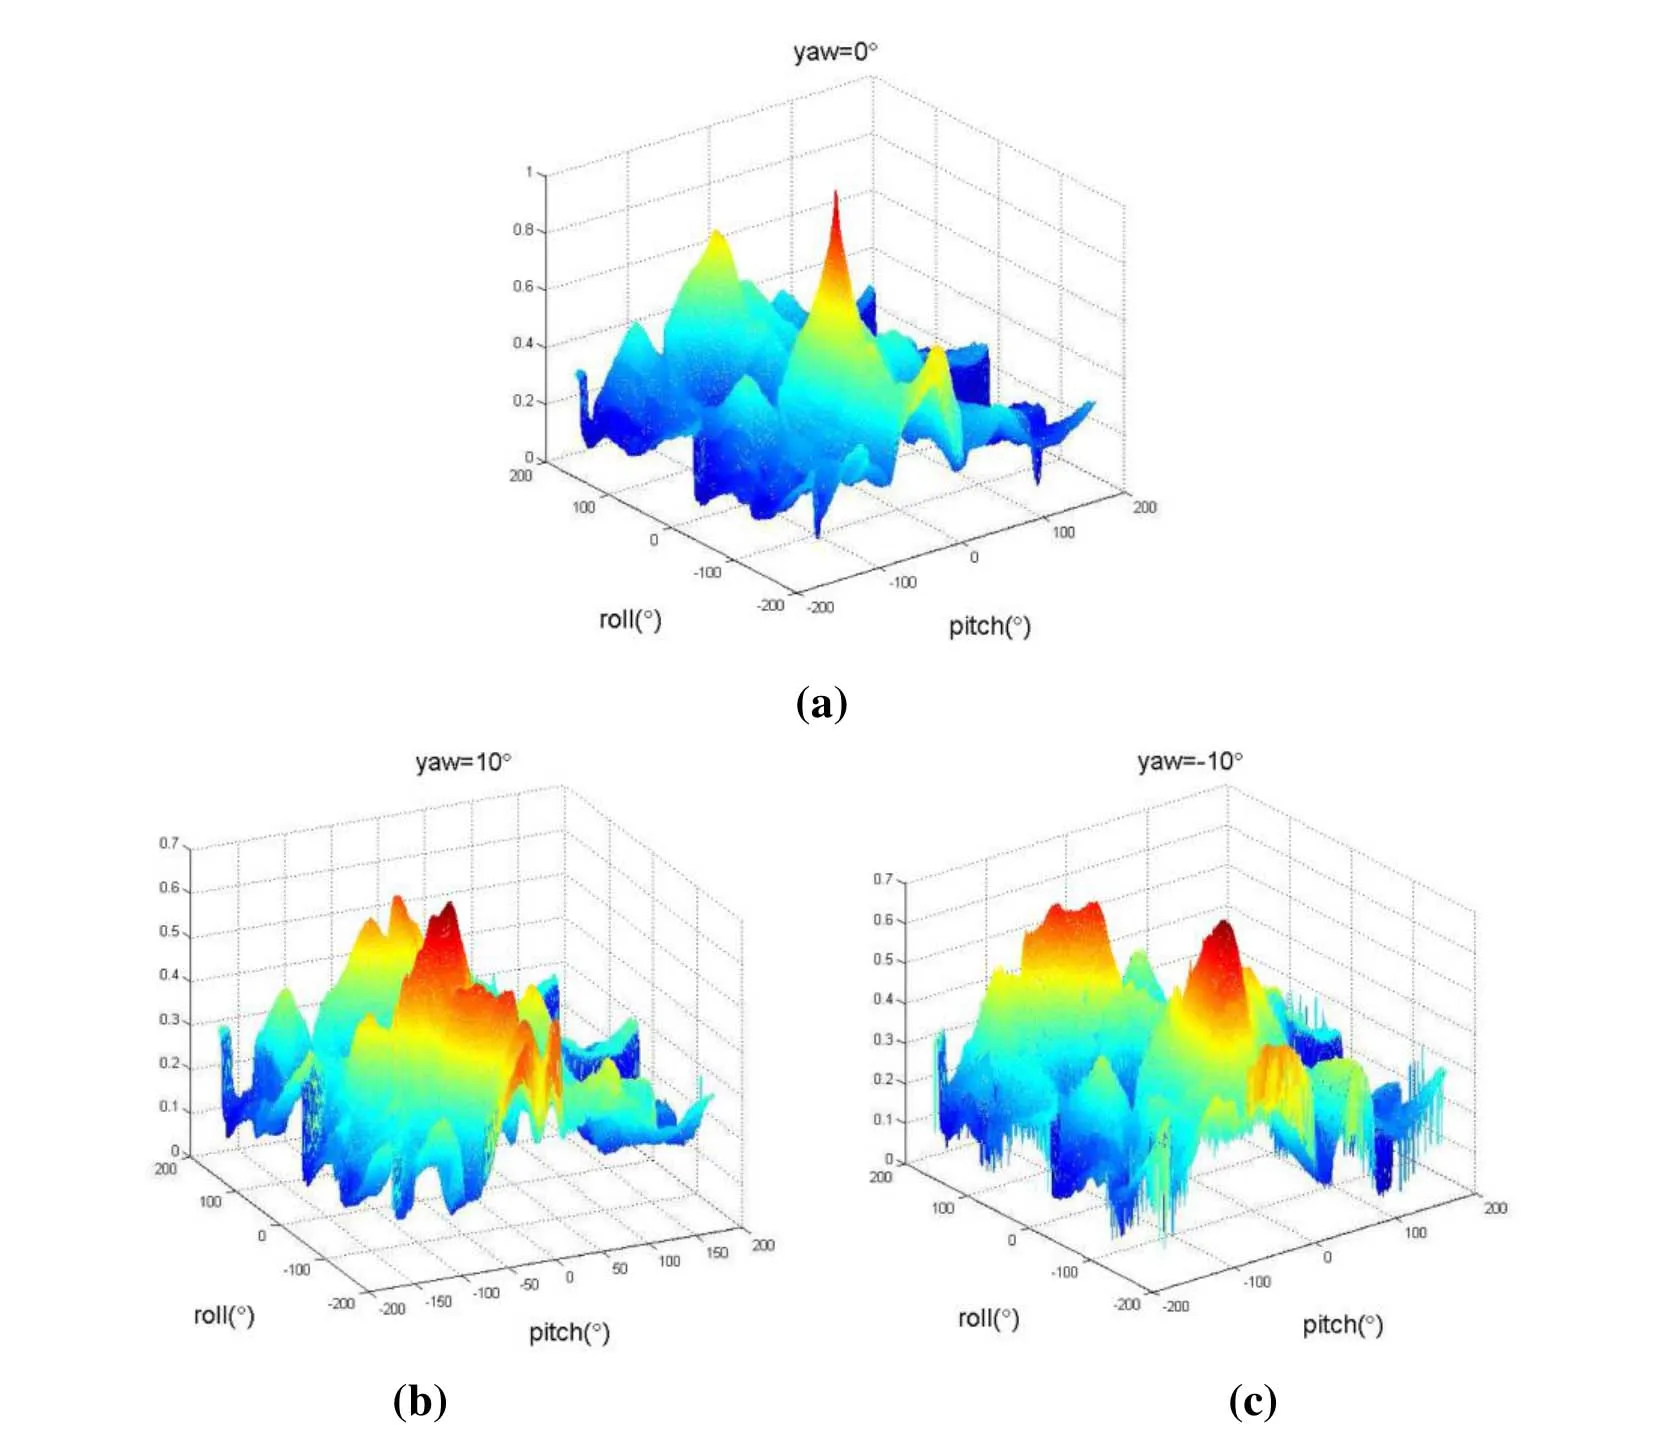
Figure 7:The correl ation value change with yaw, pitch and rol l.(a) The correlation val ue change with pitch and rol l at the yaw val ue of 0°, (b) The correlation val ue change with pitch and rol l at the yaw value of 10°, (c) The correl ation val ue change with pitch and rol l at the yaw val ue of -10°

Figure 8:The Maximum change in correlation value with the yaw of the target model
Fig.6 shows the restoration of the actual observation image used to analyze the relationship between the correlation value and the pose (yaw, roll, pitch) of the target model.The correlation value can be calculated with the change of roll and pitch at different yaws.The range of Yaw is from 0° to 360° and the step size is set to 1°.360 sets of data can be obtained and three sets of data near 0° are shown in Fig.7.It can be seen from the diagram that the correlation value has a local optimal value near the true value.The curve of the maximum correlation value with the yaw is shown in Fig.8.If the initial pose is within the valid range of the mark, the program can rapidly reach the optimal value.There is a maximum value at the real yaw value of 0°.Because of the symmetry of the target model, there is also a local optimal solution at 180°, and this solution can be ruled out by the changing trend of the preorder pose.
Due to atmospheric turbulence, observed images degrade and the error of pose estimation is relatively large.Therefore, image restoration is needed to improve the accuracy of pose estimation.The actual imaging process is simulated; the PCID method described in Section 2 is used for image restoration; and then pose estimation is carried out using the method proposed in this paper.The PSF of the telescope is generated according to Eq.(2)and Eq.(3).Assume the atmospheric coherent length is 10 cm and the sampling point of the phase screen is 256×256.The degradation results of Fig.6 with Gaussian noise are shown in Fig.9.

Figure 9:The turbulence-degraded image sequence with Gaussian noise generated by the simulation software
The restoration result obtained by the PCID algorithm is shown in Fig.10.The pose estimation method presented in this paper is used to analyze the pose of the target in Fig.10.As shown in Fig.8, if the initial yaw of the target model is in the effect area, the searching method proposed in this paper can reach the real value.In fact, the changing pose of the target is continuous.Therefore, the pose of the first image only needs to be artificially estimated for the continuous observation image.The next frame can use the result of previous frame as the initial pose.As seem om Fig.10 setting the initial pose of the target model as (5°, 2°, 2°), the estimation results by the method proposed in this paper are the same maximum correlation value Rmax=0.8470, and the pose of the target model is (1.476°, 1.417°, 0.5°).A sequence of HRIs of different poses of the target model is obtained by the same way.Pose estimation results of HRIs are shown in Tab.2.The average value of pose estimation errors is 1.6349°, and the standard deviation is 0.6708°.
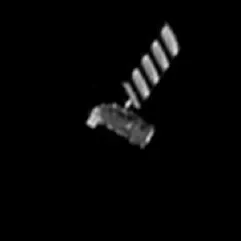
Figure 10:The restored image by PCID
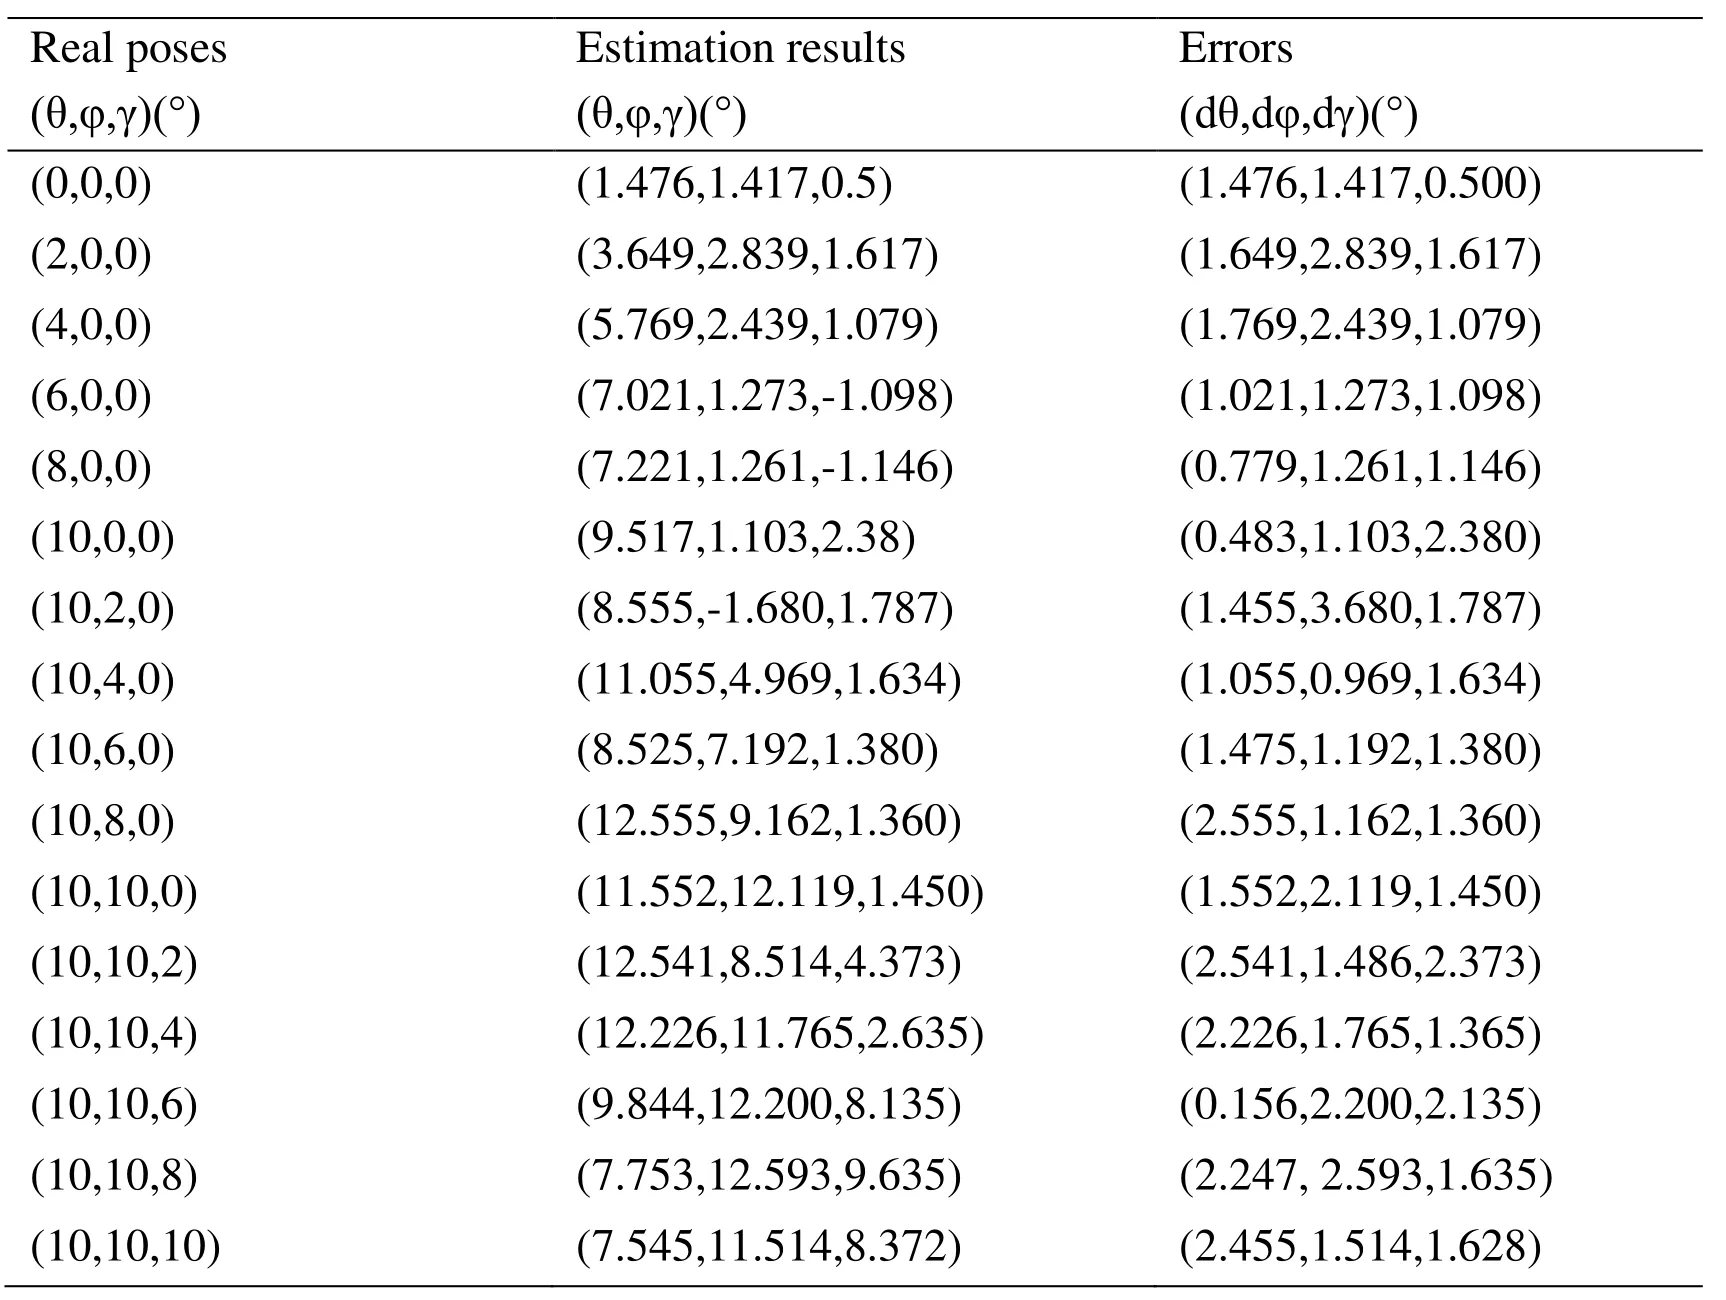
Table 2:Pose estimation results of sequence HRIs
The average value and the standard deviation of pose estimation errors are calculated as Eqs.(13,14):
6 Conclusions
In this paper the actual observation process of a large aperture ground-based optical telescope is simulated, and the simulated observation image of the target in-orbit is obtained.The optimal search strategy for the pose of the target model is proposed to match the actual observation image with the simulated observation image.So, the relative pose estimation of the target can be realized.The actual images observed by groundbased telescopes are seriously degraded by atmospheric turbulence.Using the PCID algorithm to restore the actual observation image can effectively improve the image resolution, and then the accuracy of pose estimation of the space target can be improved.The simulation results show that, under ideal conditions, the maximum correlation is obtained when the pose of the simulation target model is the same as the pose of the real target.And the curve of the maximum correlation between the simulated observation image and the observation image along the yaw reaches the optimal value or the local optimal value at the position of the real yaw of the space target.The strategy of searching for the maximum correlation value through the yaw, pitch and roll of the target model proposed in this paper will ultimately converge to the optimal value.For simulated actual observation images, and after processing by the PCID algorithm, the average value of pose estimation errors is 1.6349° and the standard deviation is 0.6708°.So, the method proposed in this paper can be used as an effective method for pose analysis of space targets in orbit observed by large-aperture ground-based telescopes.As simulation images of different poses can be easily obtained, future work will try to use the deep learning method to auto estimate the initial pose for the first image.
Acknowledgements:We would like to thank LetPub (www.letpub.com) for providing linguistic assistance during the preparation of this manuscript.
 Computer Modeling In Engineering&Sciences2018年11期
- Computer Modeling In Engineering&Sciences的其它文章
- On the Robustness of the xy-Zebra-Gauss-Seidel Smoother on an Anisotropic Diffusion Problem
- A Shaft Pillar Mining Subsidence Calculation Using Both Probability Integral Method and Numerical Simulation
- Modeling and Control Strategy of Built-in Skin Effect Electric Tracing System
- A Virtual Boundary Element Method for Three-Dimensional Inverse Heat Conduction Problems in Orthotropic Media
- Kautz Function Based Continuous-Time Model Predictive Controller for Load Frequency Control in a Multi-Area Power System
- Individualized Design of the Ventilator Mask based on the Residual Concentration of CO2